
Abstract
It is important to examine changes in driving performance and driver behavior with increasing age to improve road safety. The main purpose of this study was to explore if there were any differences in a group of young drivers (n = 36, Mage = 32) and a group of elderly drivers (n = 40, Mage = 72) on driving performance and driving skills on a number of driving tasks. An on-road driving test was conducted using a fixed 25-km route lasting approximately 30 minutes. Expert examiners assessed the participants’ driving skills and performance using assessment form measuring seven categories: car handling, observation/overview, signaling, positioning, speed adaption/risk, traffic flow/assessing gaps, and give way/traffic flow. Younger drivers reported significantly longer annual mileage (mean = 24,719 km) than older drivers (mean = 12,750 km). There were no significant group differences on self-reported number of accidents the last 3 years, driving frequency, or self-assessment scores. Independent sample t-test results show that compared to older drivers, the younger drivers scored significantly higher on 4 out of totally 32 category items in the assessment form. Two of them were in category total scores; car handling total score and speed adaption/risk total score, the other two were subcategory scores; use of controls and following traffic flow. The results indicate that aging itself and/or potential negative age-related decline in certain functions important for safe driving do effect driving performance, but less than expected and commonly assumed. One plausible explanation is that older drivers use compensatory actions related to factors like maturity and a behavioral adaptation to overcome difficulties in driving.
Introduction
The process of aging causes several structural and functional changes leading to decrements across a wide range of visual, cognitive, and motor functions (Bae et al., 2017; Leversen et al., 2013; Schultheis & Manning, 2011; Shinar, 2007). This in turn leads to a decline in the competence to perform common daily tasks, including driving a car. Such a reduction in overall driving ability and performance in various traffic situations might have substantial implications in the overall safety for older drivers (Schultheis & Manning, 2011; Shinar, 2007).
Car driving requires well-functioning perceptual-motor skills, necessitating the integration between input information (perception) and output responses (actions; Levin et al., 2009). In terms of the latter, it requires high-level cognition, including inhibition of competing responses, planning, ability to shift between tasks and decision-making all requiring substantial involvement of executive functions (Anstey et al., 2005). These cognitive processes involved in driving are all subject to a decline due to aging (Freund & Smith, 2011; Glisky, 2007; Young et al., 2018).
Similarly, older drivers have longer response times than younger individuals on cognitive performance tasks placing demands on attentional and visual processing abilities (Salthouse, 2000). This is a phenomenon referred to as the “slowing effect” (Verhaeghen & Cerella, 2002). This age-related decline will inevitably have an impact on an array of activities of daily life, including driving (Anstey et al., 2005). Similarly, old age is associated with increased reaction times (Birren & Fisher, 1995). Both simple and choice reaction time show systematic age-related declines (Stuart-Hamilton, 2012). The effects on reaction times gets proportionately larger in choice reaction time measures showing a complexity effect caused by a slower and less efficient nervous system (Stuart-Hamilton, 2012). Given that driving is a task that requires relatively quick and precise responses in a dynamic and complex traffic environment, increased response/reaction times can affect the choices and behavior of older drivers in various traffic situations (Deary & Der, 2005).
Because of the decline in cognitive, visual, and motor related behaviors caused by aging, it is not surprising that studies have examined differences between older and middle-aged/younger drivers on various parts of driving skills and driving performances relevant to safe driving, using specially designed on-road tests, driving simulators, and film/videos on a monitor/PC screen or similar. For example, Rabbitt et al. (1996) found skills like vigilance, speed, and distance judgments and coordination to be difficult for older drivers. Furthermore, it has been reported that older drivers need more time than middle-aged drivers to make decisions in merging situations (Wolffelar et al., 1991), younger and older drivers differ in numbers of eye movements (Maltz & Shinar, 1999), visual search strategies (Bao & Boyle, 2007), scanning for hazards in intersections (Romoser et al., 2013), and on reaction time in tasks involving choice reaction and visual complexity (Leversen et al., 2013). Other studies, on the other hand, argues that it is not the age-related declines that cause an increased accident rate among older drivers but a reduction in spending significantly less time on the road when getting older (Hakamies-Blomqvist et al., 2002; Langford et al., 2006). Furthermore, Levin et al. (2009) found no differences between old and young drivers on gaze, visual behavior (scanning), or choice of speed when entering an intersection, and Borowsky et al. (2010) argued that older drivers detected more hazardous situations than younger drivers did, concluding that the overall ability to perceive hazards in intersections was not affected by age. Indeed, some studies have suggested that aging itself does not necessarily impair driving performance or increase crash risk, it is medical conditions like sensory and cognitive impairment and dementia that primarily contribute to poor driving performance (Ball & Owsley, 2003; Wagner et al., 2011; Wood, 2002). As such it appears that the findings on older people driving performance are equivocal. Some of the differences between studies might be due to methodological variations across studies. Surprisingly, studies have not compared driving performance differences between healthy drivers of different age using the criteria for on road driving tests.
The Present Study
Based on the presented considerations, and to enhance the ecological validity of findings, the specific aim of this study was to compare real on-road driving performances in healthy and experienced older vs. younger drivers using an assessment form based on current driving-license examination guidelines in Norway and items from other tests designed for testing driving performance. Use of on-road tests and expert examiners to assess driving skills and driving performance are referred to as a “gold standard” assessment (Bellagamba et al., 2020). An on-road test conducted in real road and traffic environment are likely to give a more nuanced impression of driving skills and performance compared to only use of driving simulators, VR-glasses, or similar. However, it is important to notice that the reliability and validity of on-road tests have not been adequately researched. No prior systematic review has solely verified on-road test reliability and validity (Sawada et al., 2019). Even if a fixed route was used in this study, we are also fully aware that an on-road test has its limitations regarding factors like familiarity, variety in traffic situations and challenges (lack of standardization and controllability), and differences in assessment and score points given by examiners.
Materials and Methods
Sampling and Participants
The participant-inclusion criterium in this study was age. The study consisted of 36 younger participants (21 males and 15 females aged between 21 and 50) and 40 older (28 males and 12 females aged between 65 and 83) all with a valid Norwegian driving license category B (see Table 1 for demographic information). The younger-group were recruited from a group of students at Nord University, and the older-group among costumers above 65 years old at the insurance company Gjensidige, Stjordal Brannkasse. The younger group in our study has a variability of ages from 21 to 50 and number of years holding a driving license from 4 to 30, which can be considered as a wide range. In previous studies related to road safety and age, 65 years is commonly used as a “split-age” between “younger” and “older drivers” (e.g., Hakamies-Blomqvist et al., 2002). Thus, we divided our participants into two groups as lower and above 65 years old. Participation in the study was voluntary.
Descriptive Statistics on Study Variables: Younger and Older Group.

Two tailed Mann-Whitney U test, p-values in
None of the participants had primary uncorrected visual deficit. About 31 participants (77.5%) of the older group wore glasses while driving, none in the young group. All participants were healthy without any medical conditions that could interfere with their driving, and they had all been driving for at least 3 years and were still driving. All participants signed an informed consent form prior to their participation, and The Norwegian Centre for Research Data (NSD) gave ethical approval for data collection and storage.
Measurements
On-road driving test
Prior to conducting the on-road driving test, the participants completed a questionnaire regarding demographic information and driving behavior.
The assessment of on-road driving performance was carried out on a fixed route of about 25 km containing urban, suburban, and countryside environment. It took about 30 minutes to complete the route which contained 13 give-right-of-way junctions (an equal number straight forward, right, and left turns), 6 roundabouts, 4 junctions with give-way signs (straight forward, left, and right-turns), 4 situations leaving a major road to the left, and 3 situations entering a major road (left and right, regulated by signs). All situations are common to everyday driving with variations in traffic volume and speed limits. All participants used a Peugeot 308 SW with a manual five-speed transmission equipped with dual controls: two extra rear-view mirrors, one to observe the driver’s eye movements, one to observe traffic behind, and two extra exterior mirrors.
Assessment of driving performance
Three expert driving examiners assessed the participant’s driving performance. All three were experienced supervisors for driving instructor students and had more than 20 years of experience in assessing driving performances as driving instructors, driving license examiners and/or driver instructor-student supervisors. The three examiners assessed one old group (13–14 participants) and one young group (12 participants) each. The driving assessment was carried out over a period of 14 days in June with summer conditions, daylight, and good visibility. The participants received no feedback from the examiner, neither during the test nor after completion of the test. Vocal messages on where to drive were given by the examiners.
Assessment form and score guidelines
The examiners rated the driving performance using a specially designed assessment form divided into seven main categories: car handling, observation/overview, signaling, positioning, speed adaption/risk, traffic flow/assessing gaps, and give way/traffic flow (see Table 2). The chosen categories are based on the official Norwegian category B driving test (Norwegian Public Roads Administration, 2009) and three other test designed to assess older drivers’ driving behavior; the P-drive test (Performance Analysis of Driving Ability) designed to test driving performance after stroke (Patomella et al., 2006), a test designed to identify unsafe older drivers with clinically significant declines in mental abilities (Dobbs et al., 1998). Finally, six behavioral categories (search/observation, speed, signaling, positioning, steering, and lane-keeping) classified from a 25-items checklist and a total score by examiners were included.
The Assessment Form.
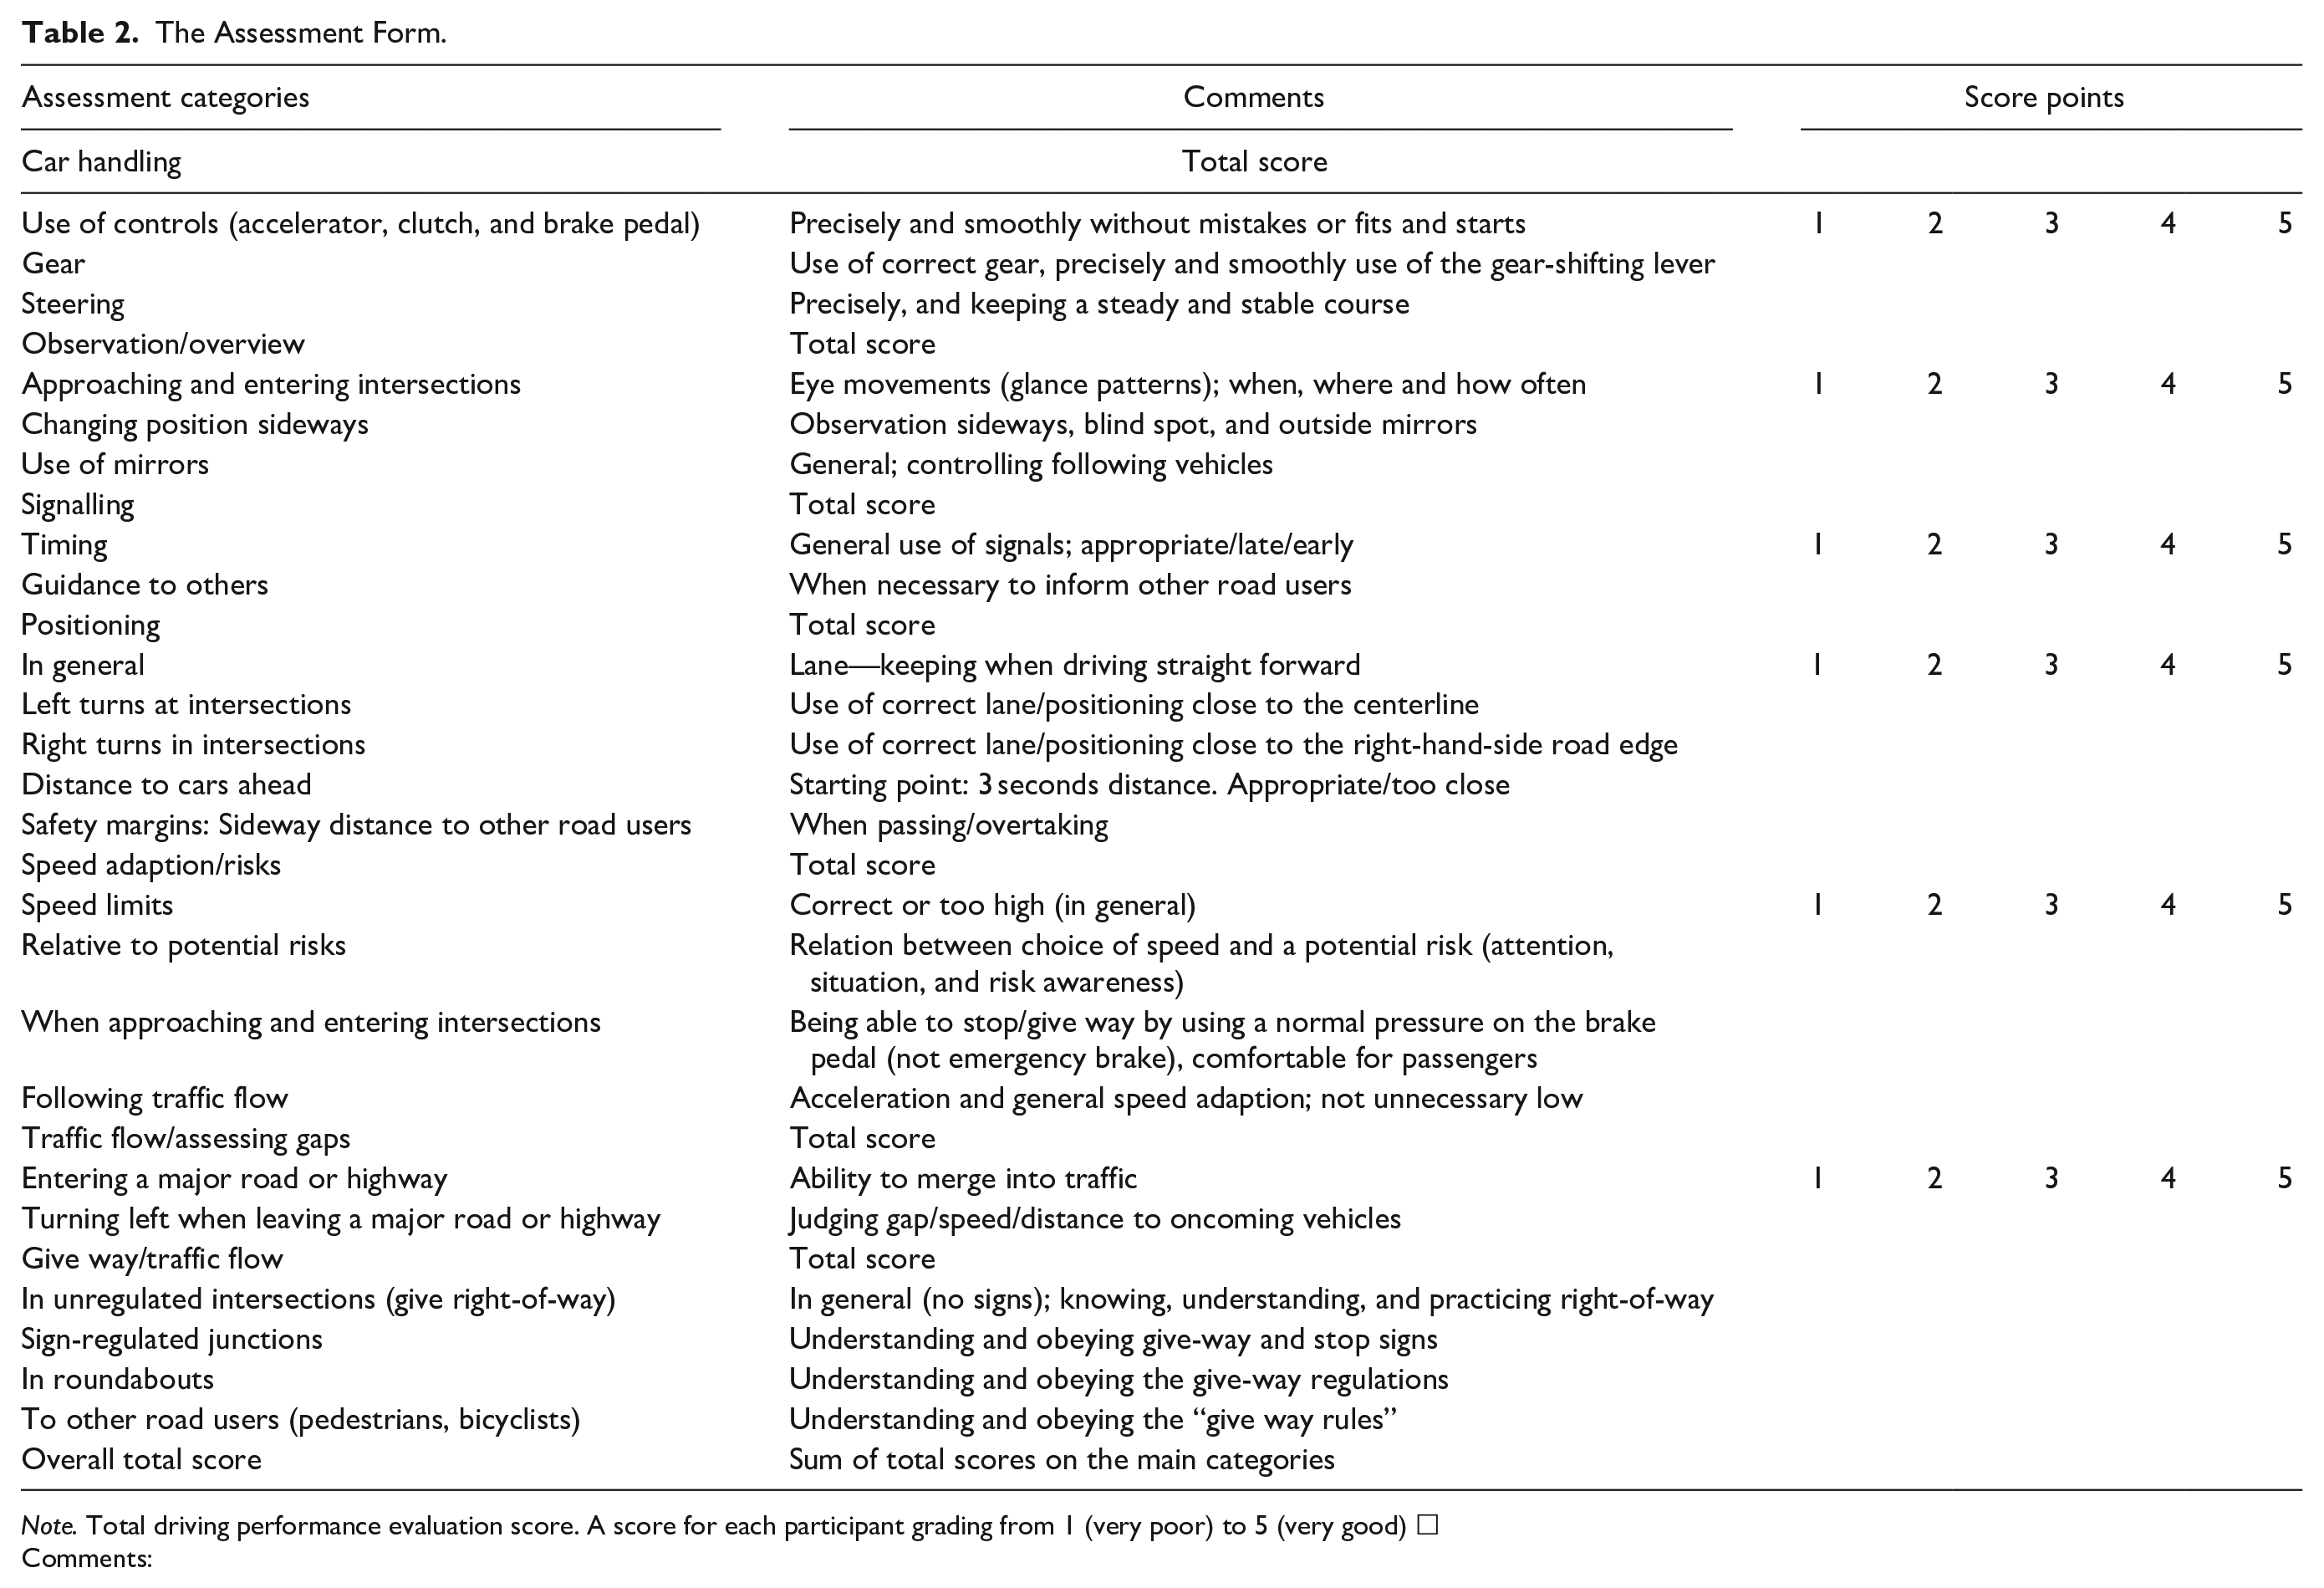
Note. Total driving performance evaluation score. A score for each participant grading from 1 (very poor) to 5 (very good) □
Comments:
The grading system was based on the following evaluations: (1) The performance is not acceptable. The candidate exhibits extremely deficient skills and lack of understanding of risks that could cause or causes hazardous situations, the examiner had to take control of the vehicle, physically or verbally. (2) The performance is generally weak; the candidate displays a lack of understanding and insufficient automation of driver skills. (3) The performance is acceptable (good, as expected from an average driver). (4) The performance is very good. The candidate demonstrates a consistently very good road traffic understanding and automated driving skills at a level above average and has a sufficient overview and flow. (5) The performance is excellent (expert level). The candidate demonstrates skills and understanding of road traffic on a level far above what one can expect.
The assessment form and grading scales were pilot tested using six employees at Nord University as participants. The participants were asked to comment on the content of the fixed test route such as the degree of difficulty, normality regarding driving tasks, and length and environmental variation. Test scores from each examiner were compared and discussed and used as foundation for forming criteria and guidelines for scoring. Secondly, the assessment form and grading scales were tested by expert examiners, in which two assessors simultaneously rated the same young drivers (n = 17, age range = 21–34, Mage = 21.7 years, and SD = 3.82). The inter-rater reliability was estimated by using ICC (Shrout & Fleiss, 1979), and indicated a good inter-rater reliability for overall total score (ICC = .929) and total performance evaluation score (ICC = .939).
Results
All analyses are done by using IBM SPSS statistics 23.0. Differences between younger and older drivers in demographic information and background variables (Table 1) were examined by conducting a two-tailed Mann-Whitney U test with p < .05 as statistical significance criterion. In addition, to compare young and old drivers’ driving performance scores, an independent samples t-tests were conducted.
Significant differences between the two groups on descriptive statistics were found in two variables (see Table 1): Number of years holding a driving license and mileage (km/year). The mileage per year in the younger group (mean = 24,719 km) was significantly higher than mileage in the older group (mean = 12,750 km). The younger group had been in possession of a driving licence for 16 years on average, participants in the old group for 49 years on average.
The t-test results comparing the driving tests between the two groups are presented in Table 3. Compared to the older drivers, younger drivers achieved higher total mean scores on all nine main-category variables (see Tables 2 and 3), but significantly higher on only two of them, car handling total scores and speed adaption/risks. In addition, younger drivers also achieved higher mean scores on 21 out of 23 underlying subcategory variables, significantly higher on only 2 of them; use of controls and following traffic flow. On the other hand, the older drivers achieved slightly higher mean scores compared to younger drivers on two variables; right turn in intersections and, surprisingly, on left turns when leaving a major road.
Comparison of Driving Performance Test Scores Between Young and Old Drivers.
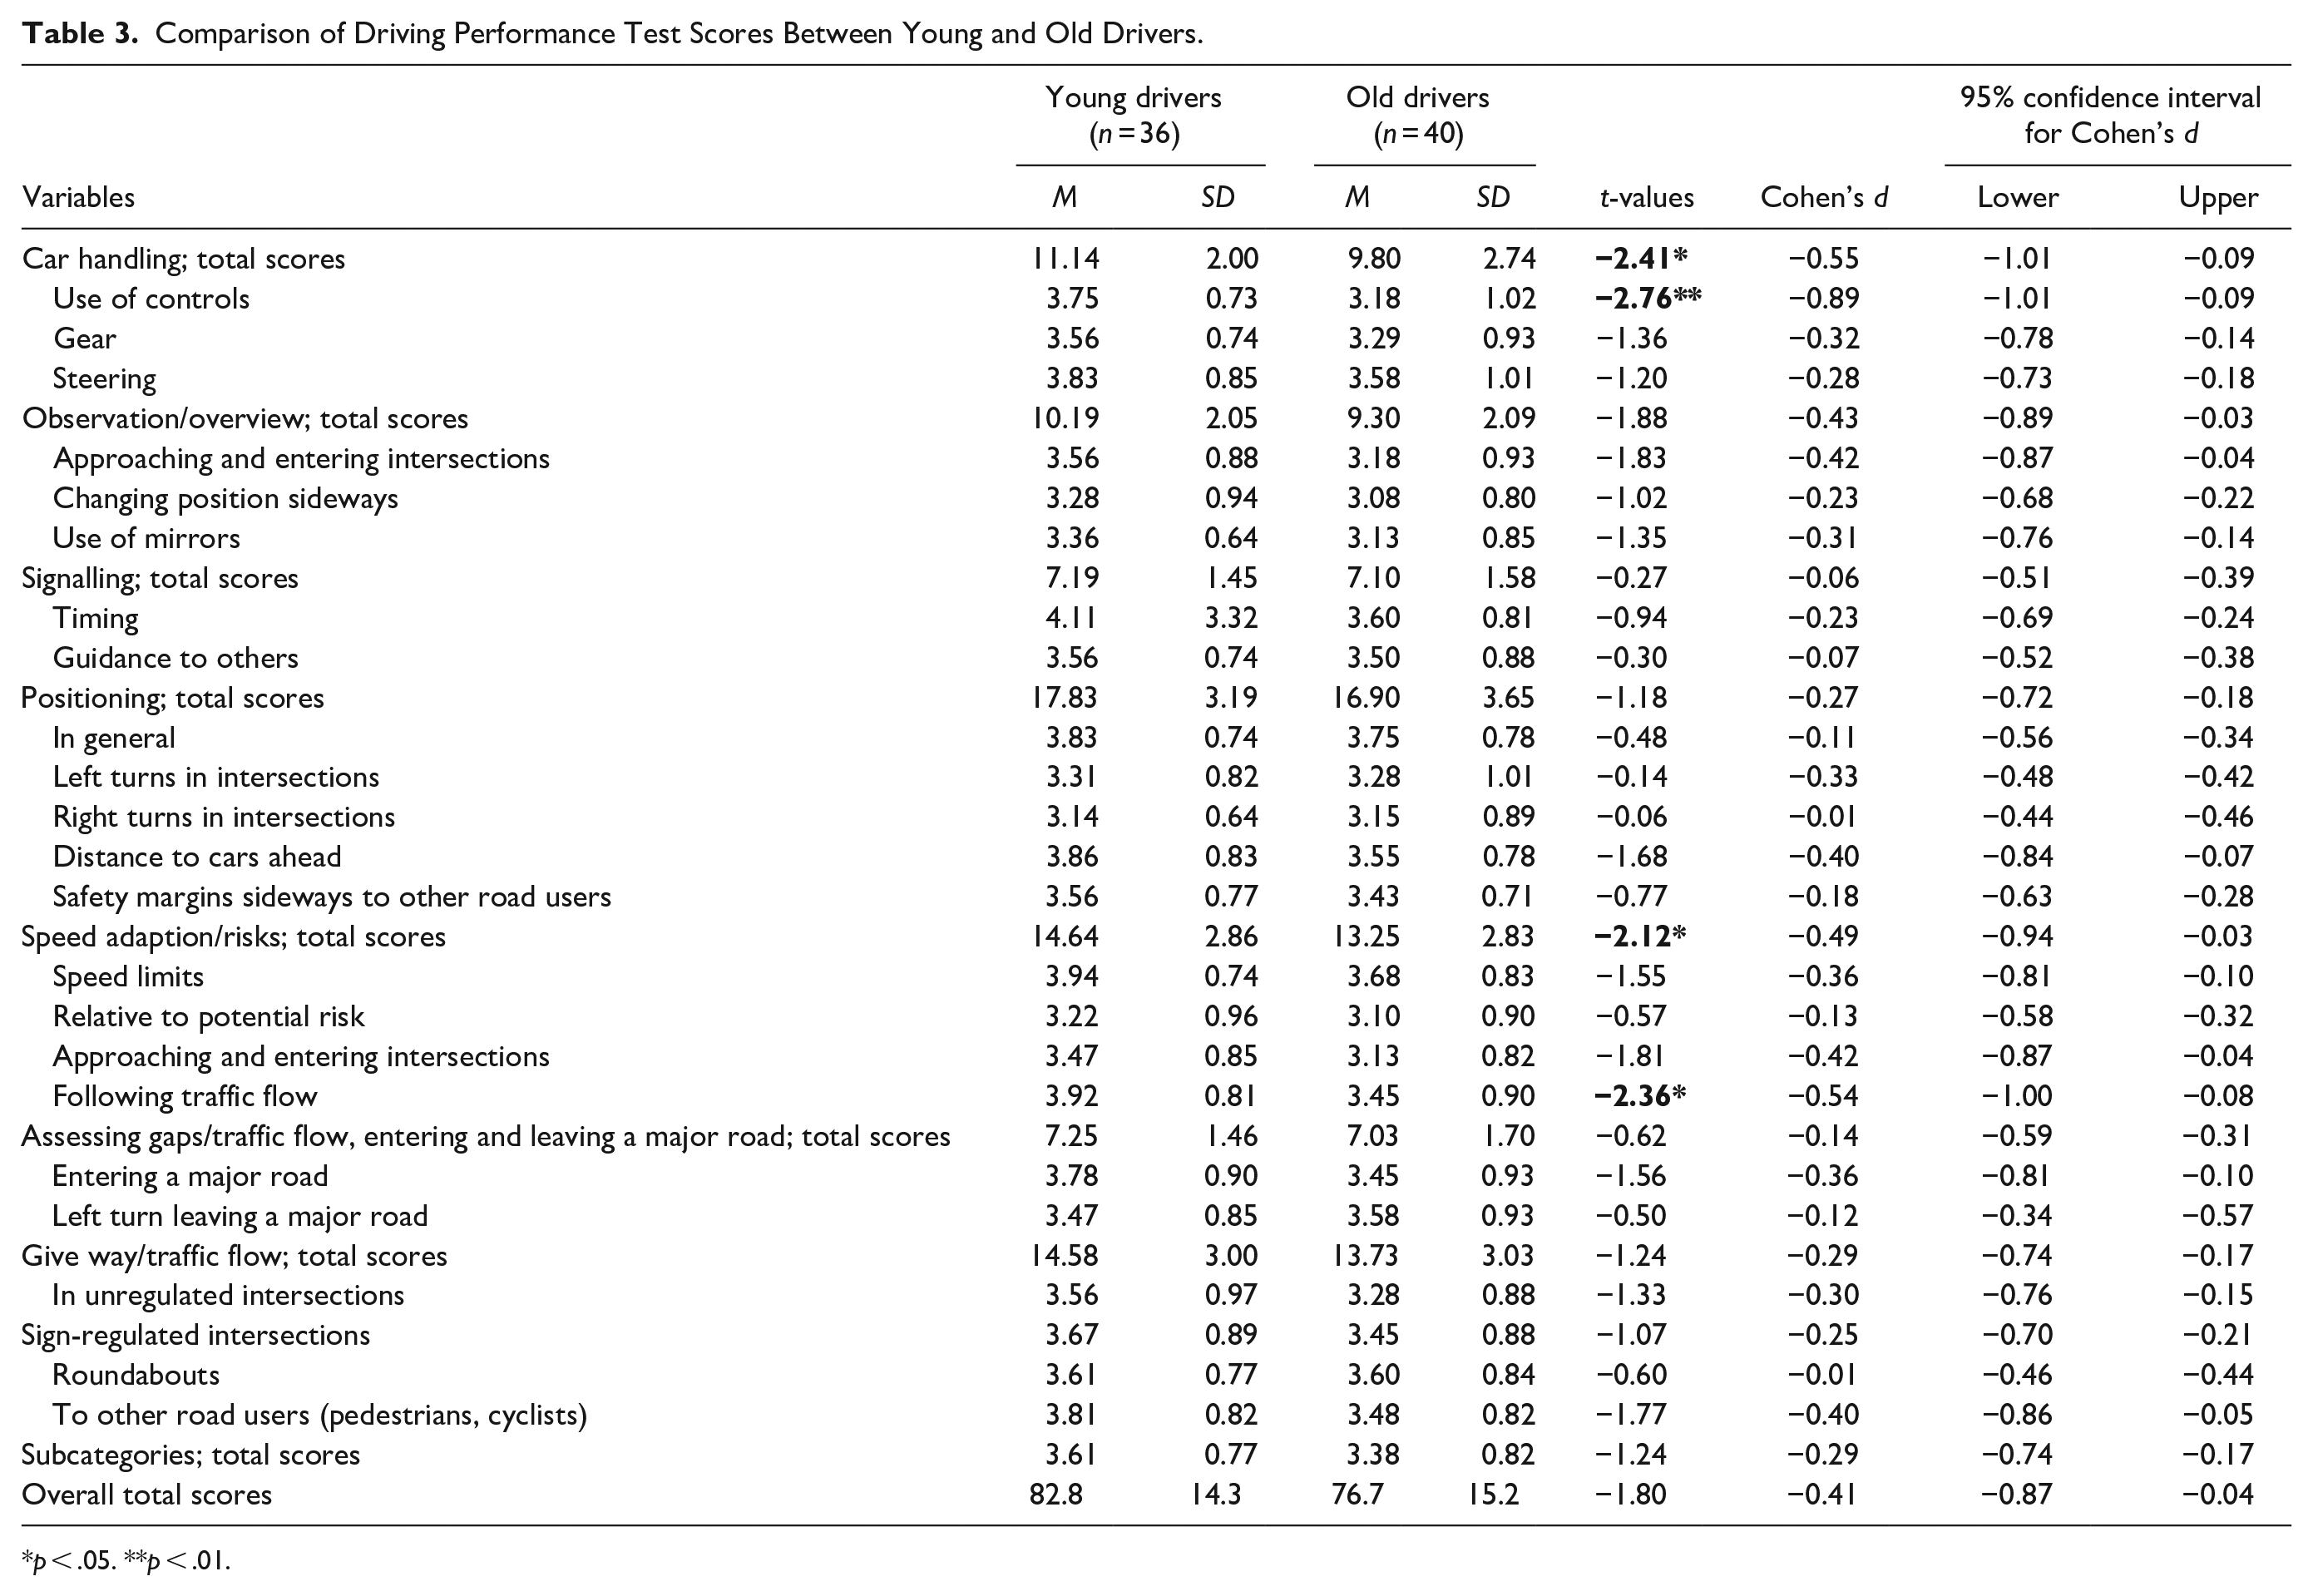
p < .05. **p < .01.
Table 3 also includes effect sizes of differences between mean scores, the Cohen’s d (Cohen’s standard deviation unit). The effect-size values in a Cohen’s d analyze are ranked from 0.20 (small effects), 0.50 (medium effects), and 0.80 (large effects; Cohen, 1988; Pallant, 2011).
The variable use of controls shows a Cohen’s d-effect size of −0.89, considered as a very large effect. The other significant variables vary in Cohen’s d-effect sizes between −0.49 and −0.55, considered as medium effect sizes.
Variables with effect size-values on mean scores between −0.40 and −0.50, (small to medium effects) such as approaching and entering intersections, observation/overview, distance to cars ahead, and give way/traffic flow to other road users could also be of interest to discuss further in a safe driving behavior perspective, but since the group differences are not significant they are not included in the discussion of findings.
Discussion
The aim of this study was to explore how a group of older drivers compared to a group of younger drivers performed in an ecologically valid on-road driving test assessed by expert examiners. Results show that the younger drivers do perform better than older drivers on most of the 32 variables analyzed, but the mean score- and effect-size differences between the two groups are much smaller than one could expect. It is important to take into consideration that on-road testing possesses a lower level of testing—standardization and controllability, even if the test route and driving conditions are relatively similar for all participants. The number of (critical) traffic situations and incidents will vary from participant to participant, and consequently have an impact on the assessment of driving behavior, and thereby, to a certain point, could explain the relatively small age-related effect sizes and differences in scores between the two groups.
Compensatory actions used by older drivers, age related maturity and a behavioral adaptation to overcome potential difficulties and enhance safe driving are also important factors to take into consideration when discussing the small differences found in the study.
However, the two groups differ significantly on two of the main total score-categories; car handling and speed adaption/risks, and on the two subcategory variables use of controls (use of accelerator, clutch, and brake pedal) and following traffic flow.
Older drivers tend to have less precise and smooth use of controls frequently causing a “bouncing-like” driving style, a colloquially well-known expression used to describe driving performance of older drivers. This finding might be explained by studies demonstrating that both gross and fine motor performance tends to decline in old age (Leversen et al. 2012; Svetina, 2016; Young et al., 2018) due to a general age-related slowing of central cognitive processes, especially age-related atrophies in the motor cortical brain regions and corpus callosum resulting in motor slowing, balance gait, and coordination deficits (Krampe, 2002; Seidler et al., 2010; Voelcker-Rehage, 2008). Freund et al. (2008) focused on unintended acceleration resulting from pedal error as a specific incident that had caused several accidents in the US among older drivers. They argued that pedal errors or pedal-confusions are linked to an impairment in executive-control areas in the brain responsible for goal-oriented behavior, and often appears in interaction with panic responses. In the present study, however, the examiners did not report confusion or error in use of controls/pedals.
The older drivers performed significantly poorer than the younger drivers on the subcategory use of controls (Table 3), and these scores contribute essentially to the score on the main category car handling. The other two subcategories in Table 3 (gear and steering) show only minor differences between the two groups. It is not likely to conclude that the difference in the category use of controls have major impact on safe driving and road safety.
The significant difference between the two groups found in the main category speed adaptation/risk is mainly associated with differences in the subcategory following traffic flow (Table 3). The older drivers in the present study showed a slower driving style when it came to following traffic flow, tending to run at a lower speed in general and accelerate more slowly compared to younger drivers. This behavior is supported by a simulator study of experienced older drivers (de Waard et al., 2009). This study found that older drivers drove more slowly on acceleration lanes than a younger group, and this “slower speed”—effect remained after having merged into traffic. Slow acceleration and driving slowly is commonly stated as a typical old driver’s driving style.
The results in this study indicates that the differences in driving performance between younger and older drivers are smaller than one could expect, and, given that the older drivers do not have any medical conditions that affect their driving skills, that normal aging not necessarily impacts road safety negatively.
Limitations
There are some possible limitations of the study which need to be considered when interpreting the findings. The driving test was conducted as an on-road driving test using a fixed route in a rural or small-town area with low traffic density. All participants lived in or near by the area where the test was conducted, some for a long time, others for a shorter time. Variations in familiarity with the test-area environment might be a bias regarding driving performance in favor of those who were most familiar with traffic environment, driving conditions, risks, and challenges in the area used for testing. In this study we do not consider this as a major concern because even if there are differences among participants in the two groups in number of years living in the area, familiarity with driving conditions, local regulations, challenges, and risks are likely to be similar depending on mileage in the traffic environment used for testing. Both the older and younger participants had enough mileage driven in the area where the test was conducted to be sufficiently familiar with the traffic environment and conditions.
All participants volunteered to take part in the study (self-selection), which might have caused a sample bias regarding representability in one or both groups. One might expect that those who volunteered to take part had a special interest in driving and therefor represent an upper-performance sample.
In general, much research using self-reported data as used in a minor part of this study, are less reliable and might jeopardize the quality of outcomes and results. In this study however, only a few variables are self-reported (Table 1). These variables are not directly included in analyzes and are therefore not likely to have an impact on the results.
All driving tests were conducted using a fixed test route in normal small-town traffic environment with relatively low traffic density. Nevertheless, the driving tests were conducted on different times of the day and on various week-days consequently with variations in traffic density, driving tasks, and situational challenges and risks among the participants that might have influenced both controllability and standardization of the driving tasks given each participant in the study.
Conclusions
The present study focused on examining differences between a group of younger drivers and a group of older drivers on driving performance and driving skills on a number of driving tasks.
The main conclusion from the present study is that there are differences between older and younger drivers on driving skills and performance; however, the significant differences found between the younger and older drivers (see Table 3) are relatively few and minor and not likely to have any crucial impact on safety and road-accident involvements. The lack of smoothness in use of controls and tendency to slow down traffic flow might in worst case have an impact on traffic efficiency and consequently create dangerous situations among other drivers and road users by making them impatient and irritated provoking unnecessary risky situations.
There is a need of further studies examining driving behavior, skills, and performance between younger and older drivers, in particular in ecologically valid environments.
Footnotes
Declaration of Conflicting Interests
The author(s) declared no potential conflicts of interest with respect to the research, authorship, and/or publication of this article.
Funding
The author(s) received no financial support for the research, authorship, and/or publication of this article.