
Abstract
The low carbon living of residents is important for China to achieve the “double carbon goal.” This paper uses the natural language processing technique in machine learning to collect data from 2005 to 2020, constructs the government’s “green will” index and residents’ low-carbon life index, and conducts an empirical study through a static panel model and a dynamic panel model. The study shows that: (a) all cities in the Yangtze River Delta pay more and more attention to low-carbon publicity, but there are individual differences in the degree of attention; (b) in general, the government’s willingness to go green does drive residents to develop a low-carbon life; (c) affluence and human capital growth are positively related to the effect of government low-carbon publicity. Accordingly, the following measures are proposed: increase the government’s low-carbon publicity efforts, deepen education reform, attract high-end talents, strengthen scientific and technological innovation, promote new urbanization, and reduce the marginal cost of carbon emissions.
Keywords
Introduction
Since the industrial revolution, the carbon emissions of the world have posed a serious challenge to the survival and development of human society. As excessive carbon emissions have caused global climate problems and serious natural disasters around the world, the conflict between man and nature has become an issue that everyone must think about today. This solemn commitment highlights China’s determination and commitment to addressing global climate change. The carbon emissions generated by human life account for a large proportion of the total carbon emissions of society. At the Climate Ambition Summit on December 12, 2020, General Secretary Xi Jinping said, “We should vigorously advocate a green and low-carbon production and lifestyle, and seek opportunities and impetus for development from green development.”
China has included the green transformation of production and lifestyle in the document “Outline of the 14th Five-Year Plan and 2035 Vision for National Economic and Social Development of the People’s Republic of China.” The shift in policy focus reflects the need to reduce emissions from the consumption side, and the Chinese government is gradually focusing its emissions reduction efforts on residents’ consumption. Government policies have a greater role in guiding residents’ lives, and Chinese residents are highly sensitive to government policies, while government measures to guide residents to reduce carbon emissions are mainly flexible, that is, low-carbon publicity and education to help the public understand the dangers of excessive greenhouse gas emissions and recognize the importance of a low-carbon economy and low-carbon lifestyle, thereby promoting sustainable economic and social development. Therefore, low-carbon publicity and education are an important part of ensuring the achievement of the “double carbon goal” and play an important role in guiding, supporting, and guaranteeing. If China’s 1.4 billion people can form a green and low-carbon lifestyle, it will effectively contribute to the achievement of the “double carbon goal.”
China has made greater efforts to promote low-carbon efforts. China has taken measures one after another since the 1990s to guide residents’ energy consumption behavior toward energy conservation and emission reduction. For example, the Law of the People’s Republic of China on Energy Conservation came into force in 1998, the State Council launched a resource conservation campaign and issued the “Public Guide to Energy Conservation Behavior” in 2004, and the “National Implementation Plan for Energy Conservation and Emission Reduction” issued in 2007. The Ministry of Ecology and Environment and six other departments in 2021 issued the “Beautiful China, I am an Actor” Action Plan to Enhance Citizens’ Awareness of Ecological Civilization (2021-2025) document, which aims to promote the formation of a universal action system for ecological and environmental governance in China. 2022 China Education issued the “Implementation Plan for the Construction of National Education System for Green Low-carbon Development,” which will build a national education system for green low-carbon development and guide young people to firmly establish the concept of green low-carbon development. To lay a solid ideological and operational foundation for achieving the goal of carbon peaking and carbon neutrality.
Low carbon-related policies are important for China to achieve sustainable development. First, low-carbon policies can promote economic development. The development of low-carbon technologies and industries can drive new economic growth points and provide new impetus for economic development. Second, low-carbon policies can improve environmental quality. Reducing the emission of carbon dioxide and other greenhouse gases can reduce atmospheric pollution, improve air quality, and enhance people’s quality of life. In addition, low-carbon policies can also promote resource conservation and energy security. Low-carbon policies can promote the development of clean energy, energy conservation and environmental protection, and other low-carbon industries, improve the quality and efficiency of economic development, and promote economic transformation and upgrading. Finally, low-carbon policies can promote the progress of social civilization. The promotion of low-carbon lifestyles and consumption patterns can improve people’s environmental awareness and civilizational quality, enhance the country’s international competitiveness and influence, and promote global sustainable development.
The Chinese government also faces many constraints in implementing low-carbon-related policies. Firstly, China’s economic development is unbalanced: China’s economic development is unbalanced, and some regions still have problems such as backward economic development and unreasonable energy structure, which makes it difficult to effectively implement low-carbon policies in these regions. Secondly, China’s energy structure is unreasonable: China’s energy structure is dominated by coal, and the burning of coal produces a large amount of greenhouse gases such as carbon dioxide, which makes China face a huge challenge in the low-carbon transition. Again China’s technological innovation is insufficient: China still has certain technical bottlenecks in low carbon technology, such as energy storage technology, clean energy technology, etc., which makes China face technical bottlenecks in low carbon transition. In addition, the policy system is not perfect: China’s low-carbon policies still have imperfect policy systems and insufficient policy implementation, which makes China face the problem of difficult policy implementation in the low-carbon transition. Finally, the overall social cognition is insufficient: China is facing the problem of insufficient social cognition in the low-carbon transition, which makes China face the problem of social resistance in the low-carbon transition.
Few studies have been conducted on whether government awareness and education efforts have contributed to a low-carbon lifestyle, and per capita energy use in China has been rising from the past to the present (Dong & Zhao, 2017). The government’s energy consumption per capita in China has been rising from the past to the present. One wonders how effective the many policy documents issued by the Chinese government over the past 20 years have been in guiding energy conservation in the residential sector. Have residents learned and developed low-carbon habits through government documents? What kind of heterogeneity does the population exhibit in receiving low-carbon education? Therefore, this paper proposes the hypothesis: “Are residents influenced by the government’s green will develop low-carbon lifestyles?” The paper aims to provide theoretical guidance for low-carbon advocacy efforts through quantitative and empirical studies of policy texts.
The Yangtze River Delta city cluster is one of the most economically active regions in China, with a high level of human capital and a keen sense of government policies. The Yangtze River Delta city cluster has been at the forefront of exploring low-carbon development approaches in China. Fifty-two enterprises, associations, and think tanks recently launched the Green Low Carbon Development Action Community in the Yangtze River Delta Ecological Green Integrated Development Demonstration Area in June 2021, which is dedicated to exploring a new pattern of multi-governance with the joint participation of government, enterprises, and social organizations. (Yangtze River Delta Establishes Green Low Carbon Development Action, 2021) Therefore, 26 cities in the Yangtze River Delta were selected as research subjects, which helps to clearly and explicitly explore whether the government’s green will have driven residents to form a low-carbon lifestyle.
Literature Review
Low-carbon development is the essence of sustainable development and an inevitable requirement for promoting the construction of ecological civilization. To achieve the dual-carbon goal, governments have introduced a series of low-carbon policies and carbon reduction methods in the hope of promoting low-carbon, green, and sustainable economic and social development. Can the government’s low-carbon policies promote the green development of the economy and the low-carbon life of the residents? How to evaluate the effect of low-carbon policies adopted by the government? Domestic and foreign scholars’ research around governmental low-carbon policies mainly focuses on two aspects.
Exploring the Impact of the Government’s Implementation of Green and Low-Carbon Policies
Green and low-carbon transition is an important step to achieve the goal of carbon neutrality, and the government’s policy regulation and policy arrangements play an important role in achieving the “double carbon” goal, building an environmentally friendly society, and achieving sustainable development. Zhong et al. (2018) used questionnaires to investigate the low-carbon behavior of enterprises and residents in Jiangsu Province and concluded that government policies and laws and regulations are conducive to the sustainable development of low-carbon economy in Jiangsu Province from the production and consumption sides. Building low-carbon pilot provinces and cities is one of the important initiatives in the construction of beautiful China, and is also a reflection of the Party’s will and determination in addressing global climate change, and Zhou et al. (2019) chose the propensity score model and conducted a study with the second batch of low-carbon pilot cities in China as the object. He argued that China should actively explore a new model for sustainable development of low-carbon cities while increasing the implementation of low-carbon policies.
The orderly promotion of governmental low-carbon policies will become a booster for regional development as well as the rise of enterprises: on the one hand, low-carbon policies will reduce the carbon emissions of cities and enhance the allocation of governmental attention to green ecology and institutional construction; on the other hand, enterprises will implement and implement low-carbon policies while their own technological innovation, transformation, and upgrading will transform and upgrade, and green-oriented adjustment of industrial structure will occur. X. Li et al. (2022) measured that the regional economic development effect of the Yangtze River Economic Belt is on an upward trend based on the five development concepts, and highlighted the coordinating role of the government in addressing individual regional development differences and promoting sustainable development. Z. Y. Zhao et al. (2019) critically analyzed various policies enacted by the Chinese government during the period 2010 to 2019 using a multidimensional framework, and the results showed that national policies have significantly increased their usefulness in guiding low-carbon development in cities. Pan et al. (2022) used the EB-DID methodology to assess the impact of Chinese LCCP projects on low-carbon innovation in Chinese prefecture-level cities. Huang et al. (2022) used a bibliometric approach and the study found that the ecological environment and low-carbon development are the focus of environmental policy concerns.
As low-carbon policies continue to advance, scholars have found that carbon emissions from residents account for a relatively large share of total carbon emissions (Jiang, 2016; Zeqiong et al., 2020), and the trend is still rising, between the key role of the government for the low-carbon cause, China’s government should play a leading role in low-carbon travel, low-carbon consumption and low-carbon life for residents, and deal with the relationship between low-carbon development sustainability and people’s need for a better life in an integrated manner. Doğan et al. (2021) studied 28 OECD countries from 1990 to 2014 and found that economic complexity and renewable energy may help mitigate environmental degradation in OECD countries based on econometric empirical analysis, enough to draw policy implications for sustainable growth and a green environment. Adedoyin et al. (2021) conducted a macro-regional analysis of the 26 EU member states using a systematic generalized method of moments and found that increased tourism, real GDP per capita, and energy use in the EU led to increased carbon emissions and that Brexit and the Greek bailout crisis increased and decreased carbon emissions, respectively, suggesting important policy directions for the EU-UK energy and environmental relationship post-Brexit. Caglar et al. (2022) explored the determinants of CO2 emissions in BRICS economies within a carbon income framework and found that positive changes in trade openness and economic complexity improve environmental quality. Bekun (2022) uses methods such as cointegration regression and Granger causality analysis to conclude that there is a causal relationship between renewable energy consumption and CO2 emissions, economic development, and energy investment and that renewable energy consumption and investment have far-reaching policy orientation toward the environmental sustainability goals of the Indian economy
Measurement of the Effect of the Government’s Implementation of Green Low-Carbon Policies
For the evaluation of governmental low-carbon policies, existing studies mainly adopt the carbon emission factor method of the international common law “IPCC Guidelines for Greenhouse Gas Emission Inventories” to account for the implementation effect, and use the carbon emission index to measure the low-carbon development level of different cities. Y. Zhang et al. (2012) combined the characteristics of urban residents’ energy consumption based on the above-mentioned method, categorized carbon emission sources specifically into transportation, heating, cooking, and household electrical appliances power consumption, and calculated the total emissions of each prefecture-level city in 2008 (Gao et al., 2013). Thereafter, scholars focused the estimation of carbon emissions on a certain high-energy-consuming industry (such as transportation, consumption, and electricity) based on the type of urban energy consumption, and explored ways to control carbon emissions from the industry in a targeted manner by analyzing the impact and extent of the main energy consumption links of urban residents on the urban atmosphere. Carbon emissions refer to the emission of greenhouse gases, the main greenhouse gas is carbon dioxide, and people’s clothing, food, housing, and transportation all produce carbon emissions, so some scholars measure carbon emissions through energy consumption (Auffhammer et al., 2017; Fare et al., 2007), and some scholars estimate the carbon emission intensity of multiple energy structures of urban transportation by setting the energy consumption intensity of various vehicles (H. Li et al., 2013; X. Zhang et al., 2014). Wu and Guo (2016) derived the evolutionary trend of urban carbon emission intensity through continuous dynamic distribution based on the panel data of 286 prefecture-level cities by summing up the carbon emissions generated by energy sources such as gas and LPG and transportation based on previous studies. Han and Xie (2017) refined the composition structure of carbon emissions and used the carbon dioxide emissions from natural gas, LPG, and electricity consumed by urban industries as a measure of urban carbon emissions.
The carbon emission coefficient method has a clear formula framework and requires relatively low data refinement, which helps to grasp carbon emissions and their change trends from a regional overall perspective. Therefore, this paper also adopts this estimation method, focusing on the main energy consumption aspects of urban residents’ life in China, to estimate carbon emissions of residents in prefecture-level cities, and on this basis, to analyze the influencing factors and optimize the model.
Based on the above literature, we can find that the research content of domestic and foreign scholars mainly focuses on the impact of governmental low-carbon policies on the macroeconomic level, and there is less research on the regional economy, city clusters, and individual residents at the meso level. Therefore, the marginal contributions of this paper are: first, selecting the Yangtze River Delta city cluster as the research object, breaking through the limitations of the spatial scope of previous literature studies; second, using natural language processing to conduct text mining, word separation processing, and word frequency statistics on the policy texts published on the official government websites of the Yangtze River Delta city cluster; third, deriving the five-dimensional indicators of the government green low-carbon policy index through the expert scoring method, and applying the entropy weighting method to Fourth, a static panel model and a dynamic panel model were constructed to investigate the relationship between residents’ low-carbon life index and government’s green intention.
Indicator Establishment
Government Green Will Indicators
This paper uses text analysis (C. Y. Zhao et al., 2021) and expert scoring method to construct the government green low carbon policy index. First, the Grw variables were constructed using text analysis. In the first step, we interviewed residents and government staff to select the keywords they considered most relevant to “green.” Then, we used Python software to collect relevant policies published by the governments of Yangtze River Delta cities using these keywords and converted them into text format. In the second step, the policy text of the selected sample was word-sorting and word frequency statistics were conducted to filter out the high-frequency words related to “green and low-carbon.” The keywords can be classified as green, low carbon, sustainable development, circular economy, and carbon neutral, which suggests that we can construct a green and low-carbon policy index from five dimensions (see Table 1). In the fourth step, based on the words formed in the third step, we extracted their preceding and following texts from the total policy texts and searched for the combinations of texts with high frequency. In the fifth step, the keywords are added to the existing literature to form the final subword dictionary. In the sixth step, based on the self-built subword dictionary, we use the Jieba function to subword all samples and count the occurrences of keywords from five aspects: green, low carbon, sustainable development, circular economy, and carbon neutral of carbon peak. On this basis, the word frequency data were standardized and the weights of each index were determined using the entropy value method to finally obtain the Grw index.
Government Green Willingness Indicators.

Calculation Results of Government Green Low-Carbon Policy Index
The measured results are plotted as a green low-carbon policy index map for 26 municipal governments in the Yangtze River Delta. In general, the green willingness index maps of the governments in the Yangtze River Delta show an upward trend from 2005 to 2020. Specifically, according to the slope of the green willingness curve, the upward trend can be divided into two categories: smooth upward and zigzag upward. A smooth rise means that the slope of the green willingness curve is close to a constant throughout the period, while a zigzag rise means that the slope of the green willingness curve changes significantly throughout the period and is more than close to a constant. The different curve patterns indicate that local governments have different understandings of green and low-carbon publicity and education efforts. The smoothly rising curve pattern indicates that the government’s understanding of green and low-carbon has always been relatively unified, and green and low-carbon policies have been continuously introduced to lead urban development, while the zigzagging curve pattern indicates that the government’s understanding of green and low-carbon has shifted significantly around the statistical period, as shown in Table 2.
Classification of Green Willingness Curve Patterns.

Shanghai, Zhejiang Province, and southern Jiangsu Province in the eastern part of the Yangtze River Delta city cluster are strategically located, with a large inflow of foreign talents, strong scientific and technological innovation, developed tertiary industries, few heavy polluting industries, good environmental protection, and high level of green development and green development speed, so the government green low-carbon policy index shows a steady growth trend, and the government attaches importance to green low-carbon development, as seen in Figures 1 & 2, for example, Shanghai, Suzhou, Hangzhou, Changzhou, and other cities belong to the above-mentioned areas. In 2014, the State Council clarified Anhui as part of the Yangtze River Delta city cluster, and Anhui’s economic development entered a new gearshift period and began to rely on the integrated development of the city cluster, and took over the industrial transfer of the central cities. In the short term, the industrial agglomeration made the economic benefits increase, but along with the industrial transfer produced a large amount of environmental pollution, and its economic over-dependence of economic development on resources leads to an ecological environment that cannot support the current development status, so the governmental green low-carbon policy index of Anhui Province has taken a significant bend, as seen in Figure 3. The governmental green low-carbon policy index started to decline in 2014 and then resumed a slow rise, for example, Hefei, Maanshan, Wuhu, Tongling, etc. are all part of Anhui Province.

Jiangsu Province.

Shanghai, Zhejiang Province.

Anhui Province.
Low-Carbon Lifestyle of Residents
Urban residents’ living carbon emissions mainly originate from their consumption of various types of energy, and if urban residents produce less living carbon emissions per unit of consumption expenditure, it means that their low-carbon living level is higher. Based on the availability of data, and referring to Ding et al. (2019). The carbon emissions of urban residents’ living are measured from three aspects, such as electricity, gas, and transportation, and the carbon emissions of urban residents’ living are obtained by summing up the carbon emissions of the above three categories. Based on this, the calculation method and related descriptions of each type of carbon emissions are shown in Table 3; Cao & Gao, 2021), the ratio of energy consumption and carbon emissions of urban residents to gross urban product, that is, the intensity of carbon emissions of urban residents, is used to construct a low-carbon living index for urban residents.
Construction of Residents’ Low-Carbon Living Index.

Calculation Results of the Low-Carbon Living Level of Residents in the Yangtze River Delta City Cluster
The low-carbon living index of residents in the Yangtze River Delta urban agglomeration generally shows a decreasing trend year by year, because the index is a negative indicator, thus reflecting the low-carbon living level of residents in the Yangtze River Delta urban agglomeration is increasing year by year and the trend of low-carbon living is further strengthened. However, the low-carbon living index of individual regions shows a V-shaped trend of decreasing and then increasing. For example, Suzhou City, Yancheng City, Zhenjiang City, etc. It can be found that the improvement of residents’ low-carbon living levels cannot be achieved overnight, and there is still much room for improvement in the future.
From Table 4, it can be found that the 26 regions, in general, can be divided into two categories, the first category is the low carbon living level index below 0.01, and the second category is the low carbon living level index above 0.01. There are 13 cities in the first category and 13 cities in the second category. Wuxi City has the smallest low carbon living index, which is 0.004349, that is, the residents of Wuxi City have the relatively highest low carbon living level. Zhoushan City has the largest low-carbon living index, which is 0.018132, that is, the residents of Zhoushan City have the relatively lowest low-carbon living level. The low-carbon living index of Zhoushan City is about four times the low-carbon living index of Wuxi City, so we can see that there is a large gap in the overall low-carbon living level of residents in the Yangtze River Delta region. In addition, we can also find from the table that economic growth is not linked to the low-carbon living index of the residents, among the first category of cities, there are cities with high GDPs such as Wuxi, Suzhou, Nantong, Changzhou, etc.; while the second category of cities also includes cities with high GDP such as Nanjing, Ningbo, Hangzhou, Shanghai, etc. Therefore, it shows that the change in the low-carbon living index of the residents does not necessarily depend on the economic growth of the cities, and reducing carbon emissions and maintaining economic development is not a single-choice question.
Calculation Results of the Low-Carbon Living Level of Residents in the Yangtze River Delta.

Figure 4 represents the composition of the average carbon emission values for the residents of 26 cities in the Yangtze River Delta. From Figure 4, we can find that the overall carbon emission values of the 26 cities in the Yangtze River Delta are increasing. Specifically, the carbon emission values generated by the residents’ use of electricity increased the most, followed by the carbon emission values generated by the use of transportation, while the carbon emission values generated by the residents’ use of gas decreased. The reason for this phenomenon may be due to the rapid economic development of the Yangtze River Delta, which has promoted the improvement of electric power facilities, and the residents have completed the conversion from fossil energy to electric energy in 15 years, such as using new energy vehicles, using home appliances for cooking and heating, etc. The increase in the value of carbon emissions from transportation is due to the rapid increase of people’s wealth in the Yangtze River Delta region during the 15 years, and everyone buys fuel vehicles to facilitate travel. Even though more new energy vehicles have been sold, the presence of fuel vehicles still causes the stock effect of transportation carbon emissions. In addition, observing the trend of the graphs, it can be found that the carbon emission values in 2009 and 2014 are lower than the previous and the latter year, which is related to the density of the economic growth trend in the Yangtze River Delta in these 2 years. Finally, it can be found that the growth rate of residential carbon emission values gradually decreases, and the total residential carbon emission values will gradually level off.

Composition of average carbon emission values of residents in the Yangtze River Delta.
Study Design
Variable Selection and Data Sources
Variable Selection
The measured low-carbon living index of residents is used as the explanatory variable, and the government’s willingness to go green is used as the core explanatory variable. Drawing on some scholars (Cao & Gao, 2021; Ding et al., 2019). The GDP per capita, the share of science and technology expenditure in GDP, and the household population at the end of the year are used as control variables, as shown in Table 5.
Descriptive Statistics of Variables.

The GDP per capita variable can indicate the growth rate of the economy, and residents are the direct beneficiaries of economic growth. According to the theory of the environmental Kuznets curve, as the economic growth reaches a certain level, both the government and the residents will pay more and more attention to green development, and the residents may pay more and more attention to the environmental policies introduced by the government, so GDP per capita is used as one of the control variables.
The share of science and technology expenditure in GDP reflects the importance of the local government to the degree of technology. If prefecture-level city governments increase investment in cleanliness in basic energy consumption industries such as power supply and heating and take the initiative to create conditions for residents’ low-carbon living patterns, they will prompt residents to take the initiative to reduce carbon emissions, which greatly reduces the level of carbon emissions in the city. On the contrary, prefecture-level cities that do not adopt technical support policies or have ineffective policies still have higher carbon emissions. This indicator reflects the effectiveness of local government environmental governance policies to a certain extent.
The year-end household population reflects the size of the local population. Cities with larger populations tend to be accompanied by higher levels of carbon emissions and higher threats to the urban and surrounding regional atmospheres. But cities with larger populations are also more conducive to reflecting the environmental scale effects of public goods, such as means of travel. Also due to the growth in population size, the price of enjoying green products such as green parks or wetlands will continue to rise, prompting residents to take the initiative to focus on low-carbon living.
Data Sources
Considering the availability of data, the period of this paper is from 2005 to 2020. The data were mainly obtained from the China Urban Statistical Yearbook, the Statistical Bulletin of National Economic and Social Development, the websites of local statistical bureaus, and other relevant websites in previous years, and linear interpolation was adopted for a small amount of missing data.
Model Setting
Base Model Setting
Based on the previous theoretical review of the low carbon living index of residents and the government’s willingness to go green, it is easy to find that there is a certain causal link between the two. Therefore, to investigate the form of the influence of the government’s green intention on the residents’ low carbon living index in the Yangtze River Delta, this paper will conduct further regression analysis by establishing a static panel model and a dynamic panel model based on the results of the quantitative measurement of the two. Panel data can control for the effects of heterogeneity and intra-individual characteristics. When panel data contain different individuals and units, these effects may have a significant impact on the results of the model. Panel models can control for the effects of these heterogeneities and intra-individual characteristics to better explain and predict real economic phenomena. Empirical studies using static panel models can control for the effects of heterogeneity and intrinsic characteristics of individuals, deal with the effects of time trends and seasonality, control for the effects of heteroskedasticity, deal with missing data and observation errors, and improve the accuracy of the model results. Compared with static panel models, dynamic panel models take into account the effect of time and can better deal with seasonal and cyclical changes in panel data and better reflect the dynamic nature of the data.
First set the model form as follows:

In the above equation, the
Considering that the explanatory variable resident low-carbon living index may have some inertia, and the lagged one-period government green willingness value may have some influence on the current period, to comprehensively and accurately examine the correlation problem between resident low-carbon living index and government green willingness, the first-order lagged terms of the explanatory variables and core explanatory variables are introduced as explanatory variables based on Equation 1 to construct a dynamic panel model:

Static Panel Model Form Selection
To choose a specific form of the model that makes the regression estimation more accurate (J. Li et al., 2010). First, the paper determines whether to use a fixed-effects model or a mixed-effects model. First, this paper determines whether the fixed-effects model or the mixed-effects model is used by the F-test in the fixed-effects model. Based on the results of the regression analysis (shown in Table 6), the original hypothesis is rejected and the fixed-effects model is considered to be better than the mixed-effects model.
Fixed Effect Model.

The original hypothesis of the LM test is that the former is more appropriate and the alternative hypothesis should be the latter, that is, the random effects model. The random effects model is a form of extension of the linear model, that is, the regression coefficients of the fixed effects model are regarded as random variables, which are generally assumed to be from a normal distribution, and the test results are shown in Table 6 below. After the LM test, it is concluded that the random effect effect effect is more significant, and it can be seen that the random effect model is more suitable than the mixed OLS regression model in both comparisons.
In empirical analysis papers, to determine the fitness of both the fixed effects model (fe) and the random effects model (re), the Hausman test is generally used. The principle of the Hausman test is: If the variable’s individual effects and other explanatory variables are not correlated, then consistent results can be obtained with both models, but the fitness of the random effects model is higher; if the variable’s individual effects and the explanatory variables are correlated, then the solid effects model can get consistent results at this time, but the estimation results of the random effects model are biased. Therefore, if the test original hypothesis holds, fe and re will converge toward the true parameter values; conversely, if the two are too far apart, the fixed-effects model will be chosen.
Empirical Analysis
Smoothness Test
From Table 7, it can be found that the Score variables did not pass the IPS test and HT test, and the household population variables did not pass the HT test. Therefore, first-order difference scores were taken for all variables. The p-values corresponding to all statistics in the first-order difference series are less than 1%, indicating that all variables are smooth after first-order difference, that is, each variable is a first-order single integer.
Stability Test.
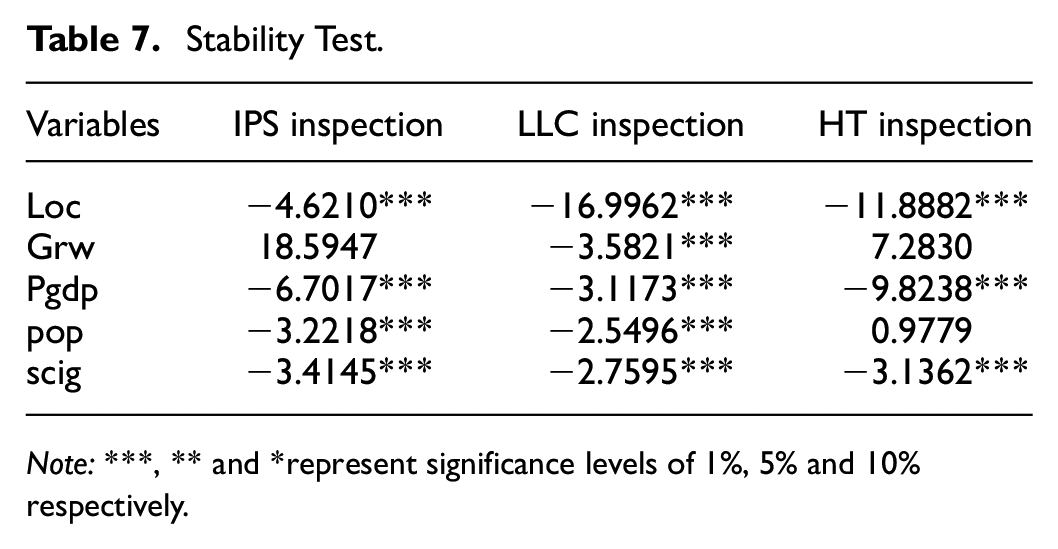
Note:***, ** and *represent significance levels of 1%, 5% and 10% respectively.
Therefore, the results of the cointegration test by the Kao test are shown in Table 8, and the p-value is less than 1%, which means that the original hypothesis of the Kao test “there is no cointegration” is rejected, that is, there is a stable long-run equilibrium relationship between the variables, that is, the variables in this paper can be estimated using the panel model.
Co-integration Test.

Baseline Regression Analysis
Column (1) of Table 9 represents the regression results of substituting the government’s green willingness with the resident’s green low-carbon lifestyle index into a fixed-effect static panel model. The results indicate that the government’s green will significantly contribute to the reduction of the resident’s low carbon living index, as the resident’s low carbon living index is a negative indicator, that is, it indicates that the government’s green will is conducive to the low carbon lifestyle of the residents.
Baseline Regression Analysis.

Note:***, ** and *represent significance levels of 1%, 5% and 10% respectively.
Column (2) of Table 9 shows the regression results of the fixed effects static panel model with all variables substituted. It can be found that there is indeed developmental inertia in the resident low-carbon living index, while government green intentions still significantly contribute to the decrease in the resident low-carbon living index. However, the one-period lagged government green intentions do not contribute to the reduction of the resident low-carbon living index, indicating that the resident behavior is mainly influenced by the current period. In addition, both GDP per capita and the number of household members at the end of the year inhibit the increase of residents’ low-carbon living index. The possible reason is that the increase in GDP per capita leads to an increase in residents’ wealth, and the residents start to realize the damage caused by economic development to the environment while increasing their wealth and reducing carbon emissions spontaneously. The expansion of the local household population has increased the local environmental carrying pressure, and residents have found that the price of ecological products has increased significantly in their daily lives, and residents have formed a low-carbon life both actively and forcibly. In addition, due to the increase in population, the provision of public goods such as travel tools achieves the scale effect to a certain extent, which reduces the carbon emissions of residents’ daily life. The variable of the share of science and technology expenditure in GDP shows a positive effect on the development of the low carbon living index of residents. The possible reason is that in the current situation, the expenditure on science and technology is mainly used for economic growth and not keenly aware of the environmental changes and not used to promote the residents to reduce carbon emissions.
Column (3) of Table 9 shows the regression results of the dynamic panel model estimated by substituting all variables using the two-step systematic GMM estimation method. Where AR (2) is equal to 0.771, indicating that there is no second-order serial correlation, which indicates that the dynamic panel model set in this paper is reasonable; the p-value from the Sargan test statistic is .295, indicating that the original hypothesis that the instrumental variables are valid cannot be rejected, that is, the instrumental variables selected in the estimation process are valid. It can be found that in the dynamic panel model, the inhibitory effect of the government’s willingness to go green on the residents’ low carbon living index is multiplied relative to the static panel model. In addition, other significant control variables are measured in the same way as in the static panel model, indicating the stability of the causal relationship between these variables.
Heterogeneity Analysis
To explore the influence of the government’s green will on residents’ low carbon living index under different circumstances, a heterogeneity analysis was done (Table 10), and both AR(2) and Hansen’s test passed, indicating that the model results are plausible. Considering the research findings of some scholars (Cao & Gao, 2021; Yuan, 2020), two classifications are established in this paper. One is the share of financial institutions’ year-end deposits in GDP, and the other is the difference between the ratio of the population with college (meaning college and above) education in 2010 and 2020. Column (1) of Table 10 shows the results of the dynamic model regressions in regions with low year-end deposits of financial institutions as a share of GDP. The results indicate that in such regions, the government’s green intentions do not serve to suppress the residents’ low-carbon living index. However, the direction of influence of GDP per capita and science and technology expenditure does not change. That is, in such regions, whether residents form a low-carbon life or not is more influenced by economic growth. Column (2) of Table 10 indicates the results of dynamic model regressions in regions with high year-end deposits of financial institutions as a share of GDP. The results indicate that in such regions, whether residents develop a low-carbon lifestyle is not influenced by the growth of GDP per capita, but by the government’s willingness to go green.
Heterogeneity Analysis.

Note:***, ** and *represent significance levels of 1%, 5% and 10% respectively.
Column (3) of Table 10 indicates the results of the dynamic model regressions for regions with a low difference in the percentage of the population with the university (meaning college and above) literacy in 2010 and 2020. The results show that in such areas, the government’s willingness to go green does not play a role in suppressing residents’ low-carbon living index. Column (4) of Table 10 shows the results of the dynamic model regression for regions with a high difference in the percentage of the population with university (tertiary and above) education in 2010 and 2020. The results indicate that the government’s willingness to go green in this region significantly contributes to the formation of low-carbon living (suppressing the resident’s low-carbon living index).
Heterogeneity analysis shows that areas with more affluent residents are more receptive to the government’s green will publicity. The difference between the percentage of the population with university (meaning college and above) education in 2010 and 2020 can roughly indicate the growth of human capital in the area. In areas with rapid human capital growth, residents are more likely to understand government policies and are more receptive to government publicity and education.
Robustness Analysis
To ensure the reliability of the regression results above, two approaches are taken to do the robustness analysis. Column (1) and (2) of Table 11 shows the robustness analysis using the dynamic panel model in the reduced time case. Column (3) and (4) of Table 11 shows the robustness analysis by transforming the estimated model. The specific regression procedure is similar to the above. From Table 11, it can be found that the main causal relationships are still significantly present. And the signs of the coefficients of each variable are the same as the regression results above. Therefore, the findings of this paper are robust and reliable.
Robustness Analysis.

Note:***, ** and *represent significance levels of 1%, 5% and 10% respectively.
Conclusions and Recommendations
Conclusion
This paper uses the data of 26 cities in the Yangtze River Delta from 2005 to 2020 as the research sample, and uses Python statistics of government websites to construct the government green willingness index; then constructs the residents’ low-carbon life index from three major aspects. Then the fixed-effects static panel model and the systematic GMM dynamic panel model are used to explore whether the government’s green willingness promotes the formation of residents’ low-carbon life (promotes the process of residents’ low-carbon life). The main findings are as follows:
(1) The green willingness index of 26 municipal governments in the Yangtze River Delta shows an upward trend, but there are two specific trends: a smooth upward form and a zigzag upward form. This indicates that there are individual differences in the degree of importance of green and low carbon among the 26 municipal governments in the Yangtze River Delta. The low-csarbon living index of the residents of the 26 Yangtze River Delta cities, in general, shows a decreasing trend year by year, reflecting that the low-carbon living level of the residents of the Yangtze River Delta city cluster is rising year by year and the trend of low-carbon living is further strengthened. However, the low-carbon living index of individual regions shows a V-shaped trend of decreasing and then increasing. The low-carbon living level of residents still has more room for improvement in the future. In addition, the development of low-carbon living in the Yangtze River Delta region is not balanced, and there are large gaps.
(2) Overall the government’s willingness to go green significantly inhibits the growth of residents’ low-carbon living index, that is, it promotes the development of low-carbon lifestyles. The growth of GDP per capita and population size also inhibits the growth of residents’ low-carbon lifestyle index, probably because the marginal utility of wealth decreases in the process of wealth growth, and people pay more and more attention to the ecological environment. The increase in population, on the other hand, increases the environmental carrying capacity, raises the price of ecological products, and residents reduce carbon emissions both actively and forcibly. Science and technology expenditures, on the other hand, promote residents’ carbon emissions because they are mainly applied to economic growth rather than economic development.
(3) Residents in more affluent areas are more receptive to the government’s green will publicity. The possible reason is that the higher the affluent region, the higher the residents’ attention to policies and the greater the marginal effect of ecological products. In regions with rapidly growing human capital, government green will significantly suppress residents’ low-carbon living index. It may be that in the process of growing human capital, the overall quality of residents increases, and they have a higher understanding of government policies and take the initiative to move closer to government policies.
Policy Recommendations
(1) Increase the government’s efforts to promote green and low-carbon education through local conditions. Low-carbon education is an important part of the national “double carbon target” plan, and through policy planning, it will penetrate the daily life of residents and systematically guide their energy-saving behavior in various aspects of daily life, such as purchase, use, disposal, etc. While paying attention to the number of policies issued, more attention is paid to the effectiveness of the content of the policy documents themselves. The effectiveness of the content of the documents themselves. In areas with high affluence, the government can use popular publicity methods, such as slogans and neighborhood carbon rankings; in areas with low affluence, the government can adopt specific economic incentives to encourage price-sensitive residents to take the initiative to save energy. The government can adopt specific economic incentive policies to encourage price-sensitive residents to take the initiative to save energy, make the “Two Mountain Theory” more popular, guide people to establish the concept of harmony between humans and nature, consciously practice the awareness of saving energy and resources, disseminate green low-carbon knowledge, coordinate online and offline resources, and widely carry out carbon peak and carbon neutral publicity and education activities to promote low-carbon living.
(2) Deepen education reform, absorb high-end talents, and promote science and technology innovation. Increase the investment in the education of residents and improve the comprehensive quality of residents. Green and low-carbon concepts and technological advances can be disseminated in schools as a priority, and influence parents through students. Practice green and low-carbon as an important part of educational activities, and take World Environment Day, World Earth Day, National Energy Conservation Publicity Week, National Urban Water Conservation Publicity Week, and other thematic publicity nodes as opportunities to popularize relevant knowledge and carry out thematic public welfare activities to students. Industry leaders should be free to schools and universities to open social practice classes. Higher education institutions should increase investment in green low-carbon scientific research and technology. Social development should not be “GDP-only,” but use science and technology expenditure to promote the transformation and upgrading of industrial structure, establish a sound green and low-carbon industrial system, and form a high-quality economic development model. By increasing the wealth of the population, the marginal utility of wealth is reduced and the demand for ecological products is increased.
(3) Promoting new urbanization and forming the scale effect of public products. Under the influence of historical problems and epidemics, economic development everywhere is severely challenged. Without the emergence of new economic development methods, it is likely to quench thirst and embark on sloppy, high-carbon economic growth again. New urbanization is a necessary step to stabilize economic development, concentrate population and stimulate residents’ consumption demand to promote economic growth, reduce the per capita cost of providing public goods and promote residents to reduce carbon emissions. Therefore, promoting new urbanization can help reduce residents’ carbon emissions and achieve the goal of “double carbon.” The new type of urbanization is promoted by increasing investment in urban infrastructure, improving public services such as transportation, water supply, power supply, and gas supply, and improving the living conditions of urban residents.
Discussion
Limitations of the Study
(1) The first limitation of this paper is the small coverage of the study area. The main reason is that the Yangtze River Delta urban agglomeration is one of the most affluent regions in China, where residents are well-educated and more responsive to policies. The findings in the paper suggest that there are significant differences in the degree of affluence of residents in response to policies. However, since the study area does not cover other urban agglomerations or regions, such as North America or Europe, etc., Phang et al. (2016) used the Philippines as the study area to educate students and teachers in 80 elementary schools on low carbon practices, the results showed that their low carbon practices increased by 8%, while teachers’ awareness increased by 5%, and the schools saved a total of 90,857 kWh of electricity and 767.85 m3 of water. And according to scholars such as Smulders (Smulders et al., 2012) The increasing intensity of environmental regulation is not conducive to carbon efficiency, as energy development is unlikely to be depleted on a large scale shortly. Therefore, applying the research framework of this thesis in other parts of the world may lead to other interesting conclusions.
(2) The second limitation of this paper is the short time frame of the study. China has been enacting environmental policies for many years. The main reason for choosing 2005 as the starting date for this paper is that the data is too old to be available on the Internet. The study cannot describe the specific performance of residents in the Yangtze River Delta urban agglomeration in the face of government environmental policies before 2005.
(3) The third limitation of this paper is that the construction of the “government’s willingness to go green” indicator is not comprehensive. This paper constructs the “government’s willingness to go green” indicator by analyzing the policy text, but this indicator does not fully reflect the government’s guiding behaviors for residents, such as promotional slogans, reduction of bus or subway fares, subsidies for new energy vehicles, and other environmental regulation measures.
Future Recommendations
(1) Expand the scope of the study area. The sensitivity of different regions to government policies varies, so more study areas can help reflect the response of global residents in the face of government low-carbon education campaigns.
(2) Increase the time interval of the study. By measures such as offline collection or specialized database queries, such as government policy databases or past paper newspapers, the data collection period is advanced to before 2005. The wealth level of Chinese residents was significantly lower before 2005 than it is now, and the government did not pay as much attention to environmental protection as it does now. Therefore the comprehensiveness in time may bring more interesting findings to the study.
(3) Reconstruct the “government’s willingness to go green” indicator. Expand the scope of the indicators and use various methods to collect data, including surveys and interviews. The “government’s willingness to go green” reflects the degree of importance the government attaches to environmental protection, and the effects of many related policies are difficult to quantify in textual terms. For example, during China’s “family planning policy,” slogans had a significant impact on residents’ reproductive choices, but this effect was not included in the quantitative analysis of the policy text. Therefore, this paper encourages other authors to adopt a more comprehensive data collection approach to construct “government green will” indicators.
Footnotes
Declaration of Conflicting Interests
The author(s) declared no potential conflicts of interest with respect to the research, authorship, and/or publication of this article.
Funding
The author(s) disclosed receipt of the following financial support for the research, authorship, and/or publication of this article: This research was supported by the National Social Science Fund of China under project number 21FJYB047, the Fundamental Research Funds for the Central Universities under project number B220207035? as well as supported by Project on Excellent Post-graduate Dissertation of Hohai University under project number 1063-422003495.
Data Availability Statement
Data sharing not applicable to this article as no datasets were generated or analyzed during the current study.