
Abstract
Green port construction has a profound impact on China’s international climate commitment to carbon neutrality by 2050. To examine the carbon emission reduction potential of 20 major ports in the Yangtze River Delta port cluster of China, this study takes the perspective of environmental efficiency and employs dynamic exogenous variable DEA in efficiency evaluation. The results show the increasing environmental efficiency of the ports in the Yangtze River Delta, rising from 0.5116 in 2013 to 0.7276 in 2019. Also, there are significant spatial differences in efficiency. After considering exogenous variable, the average efficiency has increased from 0.5537 to 0.6276, indicating that regional green development is a critical factor in port environmental efficiency evaluation. Finally, the overall efficiency of input and output have risen, the slackness of carbon emission shows a trend of decreasing, and there is great potential for reducing carbon emissions from the perspective of port environmental efficiency. The previous studies paid less attention to dynamic efficiency, exogenous variables, and carbon emission. Therefore, this paper is the first comprehensive examination on the carbon emission reduction potential of China’s Yangtze River Delta port cluster from the perspective of dynamic environmental efficiency.
Keywords
Introduction
As an essential gathering hub for national water, land transportation, and domestic and foreign trade, ports provide basic support for regional economic development and global resource allocation. However, the operation of the port mainly relies on the consumption of fossil energy, making it one of the significant sources of greenhouse gas emissions. Between 2012 and 2018, global maritime CO2 emissions increased from 0.962 billion tons to 1.056 billion tons, an increase of about 9.3%. The global share of emissions from the maritime sector increased from 2.76% to 2.89% (International Maritime Organization, 2020). China is the world’s largest source of carbon emissions (Ma et al., 2022; J. J. Wang et al., 2021), and the achievement of the global maritime emission reduction target will require China to make further progress in reducing greenhouse gas emissions from its ports. Therefore, considering green and sustainable development is the inevitable trend of port development (Hua et al., 2020), improving port environmental efficiency through effective resource allocation and carbon emission reduction has become an important breakthrough for improving China’s port competitiveness and green development (Kong & Liu, 2021).
The Yangtze River Delta is one of the most active and open regions in China’s economic development (X. Wang et al., 2022; Yuan et al., 2020). The Yangtze River Delta port cluster occupies a pivotal strategic position in China’s port layout. At present, the throughput of some ports in the Yangtze River Delta ranks among the top globally. However, it is not sustainable to rely on the disorderly expansion of port scale to maintain port development (C. Wang et al., 2021; Yang et al., 2020). As the port develops to a certain scale, the waste of port construction resources and pressure on energy conservation and emission reduction are inevitable (Ye et al., 2020). It’s urgent to promote the green and high-quality development of ports in the Yangtze River Delta. In this context, evaluating the dynamic environmental efficiency of the port clusters in the Yangtze River Delta of China from a low-carbon perspective holds great significance for the ports’ sustainable transformation, building a world-class port cluster with international competitiveness and supporting the high-quality development of the region.
In terms of port efficiency, scholars have conducted numerous related research. The most commonly used methods in research are Data Envelopment Analysis (DEA) (Ablanedo-Rosas & Ruiz-Torres, 2009; Andrade et al., 2019; Wu & Goh, 2010; Yuen et al., 2013) and Stochastic Frontier Method (SFA) (Nguyen et al., 2016; Suárez-Alemán et al., 2016), because DEA can handle multiple inputs and outputs without presetting functions and parameters to overcome subjective tendencies. However, the standard DEA assumes that all the evaluated objects are static and cannot evaluate the dynamic changes of efficiency. In addition, the traditional DEA model cannot consider the adverse effects of undesired outputs, resulting in an overestimation of the efficiency value. The dynamic exogenous variable DEA model that considers undesired outputs can make up for the shortcomings of the standard DEA method (Y. N. Sun et al., 2021). Also, there is a lack of research on carbon emission reduction potential from the perspective of environmental efficiency. Based on these, this paper considers carbon dioxide emissions and introduces the exogenous variable of energy consumption per unit of GDP representing the level of regional green development, and constructs a dynamic exogenous variable DEA model to evaluate the environmental efficiency of ports in the Yangtze River Delta from 2013 to 2019 and measure the ports’ carbon emission reduction potential based on the efficiency evaluation results.
The contributions of this study are as follows: (1) Focus on port efficiency in the process of energy saving and emission reduction, introduce exogenous variable, and consider undesired output to provide a new perspective for port environmental efficiency evaluation. Use the dynamic DEA model, which is more suitable for the current situation of port operation, to evaluate the port environmental efficiency. (2) Calculate input and output efficiency, analyze the specific reasons for the low environmental efficiency of different ports, and propose targeted improvement measures. (3) Measure the carbon emission reduction potential of ports from the perspective of environmental efficiency and provide a certain reference for the green development of ports.
The rest of this article is organized as follows. Section 2 reviews the relevant literature. Section 3 introduces the research methods. Section 4 conducts empirical research and analysis, and Section 5 gives conclusions.
Literature Review
Port Efficiency
Port efficiency represents the effective degree of port resource allocation, and is one of the quantitative indicators to measure the competitiveness of ports. It not only has a profound impact on international trade (Mustafa et al., 2021) but is also an important management indicator for port operators. Therefore, many academic research on port efficiency has been conducted.
Early research on port efficiency evaluation mainly used parameterized methods such as index analysis method (Bichou & Gray, 2004; Tongzon, 1995), multiple regression analysis (Clark et al., 2004; G. W. Wang et al., 2013), stochastic frontier model (Sohn & Jung, 2009), etc. to evaluate port performance. With the development of research, non-parametric methods represented by DEA and its extended models have been widely used to measure port efficiency due to the advantages of not needing to determine the functional form in advance and having higher objectivity. Roll and Hayuth (1993) first applied the DEA method to measure the efficiency of incoming ports. L. C. Lin and Tseng (2007) used various DEA models to estimate the operating efficiency of major container ports in the Asia-Pacific region, and studied the breakthroughs in efficiency improvement. Wanke (2013) adopted a two-stage network DEA approach to study the efficiency values of Brazilian ports at different stages and their respective driving factors. Gil Ropero et al. (2019) also chose to use the DEA bootstrap-based approach to measure port efficiency, taking Spanish and Portuguese ports as research objects, and affirmed the robustness and accuracy of this method.
In recent years, environmental pollution caused by ports has become increasingly serious (Liao et al., 2010). Some researchers have begun to pay attention to the environmental performance of ports, and research on the formation mechanism and construction strategies of low-carbon ports has gradually begun (J. Li et al., 2011; Barnes-Dabban et al., 2017; Gonzalez Aregall et al., 2018; Lee et al., 2014). Chin and Low (2010) used CCR, BCC, and slack-based measure (SBM) model to measure the global efficiency, local efficiency, and environmental efficiency of 13 major East Asian ports, and compared the efficiency results with and without considering the negative externalities of NOx, SO2, and CO2 emissions. Y.-T. Chang (2013) also analyzed the environmental efficiency of Korean ports based on the SBM model, using carbon dioxide emissions as undesired output. The results of the study showed that the economic efficiency of South Korean ports was low, but the environmental efficiency was relatively high. Q. Liu and Hoon Lim (2017) used data envelopment analysis to study the environmental efficiency of 20 ports in the United States. G. Dong et al. (2019) developed an improved, inseparable SBM model to evaluate the environmental performance and operational efficiency of 10 major container ports along the Maritime Silk Road. The choice of poor output was carbon dioxide emissions. The results showed that the environmental efficiency of the sample ports was not as good as the operational efficiency. Castellano et al. (2020) adopted the CCR model to measure the environmental efficiency of Italian ports. The selected environmental pollution index was the Environmental Quality Index, including PM10, NH3, nitrogen dioxide, benzene, and sulfur dioxide. Specific to the relevant academic achievements with Chinese ports as the research object, studies generally believe that the environmental efficiency of Chinese ports is low, and the green development of ports is at an underdeveloped stage. Na et al. (2017) constructed an inseparable input-output SBM model to estimate the environmental efficiency with CO2 as the undesirable output of eight container ports in China. J. Sun et al. (2017) regarded nitrogen oxides as a poor output of research, adopting CCR model and DDF model to evaluate and analyze the efficiency of China’s listed port companies. Y. Li et al. (2020) also focused on Chinese port enterprises’ CO2 emission performance and introduced a modified DDF to compare the performance of the ports’ carbon emissions.
Carbon Emission Reduction Potential
At present, many different methods have been applied to the reduction potential of greenhouse gases such as carbon dioxide. For example, the Logarithmic Mean Division Index can evaluate the impact factors of greenhouse gas emissions and measure the emission reduction potential based on the decomposition of the impact factors (J. Dong et al., 2022; Fu et al., 2021; W. Wang et al., 2022). Scenario simulation hypothesis method is another common method to study emission reduction potential (Lou et al., 2022; Shang et al., 2020). Although these methods have certain advantages in assessing the carbon dioxide emission reduction potential, there is also a shortcoming that cannot measure the carbon emission reduction potential under the condition of reaching the production frontier (Xiao et al., 2021). DEA method can measure the potential of emission reduction by calculating the slackness of undesirable output to study the distance between DMUs to the forefront of production technology. Therefore, it is widely used in the research of waste emission reduction potential (An et al., 2022; B. Lin & Sai, 2022; J. Sun et al., 2019; Zhang et al., 2016). Chen et al. (2021) established an Inverse DEA model to evaluate China’s CO2 emissions reduction by comparing the actual value and projecting value. G. Dong et al. (2018) employed nonseparable undesirable output SBM-DEA model to reveal the GHG emissions of crop production and determine the reduction potential of them. However, in the existing literature on the potential of carbon emission reduction through DEA model, the static efficiency measurement method is mainly used, ignoring the impact of time factors in the process of port operation. Therefore, we choose the dynamic DEA model to measure the port carbon emission reduction potential from the perspective of environmental efficiency.
In summary, according to the current research progress, scholars have conducted beneficial exploration on port efficiency, port environmental efficiency, and carbon emission reduction potential. However, the current research still has shortcomings: Firstly, the existing research is mainly based on static measurement, while insufficient attention has been paid to dynamic efficiency evaluation. Secondly, most scholars didn’t consider the impact of exogenous variables on the model. Thirdly, the Yangtze River Delta port cluster is one of the most important port clusters in China. There is a lack of research on carbon emission reduction from the perspective of environmental efficiency of this specific region. Based on these, we take energy consumption per unit of GDP as an exogenous variable. Upon considering the undesirable output of carbon dioxide emission, a dynamic exogenous variable DEA model is constructed to evaluate the environmental efficiency of ports in the Yangtze River Delta. Measure port’s carbon emission reduction potential based on the efficiency, hoping to provide a reference for the high-quality green transformation of ports in the Yangtze River Delta.
Methods and Model
The Dynamic DEA Model
DEA is a linear programing model, a decision-making unit (DMU) based on the Pareto optimal solution, whose function is to analyze the relative efficiency relationship between the DMUs. The original DEA-CCR model was proposed by Charnes et al. (1978), which measured the performance of multiple inputs and outputs with constant returns to scale (CRS). On this basis, Banker et al. (1984) changed the assumption of constant returns to scale into variable returns to scale (VRS), and proposed the DEA-BCC model. Since CCR and BCC are radial efficiency measurement methods, they don’t consider the variable slack. When the variables have non-zero slack, the efficiency will be overestimated. For this reason, Tone (2001) proposed a slacks-based measurement (SBM), as a non-radial efficiency measurement method that took into account the slack between input and output.
However, traditional DEA models mainly focus on static measurement and lack estimation and analysis of different periods. Therefore, Klopp (1985) proposed a window analysis method, which first been used for dynamic analysis. Subsequently, Färe et al. (1994) combined the DEA with the Malmquist index to make it suitable for dynamic efficiency measurement in various fields. However, these methods don’t involve the impact of carry-over activities in different periods. To consider the relationship between the intermediate production variables in the periods, Färe and Grosskopf (1996) developed a non-parametric productivity measurement standard that explicitly inputs the influence of internal connections into the dynamic DEA (D-DEA). Tone and Tsutsui (2010) then extended the model to dynamic analysis with a slackness-based measure and proposed a dynamic SBM (D-SBM) that added intermediate variables as dynamic periodic links. This study is based on the non-directional SBM D-DEA method to evaluate overall efficiency (OE) and term efficiency (TE). There are independent inputs and outputs in each DMU in each period, and there is a carry-over link from period t to period t + 1 to find the changes between the two periods. What’s more, this study considers the undesirable output based on the D-SBM model to measure the environmental efficiency of the port.
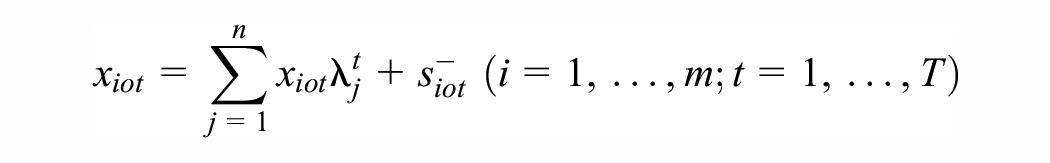
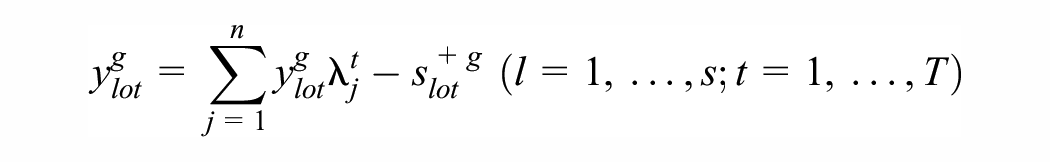
Assumption the observations make up a j (j = 1,…,o,..,n) dimension DMU set in which the DMU under evaluation is represented by DMUj in T period. Each reference DMUo evaluated has m inputs xiot (i = 1,…,m), s desirable outputs yglot (l = 1,…,s), k undesirable outputs ybvot (v = 1,…,k), n carry-over variables zinputrot (r = 1,…,n), which is from period t to period t + 1. eaot (a = 1,…,u) is an exogenous variable that is outside of a given model. wt (t = 1,…,3…) is the weight to period t. s− is slack variable and s+ is surplus variable. Undesirable output slack refers to the output redundancy to achieve the optimal production target, which is the carbon emission reduction potential of the port in this paper. In addition, an exogenous variable e that impacts on the model results but is outside the model was introduced. Therefore, the reference DMUo overall efficiency

Equation 1 is the connection equation between t and t + 1.


Among them, the most effective solution is:

Input and Output Efficiency
This study follow Hu and Wang (2006) total factor energy efficiency index to overcome any possible bias in the efficiency indicator. According to the efficiency result, the efficiency value of each input and output item can be calculated. The calculation method is as follows:

If the target investment is equal to the actual investment, the efficiency of the input item is 1, indicating that the investment is effective. If the target investment is less than the actual investment, the efficiency of the input item is less than 1, meaning that the input is inefficient. If the target desirable output is equal to the actual desirable output, the desirable output item efficiency is 1, which means the desirable output is effective. If the target ideal output is greater than the actual ideal output, the efficiency of the desirable output item is less than 1, indicating that the desirable output is inefficient. Similarly, if the target undesirable output is equal to the actual undesirable output, the efficiency of the undesirable output term is 1, indicating that the undesirable output is effective. If the target undesirable output is less than the actual undesirable output, the efficiency of the undesirable output is less than 1, indicating that the undesired output is inefficient.
Empirical Results
Data and Variables
This study uses panel data from 20 major ports in Jiangsu Province, Shanghai, Anhui Province, and Zhejiang Province in the Yangtze River Delta to measure port environmental efficiency from 2013 to 2019. The sample ports include Suzhou, Nantong, Zhenjiang, Nanjing, Lianyungang, Jiangyin, Taizhou-J (Jiangsu), Changzhou, Yangzhou, Shanghai, Wuhu, Anqing, Maanshan, Tongling, Chizhou, Ningbo-Zhoushan, Wenzhou, Taizhou-Z (Zhejiang), Hangzhou and Huzhou. The specific geographic locations of ports are shown in Figure 1. The data involved in the research mainly come from the China Statistical Yearbook, China Transport Yearbook, China Port Yearbook, statistical yearbooks of cities in the Yangtze River Delta, and statistical bulletins of national economic and social development of cities. Since China hasn’t published statistical information on port CO2, we adopt the method provided in the “Technical Guidelines for the Compilation of Non-road Mobile Source Air Pollutant Emissions Inventory (Trial)” issued by the Ministry of Ecology and Environment in August 2014 to calculate. The carbon emission factor in the calculation formula refers to the data published in the “IPCC Carbon Emission Calculation Guide (2006).”

Geographic location of ports in the Yangtze River Delta.
The selection of input and output indicators should follow the basic principles of science, logic, and accessibility and should reflect the ports’ operating process as much as possible. Port operations aim to minimize input and maximize output (Cullinane et al., 2006). Table 1 is a summary of the input and output variables used in the existing port efficiency study. Almost all the studies in the table take the berth length as the input variable, while other studies use the number of berths, wharf area, and labor. The infrastructure investment necessary for port operations is relatively large (Wu & Goh, 2010).
Input and Output Variables Used in Previous Studies.

The number of berths and the length of piers are often used as infrastructure variables to measure the production and operation capacity of ports and reflect inputs (Song & Liu, 2020). Unlike other studies, this paper focuses on the Yangtze River Delta port cluster, which is more detailed in port selection, covering some small-scale ports. Therefore, considering the difficulty of data collection, pier length (PL) and the number of berths (NB) are selected in this study to reflect the port input.
When evaluating the output performance, most scholars use container throughput or cargo throughput as output variables, which are widely accepted as the most suitable and easy to analyze port indicators. Since the throughput capacity of the port is the basic material guarantee for the efficient production of the port (M. Wang et al., 2023), cargo throughput (CT) and container throughput (C) are selected as desirable output variables. To evaluate the ports’ environmental performance, previous studies usually selected various types of waste gas closely related to port operations as bad output. In view of the research theme of the carbon emission reduction potential of the Yangtze River Delta port cluster, this study selects CO2 emissions as the undesirable output. At the same time, the number of berths representing fixed asset investment is selected as the carry-over variable, and the energy consumption per unit of GDP in the hinterland representing the level of regional green development is selected as the exogenous variable. The descriptive statistics of each variable are shown in Table 2.
Descriptive Statistics of Variables.

Figure 2 illustrates the changes in various input-output indicators. From 2013 to 2019, the maximum values of cargo throughput, container throughput, and carbon emissions are increasing, and the average values of variables are also increasing. This indicates that while the ports have developed vigorously in recent years, the green construction is particularly urgent. Actively promoting the application of new technologies, facilities, and equipment for energy conservation, emission reduction, and controlling the port’s pollution discharge is the top priority for port operations. The maximum pier length fluctuated during the sample period, and the maximum number of berths fluctuated during the 8 years. This reflects the efforts of each port to build berths and piers according to actual needs, and adjust infrastructure investment to avoid redundant investment and waste of resources. The maximum, minimum, and average values of regional unit GDP energy consumption showed a significant downward trend from 2013 to 2019. This means that the regional green development work has achieved remarkable results, indicating that the region pays more attention to the relationship between economic development and environmental protection. The six selected indicators have a certain degree of standard deviation, indicating significant development differences within the ports of the Yangtze River Delta.
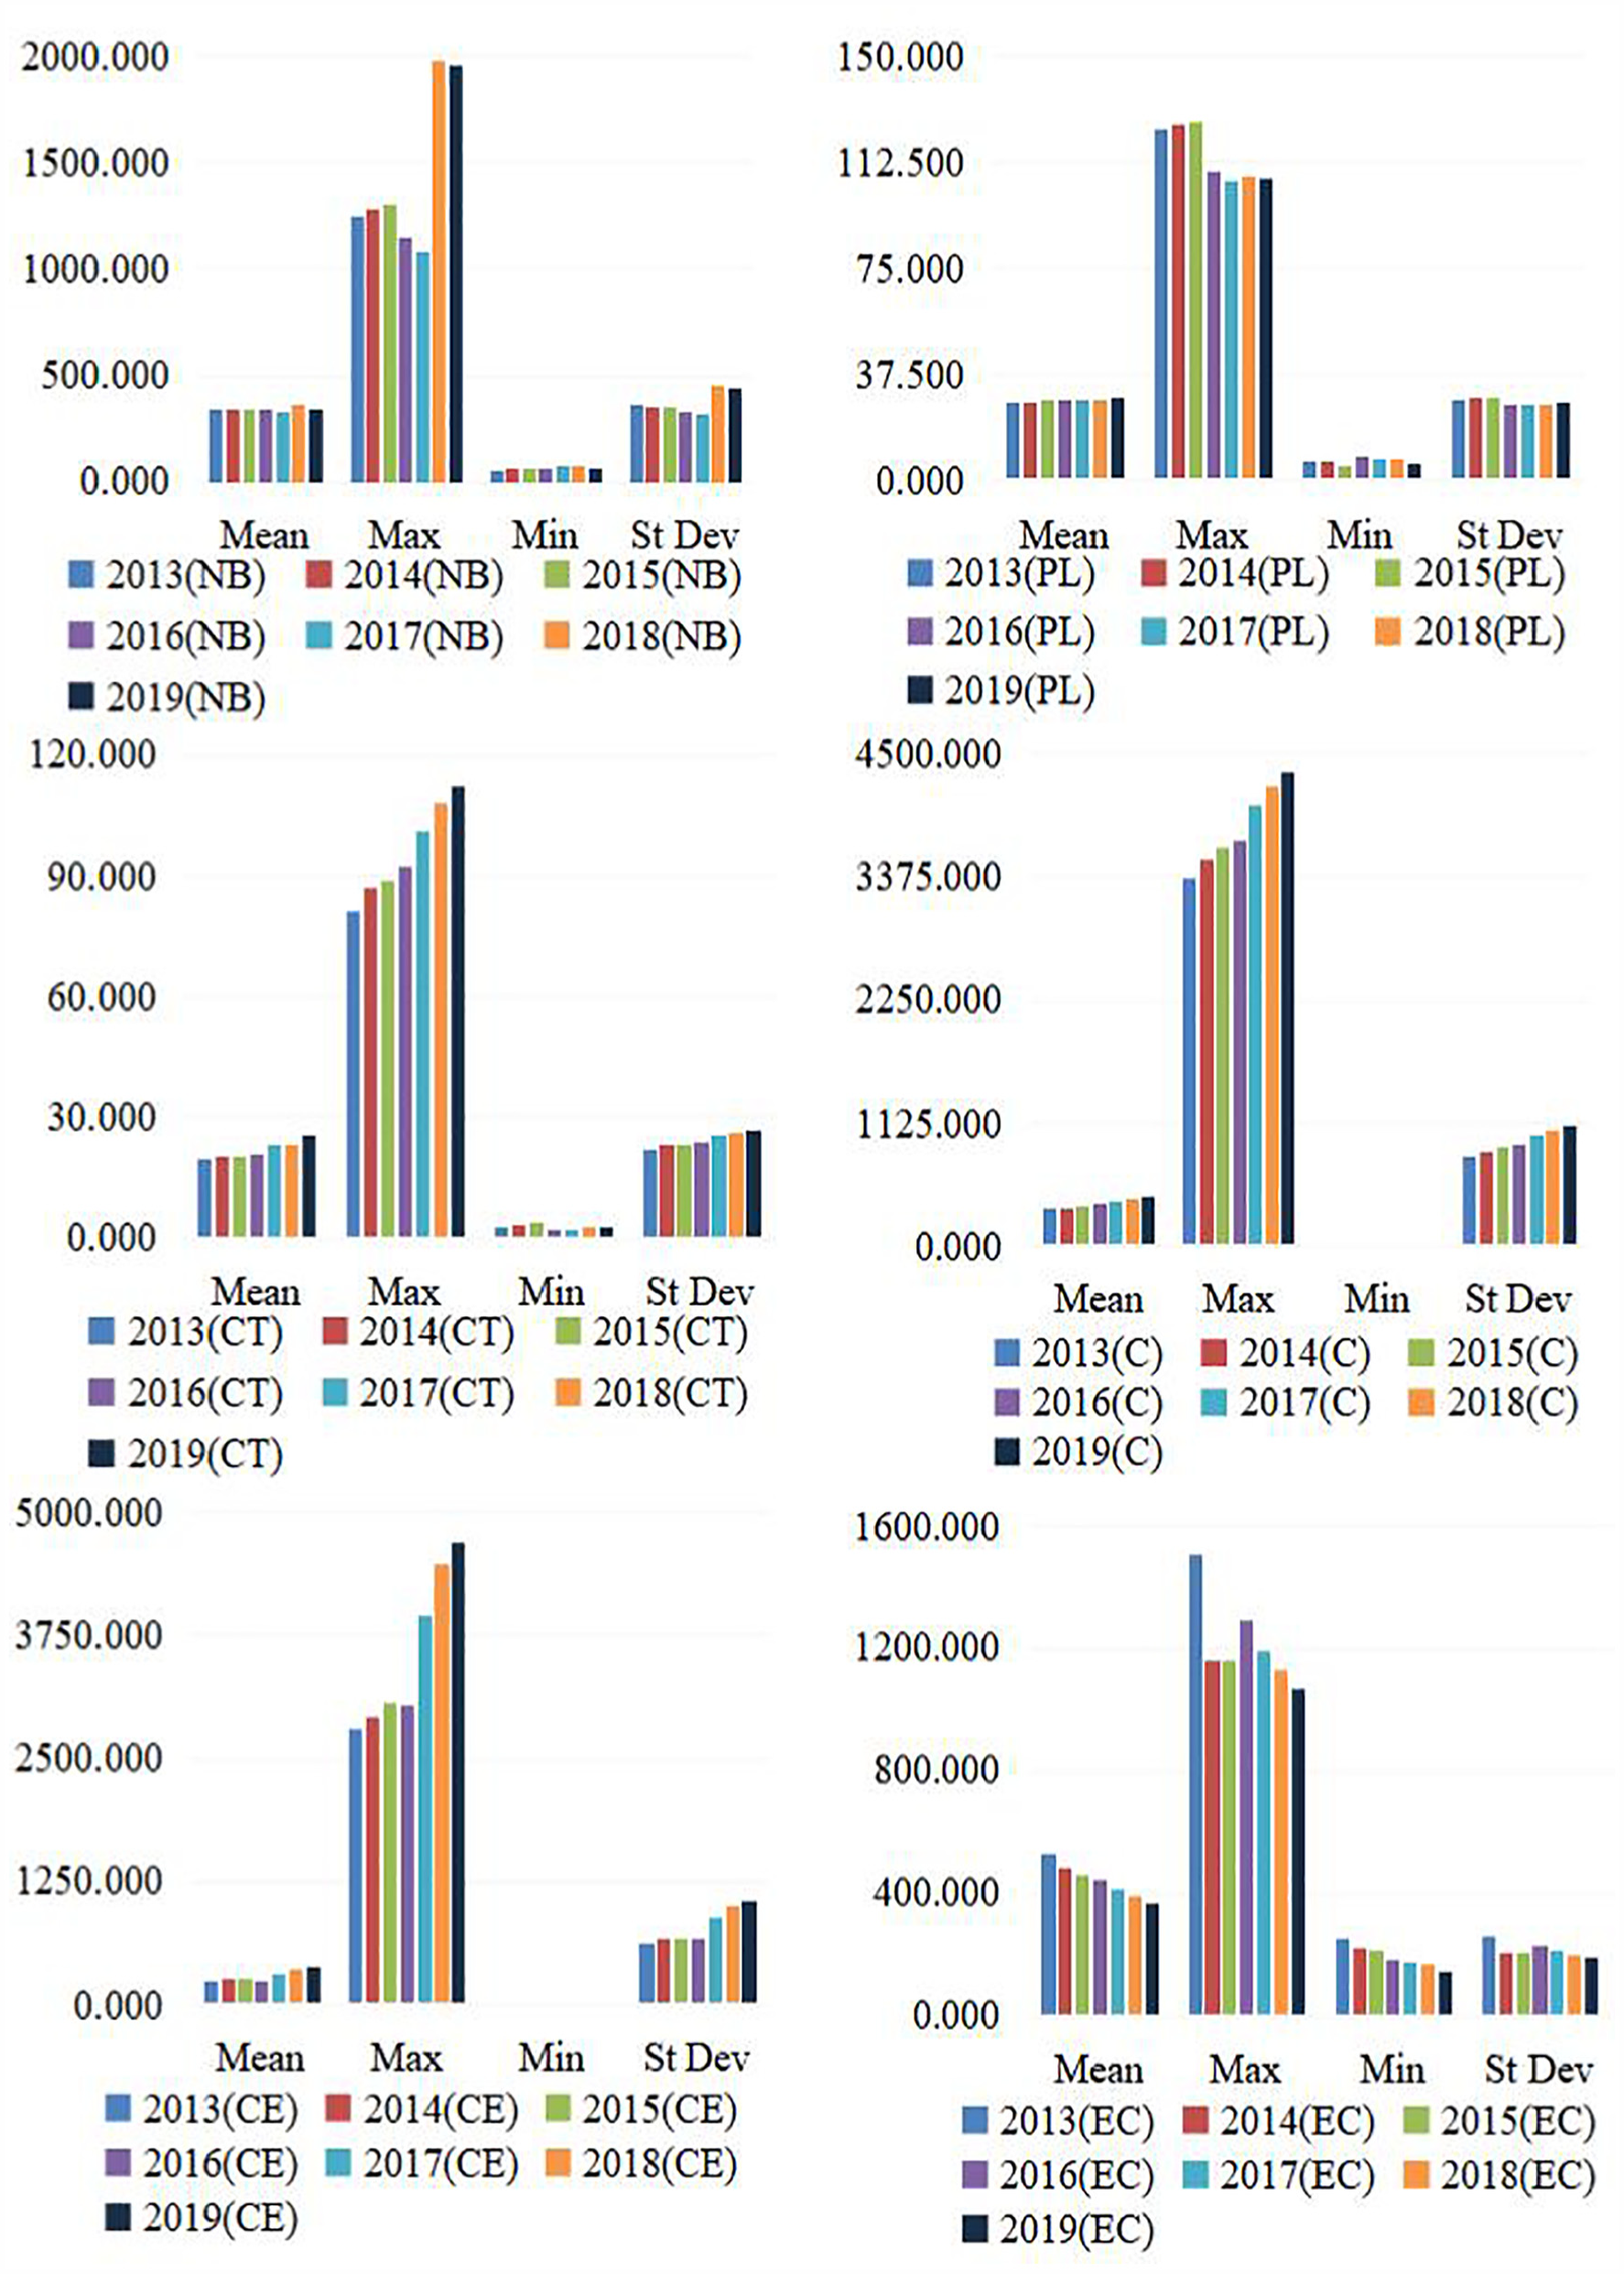
Input-output variables of ports in the Yangtze River Delta from 2013 to 2019.
Comparative Study on Overall Environmental Efficiency of Ports
Based on the input-output data of 20 ports in the Yangtze River Delta from 2013 to 2019, the port environmental efficiency scores are calculated: (1) without considering exogenous variable and the port environmental efficiency score (2) considering exogenous variable. Figure 3 shows the changes in the average environmental efficiency of the ports from 2013 to 2019 before and after considering exogenous variable. The results and rankings of the environmental efficiency score (1) and efficiency score (2) of the ports are shown in Tables 3 and 4, respectively.
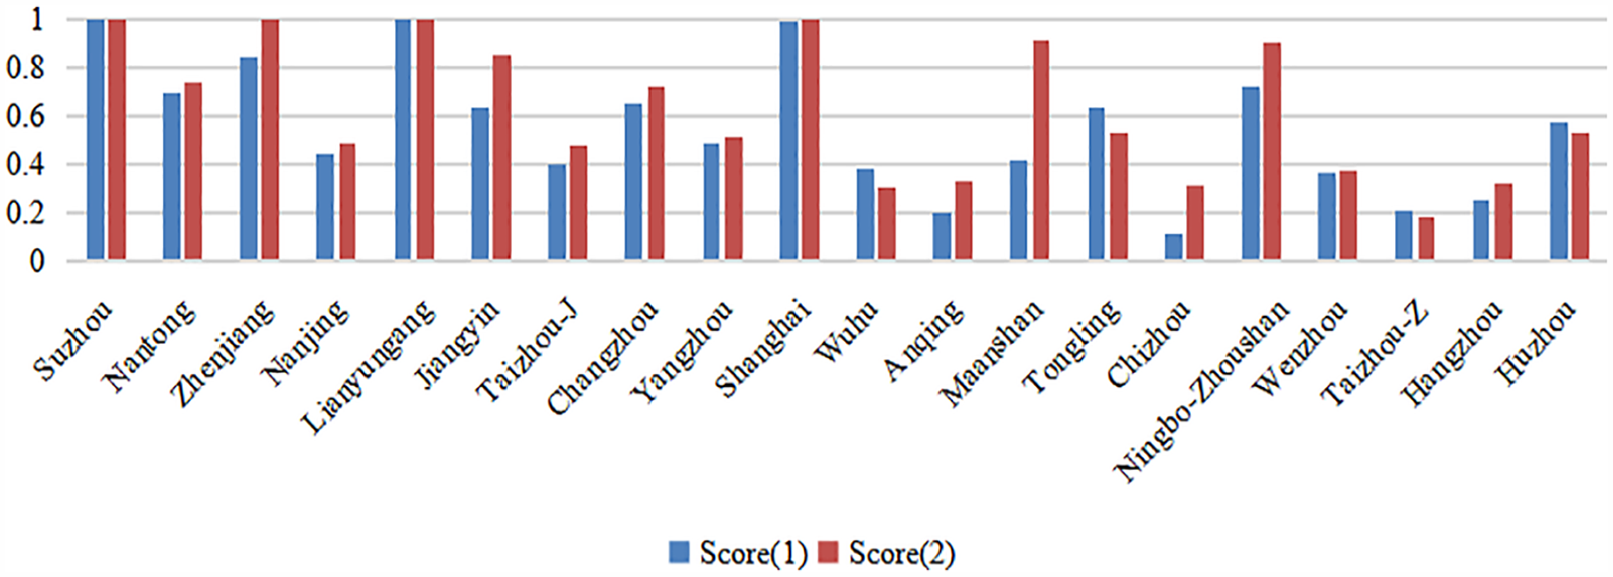
Average scores of port environmental efficiency in the Yangtze River Delta.
Comparison of Environmental Efficiency of Ports in the Yangtze River Delta From 2013 to 2019.

Comparison of Environmental Efficiency Rankings of Ports in the Yangtze River Delta From 2013 to 2019.

According to Figure 3, except for Wuhu and Tongling in Anhui, as well as Taizhou-Z and Huzhou in Zhejiang, most ports have higher overall efficiency scores than ports not affected by the level of green development. Among ports with improved efficiency scores, Zhenjiang and Jiangyin in Jiangsu, Maanshan, Anqing, Chizhou in Anhui, and Ningbo-Zhoushan in Zhejiang have the highest efficiency growth rates. Figure 4 shows the changing trend of environmental efficiency of the port cluster in the Yangtze River Delta from 2013 to 2019. As can be seen from the figure, taking into account the energy consumption per unit of GDP in the hinterland as an exogenous variable, the efficiency of most ports has been improved to varying degrees. The level of regional green development is an essential factor in the overall environmental efficiency evaluation of the ports in the Yangtze River Delta. With the reduction of energy consumption intensity in the hinterland, the level of regional green development has been improved, significantly promoting the progress of port environmental efficiency.

Environmental efficiency of ports in the Yangtze River Delta in 2013 to 2019.
The measurement results show that regardless of whether the impact of exogenous variable is considered, the environmental efficiency of ports in the Yangtze River Delta shows a fluctuating growth trend from 2013 to 2019. However, there are significant differences in the internal efficiency of the port clusters, indicating that the unbalanced development of the ports is prominent.
According to the data in Table 3, when not considering the green development level of the port hinterland, the ports of Jiangsu and Shanghai, as a whole, perform best in the port cluster. The average efficiency of ports in Jiangsu increased from 0.6003 in 2013 to 0.8199 in 2019. Suzhou and Lianyungang have an efficiency value of 1 for 7 years, indicating that these two ports have significant advantages in resource allocation, port management, and energy-saving and emission reduction efficiency. Nantong, Zhenjiang, Jiangyin, and Shanghai have all achieved environmentally efficient status in 2019. The average efficiency level is low among the 10 ports in Anhui and Zhejiang, except for Ningbo-Zhoushan. In these two provinces, the proportion of low-efficiency ports, including Chizhou, Taizhou-Z, Anqing, Wuhu and Wenzhou, is relatively high. In 2019, the average efficiency of ports in Anhui and Zhejiang was only 0.4648 and 0.5557, indicating great potential for improvement in environmental efficiency.
After considering the impact of exogenous variables, the environmental efficiency of Suzhou from 2013 to 2019 is still at the effective level of DEA. In addition, Zhenjiang, Lianyungang, and Shanghai have also been at the forefront of efficiency in the past 7 years. In comparison, the efficiency of Anhui and Zhejiang has improved to a certain extent, from the average efficiency values of 0.3517 and 0.4280 to 0.4821 and 0.4662, respectively. Maanshan and Ningbo-Zhoushan Port have made significant progress because their efficiency values have reached 1 from 2014 to 2019. However, the environmental efficiency of ports in these two provinces still lags behind Jiangsu and Shanghai, which have average efficiencies of 0.7569 and 1. In other words, they are the weak link in improving the environmental efficiency of the port cluster in the Yangtze River Delta, and they have the most significant room for improvement. In 2019, 9 ports, including Suzhou, Nantong, Zhenjiang, Lianyungang, Jiangyin, Shanghai, Maanshan, Tongling, and Ningbo-Zhoushan were at the frontier level, accounting for 45% of the total sample. The number of ports with effective DEA shows a fluctuating growth trend, but the proportion is still less than half. It shows that as strategic resource, the ports in the Yangtze River Delta have overlapped hinterland and vicious competition, which are not conducive to the full flow of market elements, resulting in overcapacity and low efficiency in some ports. Furthermore, ports are large CO2 emitters, and CO2 account for a relatively large portion of the undesired output of port environmental efficiency, which is one of the important factors restricting the improvement of efficiency. The efficiency of inland river ports such as Nanjing, Huzhou, and Chizhou is generally lower than 0.5, far behind other ports in the same region that are effective. These ports lag behind other ports due to geographical location conditions and construction scale. Apart from these, the relatively extensive production and operation methods have led to a relatively large amount of carbon emissions, which has restricted the green and sustainable development of the port to a certain extent. Suzhou is an inland river port, but its efficiency value is significantly higher than other inland river ports, indicating that its hinterland has good economic development, complete infrastructure construction, and advanced port technology. As a green and low-carbon demonstration port area approved by the Ministry of Transport of China, Suzhou has a relatively complete green construction system that integrates energy management and environmental management.
According to the comparison of port ranking in Table 4, we can find that Wuhu, Chizhou, Anqing, Wenzhou, Taizhou-Z, and Hangzhou rank at the bottom of the Yangtze River Delta ports in terms of efficiency before and after considering exogenous variable, while Suzhou and Lianyungang are the opposite, always taking the first place. After adding the exogenous variable, Zhenjiang and Shanghai have also achieved the first place in efficiency for 7 consecutive years. Their average efficiency rankings rose by three and two places respectively. The average efficiency rankings of Nantong, Nanjing, Yangzhou, Tongling, Ningbo-Zhoushan, Taizhou-Z, and Huzhou showed a slight decline of one or two. However, these ports have different performances in the direction of ranking changes in different years. After considering the exogenous variable, the ranking of these ports has risen in some years, while the ranking in other years has fallen. However, Wuhu’s efficiency has fallen the most, with the average ranking regressed from 15th to 19th, and every year the efficiency after considering exogenous effect has dropped. After adding exogenous influence, on the contrary, the port with the largest increase is Maanshan, which has progressed from 13th to 5th with the ranking improved by eight places. Anqing in the same province has also been promoted by three ranks.
Efficiency Scores of Input and Desirable Output Variables
Tables 5 and 6 list the efficiency scores of pier length, number of berths, cargo throughput, and container throughput of the ports from 2013 to 2019 after adding the influence of exogenous variable. It’s not difficult to see that different ports’ input and desirable output efficiency scores are quite different. Suzhou, Zhenjiang, Lianyungang, Shanghai, Maanshan, and Ningbo-Zhoushan have relatively reasonable factor allocation. Nantong, Jiangyin, and Tongling have shown effective investment in some years, and their resource allocation layout is comparatively good, but there is still room for improvement. Overall, the input efficiency of the ports in the Yangtze River Delta has increased significantly, and the pattern has been optimized. But there are also some ports with poor efficiency scores. Among the poorly performing ports, the ports with efficiency scores below 0.7 for the two input variables include Nanjing, Changzhou, Yangzhou, Wuhu, and four other ports in Zhejiang, except for Ningbo-Zhoushan. Moreover, the performance of these ports in terms of the number of berths is worse than the length of the pier. The minimum efficiency of the number and length of berths both appeared in Hangzhou. Although the data showed a steady upward trend during the sample period, the average efficiency was only 0.1312 and 0.4051. Similarly, Changzhou’s input efficiency is also at a downstream level. The average efficiencies of the two input variables are 0.2992 and 0.1739, respectively, demonstrating the urgency of rational planning of resources. It shows that the number of berths and pier lengths in these ports doesn’t match the actual demand, especially the number of berths, the redundancy of investment, the severe waste, and the low utilization of resources. It’s necessary to further rationally plan the input of resources and optimize the input structure to promote port transformation and upgrading.
Efficiency Scores for Pier Length and the Number of Berths From 2013 to 2019.
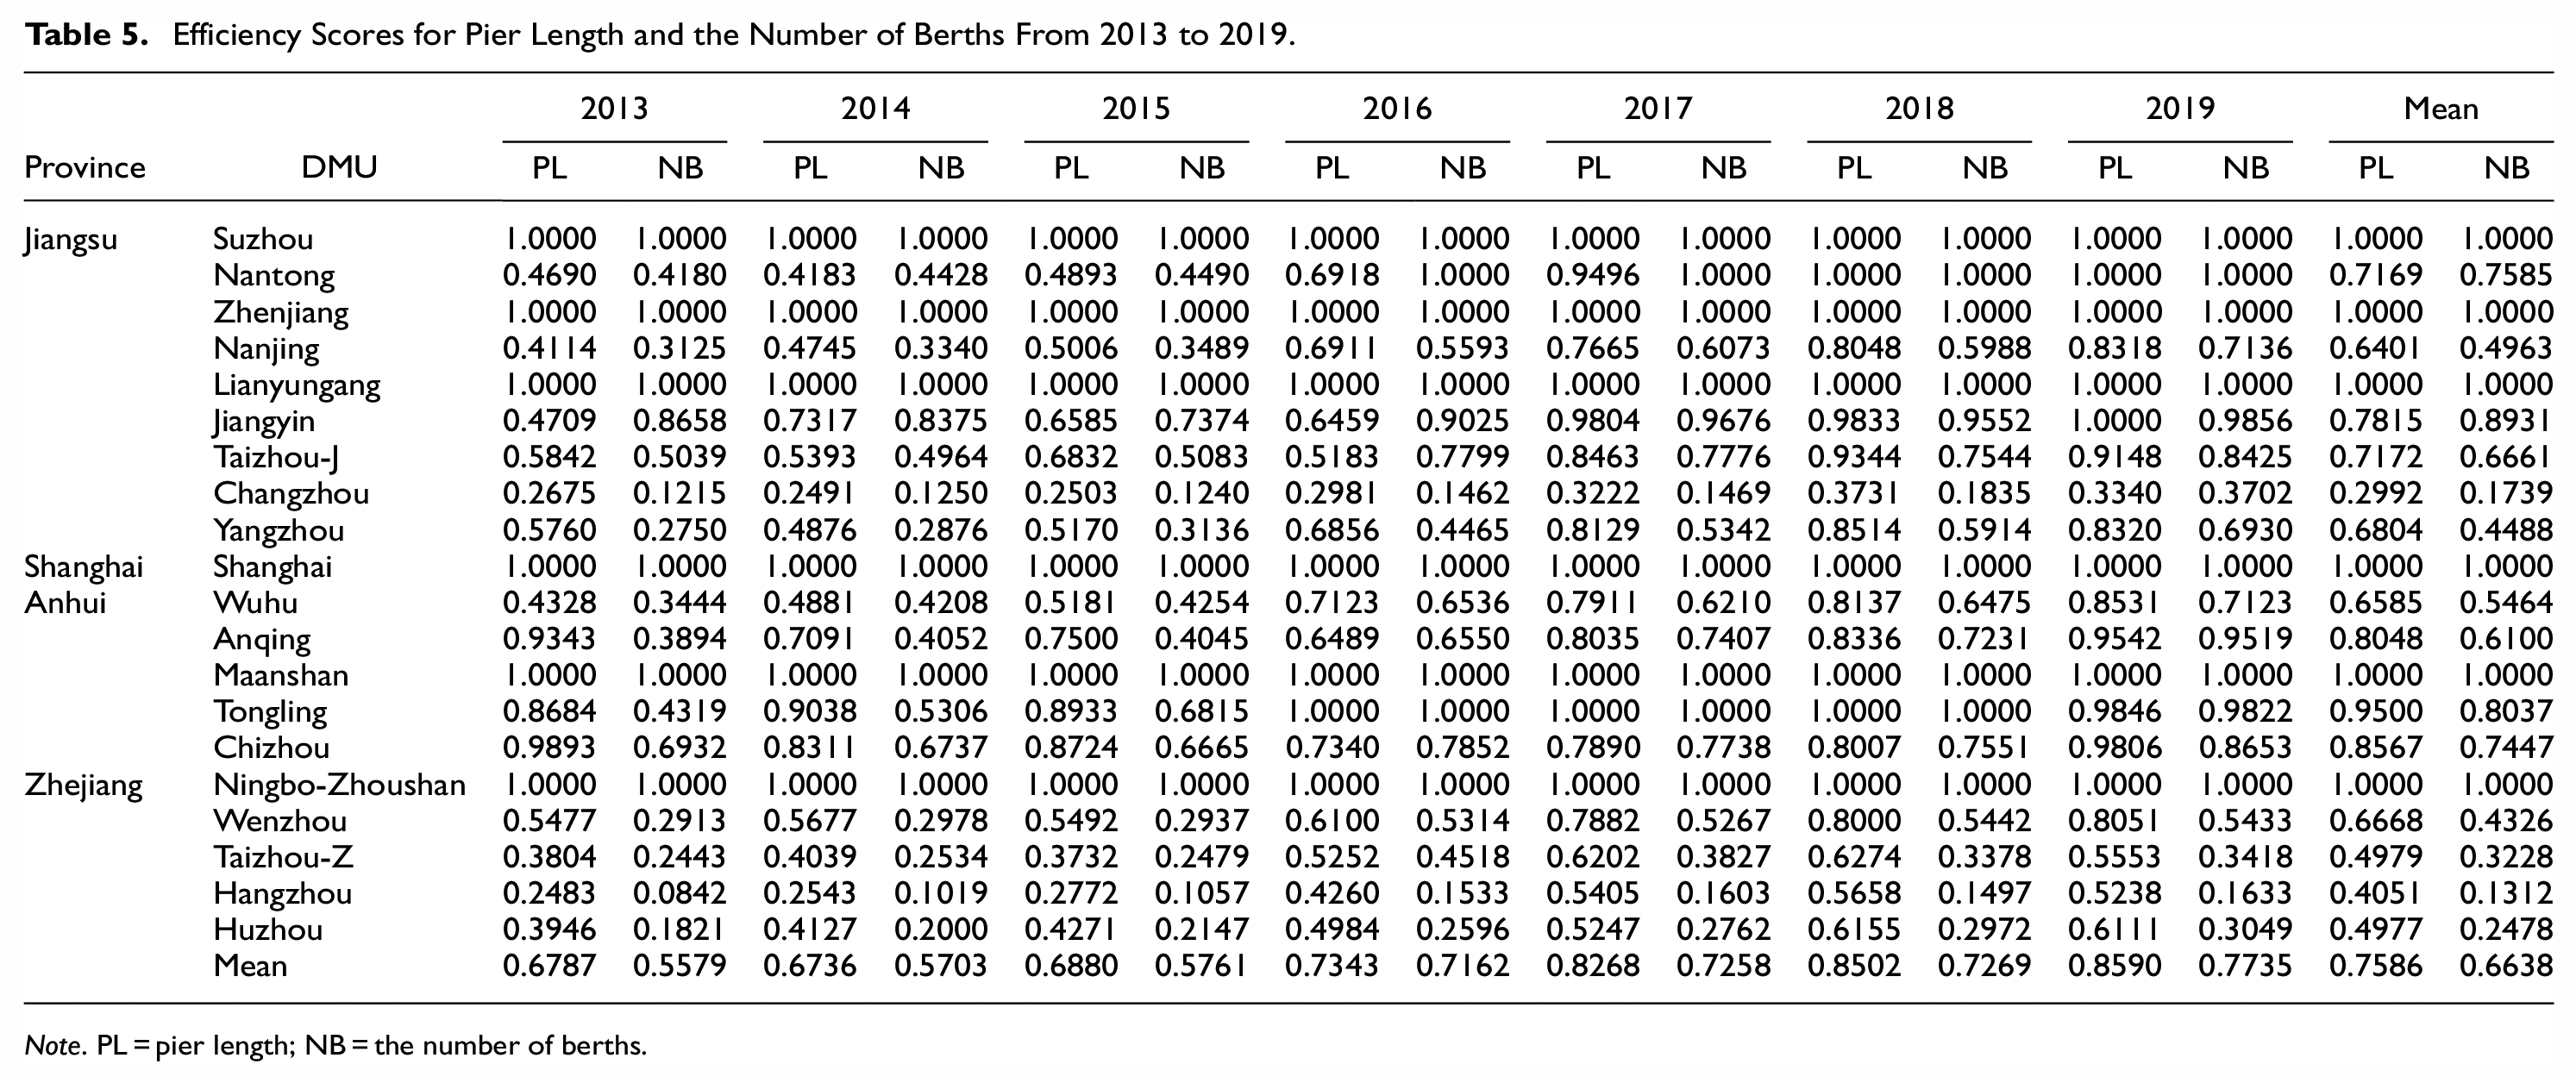
Note. PL = pier length; NB = the number of berths.
Efficiency Scores for Cargo Throughput and Container Throughput From 2013 to 2019.

Note. CT = cargo throughput; C = container throughput.
In terms of the efficiency scores of the desirable output of cargo throughput and container throughput, the performance gap of different ports is even more significant. Unlike input efficiency which has shown a certain upward trend in 7 years, output efficiency has shown unstable and large fluctuations. The two outputs of Suzhou, Zhenjiang, Lianyungang, Shanghai, Maanshan, and Ningbo-Zhoushan reached the effective DEA level during the period. Nantong, Jiangyin, and Tongling also showed high efficiency. Specific to the two output items, the performance of cargo throughput is significantly better than container throughput. Except for the small inland ports such as Anqing, Chizhou, Wenzhou, and Taizhou-Z, the cargo throughput efficiency of the ports is all higher than 0.6, and the efficiency of the ports in Jiangsu is even higher than 0.7. However, the number of ports with average container throughput lowers than 0.6 is as high as 13, accounting for 65% of the overall sample. The lowest container throughput efficiency appears in Hangzhou Port in 2013, even as low as 0.0023. However, the port of Hangzhou has developed rapidly in recent years and its efficiency has increased significantly. Despite this, the overall situation is still relatively backward and needs to be further improved. While Chizhou has the lowest average container throughput efficiency in the past 7 years, only 0.0237, this is the most important obstacle to the environmental efficiency of the port. Therefore, the ports of the Yangtze River Delta can enhance the container transportation capacity by strengthening the infrastructure construction of container yards and container terminals to support the green development of the port. At the same time, the port’s carbon emissions will be reduced through in-depth optimization of the energy structure, innovation in low-carbon management methods, and innovation in environmental governance models, thereby improving port environmental efficiency.
Analysis of Port’s Carbon Emission Reduction Potential From the Perspective of Environmental Efficiency
From the perspective of carbon dioxide emissions, an undesired output factor, calculate the carbon emission efficiency of each port in the Yangtze River Delta and the specific amount of carbon emissions needed to be reduced to achieve their environmental efficiency targets, that is, the carbon emission reduction potential of the Yangtze River Delta port cluster from the perspective of environmental efficiency. The calculation results are shown in Table 7.
The Carbon Emission Efficiency and Carbon Emission Reduction Potential of the Ports.

Note. E = carbon emission efficiency; P = carbon emission reduction potential.
Based on the empirical results, we can see that the slackness of the carbon emission indicators of the ports in the Yangtze River Delta from 2013 to 2019 shows a trend of volatility and reduction, indicating that the port has achieved remarkable results in energy conservation and emission reduction. The construction of green and low-carbon ports in the Yangtze River Delta port cluster has achieved certain results. But on the whole, there is still great potential for reducing carbon dioxide emissions in ports. In 2019, the slackness of the overall port carbon emission variables in the Yangtze River Delta was as high as 329.9092. Nanjing, Taizhou-J, Yangzhou, Wuhu, Wenzhou, Taizhou, and Huzhou have the most important emission reduction tasks to achieve the efficient output. It shows that although the unit energy consumption of the ports in the Yangtze River Delta is decreasing with the increase in scale and specialization of production, there is still a large room for energy conservation and emission reduction. Relying on technological progress and technological innovation, comprehensively enhancing the awareness of energy conservation and emission reduction of port employees, etc., transforming the port economic development mode, developing port circular economy, and promoting port energy conservation and emission reduction are important ways to effectively improve the environmental efficiency of ports in the Yangtze River Delta.
Conclusions and Policy Recommendations
Conclusions
Port carbon emissions have increasingly become public concern due to their significant impacts on climate change and the environment (Bouman et al., 2017). In the existing research on port environmental efficiency, the research object selected by scholars is relatively independent, so it is difficult to study the efficiency from the perspective of port clusters (M. Wang et al., 2023). This study employs the dynamic exogenous variable DEA to estimate the environmental efficiency of the Yangtze River Delta ports from 2013 to 2019, revealing the dynamic trend and overall characteristics of the efficiency, and is one of the few literature that study port environmental efficiency from the perspective of port cluster. On this basis, the carbon emission reduction potential of the ports is measured from the perspective of environmental efficiency. The conclusions are as follows:
First, without considering exogenous variable, the results show that the environmental efficiency of the Yangtze River Delta port cluster fluctuated upward from 2013 to 2019, with the ports in Jiangsu and Shanghai getting outstanding efficiency scores, and the internal development of the port cluster showed unbalanced characteristics. Therefore, in order to improve the port environmental efficiency and realize the green and low-carbon transformation of port cluster, more attention should be paid to the problems of input congestion, waste of resources, and high energy consumption, which is consistent with earlier literature (Na et al., 2017; Y. Li et al., 2020; J. Sun et al., 2017). Second, considering exogenous variable, the results further show that taking into account the energy consumption per unit of GDP in the hinterland of exogenous variables, the environmental efficiency of the port cluster in the Yangtze River Delta has been improved as a whole, and the level of regional green development is an essential factor in the evaluation of environmental efficiency. In addition, the efficiency of berth number is lower than that of the length and the cargo throughput is significantly better than container throughput. Inland river ports’ output inefficiency is the most important factor causing the poor environmental efficiency. Therefore, the optimization of berth number and the improvement of inland river ports’ cargo and container throughput are the key links to achieve breakthroughs in the environmental efficiency of the Yangtze River Delta port group in the future. Finally, in terms of carbon reduction potential measurement, the overall efficiency of undesirable output has risen, and the slackness of carbon emission shows a trend of decreasing, which indicates that significant results have been achieved in the emission-reduction work of the port cluster. But some inland river ports still have greater room for improvement in the construction of green and low-carbon ports.
Policy Recommendations
Based on the above, the following policy recommendations are put forward: First, reduce port input redundancy and rationally plan resource utilization. Strengthen the overall planning and construction of the port cluster in the Yangtze River Delta, optimize the proportion of input and the utilization of the factors to further integrate the resources and industries, and increase the utilization rate of them. Second, strengthen the positive interaction between ports and promote the coordinated development of the port system. Give full play to the radiating and leading role of high-efficiency ports such as Shanghai to drive the upgrading of surrounding ports. Take advantage of the coastal advantages of Zhejiang to cultivate comprehensive foreign trade ports. Jiangsu and Anhui should make use of the domestic market and speed up the construction of inland waterways. Third, improve the port technical equipment, management mechanism, and the port technology level. Build deep-water berths and roadways to improve transportation capacity and loading and unloading efficiency. Construct information infrastructure covering the whole process of port operation, management, and service. Finally, promote the green transformation of ports and accelerate the construction of low-carbon, environmentally-friendly, and sustainable ports. To reduce carbon emissions, port managers and governments should attach great importance to energy-saving and emission reduction work and promote port oil-to-gas, oil-to-electricity, and ship-shore power supply.
Discussion
Existing studies mainly focus on independent ports, and little on the environmental performance of port cluster. In this paper, the DEA method is used to evaluate the port’s carbon emission reduction potential from the perspective of environmental efficiency. It puts exogenous variable, dynamic efficiency, and carbon emission under the same analytical framework, which can provide experience reference for the low-carbon construction of world port clusters. Dowd and Leschine (1990) believed that labor, capital, and land are basic input elements, which can ensure long-term development of ports. Castellano et al. (2020) and Kuang et al. (2023) selected these three usual input elements to research the status of ports. However, considering the availability of data, we chose the number of berths and the length of the terminal as alternative variables, which may make the evaluation index system less comprehensive. In addition, the impact of location factors, resource endowments, industrial structure, and other environmental factors on efficiency is not considered (J. Liu et al., 2021; Chang et al., 2019). Further research on port environmental efficiency can more comprehensively consider external environmental factors and reduce the impact of environmental factors and random interference.
Footnotes
Declaration of Conflicting Interests
The author(s) declared no potential conflicts of interest with respect to the research, authorship, and/or publication of this article.
Funding
The author(s) disclosed receipt of the following financial support for the research, authorship, and/or publication of this article: This study was supported by Major Project of Philosophy and Social Sciences in Colleges and Universities in Jiangsu Province (No. 2021SJZDA120), the Fundamental Research Funds for the Central Universities (Nos. B220207020, B220203043), and the National Natural Science Foundation of China (No. 42001250).
Data Availability Statement
Data sharing not applicable to this article as no datasets were generated or analyzed during the current study.