
Abstract
High-tech small and medium-sized enterprises (high-tech SMEs) play a driving role in the economic transformation of the China Yangtze River Delta. However, comparatively little research and attention has been paid to evaluating the financing efficiency and investigating both external and internal influencing factors on financing efficiency based on the information of these enterprises. This study evaluates the financing efficiencies in a homogeneous environment of high-tech SMEs of information technology industry in the China Yangtze River Delta for the period 2014 to 2020 employing the panel three-stage Data Envelopment Analysis model. We have concluded that the financing technical efficiency presents a U-shaped trend from 2014 to 2020, at a moderate level due to the low pure technical efficiency; financing efficiency shows different spatial distribution patterns; most decision-making units are in the quasi-relatively inefficient range, while only a minority are at the efficiency frontier. Furthermore, the external and internal environmental factors are investigated based on Panel Stochastic Frontier Analysis and Tobit model. According to the empirical results, the optimization of the financial and technical environment contributes to financing efficiency; by contrast, a good economic and policy environment appears to restrict it; internal environmental factors such as growth ability, debt solvency, and the average age of managers have significant impacts on financing efficiency.
Keywords
Introduction
High-tech SMEs (high-tech small and medium-sized enterprises) refer to small and medium-sized enterprises engaged in R&D, production and service of high-tech products. In the context of the implementation of China’s innovation-driven development strategy and “mass entrepreneurship and innovation” policy, high-tech SMEs have gradually played a driving role in China’s economic transformation. The Yangtze River Delta, where more than 60,000 enterprises have been included in the high-tech SMEs pool in 2020, is a region with the fastest development speed and the biggest scale of China’s high-tech SMEs. Financing has proved to have a positive influence on the sustainability, innovative performance, labor productivity level, and growth opportunity for SMEs (Ayalew et al., 2020; Eldridge et al., 2021; Motta, 2020; Ullah et al., 2021). There are, however, some financing problems among high-tech SMEs, which restrict their rapid development and demand prompt solutions. On the one hand, with such characteristics as large-scale and long-term R&D investment, high risk, and unsustainability, high-tech SMEs are faced with the unavailability of access to financing and the high cost of financing. On the other hand, most high-tech SMEs are incapable of using financing efficiently on account of the low-level management which could cause decision-making errors (J. Yang & Yang, 2021). How to solve the financing problems has thereby become the key to the healthy development of high-tech SMEs.
The financing of SMEs has been widely concerned by academia at a global level. Scholars have done a lot of research on the availability of access to financing. Motta and Sharma (2020) found that the presence of information asymmetries between borrowers and lenders limits credit application approval. Z. X. Wang et al. (2022) pointed out that the reduction of information asymmetry can further alleviate the financing constraints on SMEs. Galli et al. (2020) investigated the influence of gender discrimination on the loan application, and found that gender discrimination does not emerge during the loan application. The financing behavior of SMEs is closely related to the external environment. Xia et al. (2019) revealed that a good financial ecological environment including the financial environment, the economic environment, the government environment, and the credit environment can ease the financing dilemma of SMEs. Some scholars have also confirmed the importance of the financial environment in easing financing constraints (Khurana et al., 2020; Lin et al., 2020). In addition to the external factors mentioned above, the institutional environment and political environment, as well as the legal environment have also proved to be significant factors influencing the financing behavior of enterprises (Beck et al., 2011; Cam & Ozer, 2021; Chundakkadan & Sasidharan, 2022; Gungoraydinoglu et al., 2017). Some scholars focused on the enterprise’s internal environment over and above the external environment. Sun et al (2021) indicated that younger, smaller and more innovative SMEs are more likely to be rejected in the credit application. Ryou and Kim (2006) found that the return on asset, cash flow and credit rating are critical internal environmental factors of external financing. Olawale and Smit (2010) investigated the influence of managerial competencies, collateral, networking, and business information of new SMEs on the availability of debt. Moreover, some scholars provided the impacts of the duration of SMEs’ banking relationship and the number of banks they work with on financing constraints (Madrid-Guijarro et al., 2016).
Financing efficiency represents an enterprise’s ability to raise funds at the lowest cost within a certain risk (i.e. financing transaction efficiency) and to efficiently use the funds to obtain the maximum profit (i.e. financing allocation efficiency) (Xie & Ma, 2016). Strictly speaking, the availability of access to financing mentioned above reflects only one side of financing efficiency. A multitude of Chinese studies but few western studies have attempted to investigate financing efficiency because the financing of enterprises is often efficient due to the mature property system in western countries. The earliest Chinese researcher on financing efficiency was K. L. Zeng (1993), who proposed the concept when studied the issue of direct financing and indirect financing. Extensive research on the financing efficiency of enterprises in different industries and different regions in China has been carried out. As the government attaches more importance to high-tech SMEs, more and more scholars have begun to research the financing efficiency of high-tech SMEs based on Data Envelopment Analysis (DEA), a model widely used in the quantitative evaluation of financing efficiency, and other methods such as grey relational degree, Malmquist method and fuzzy evaluation method; and more of them indicated that the financing efficiency of high-tech SMEs is not optimistic (Gong et al., 2014; W. Wang & Dong, 2020; Xiu & Li, 2016). As to the influencing factors, some scholars were concerned about the internal environmental factors such as profitability, growth ability, debt solvency, operational capability, R&D, and innovation capability, just to name a few (W. Wang & Dong, 2020). Few scholars focused on the relationship between the financing efficiency of high-tech SMEs and the external environment.
DEA model widely used in the above literature is a quantitative analysis method employing the method of linear programming for relatively efficiency evaluation in a new field of crossing research of operations research, management science and mathematical economics, which has unique advantages in dealing with multi-indicator inputs and outputs. For panel data, however, differences in the efficiency frontiers of different years were often ignored when using the traditional DEA model, which makes it meaningless to compare the efficiencies of a decision-making unit (DMU) among different years. For example, if a DMU’s efficiency in year A is greater than that in year B, it only reflects that the efficiency in year A is closer to the efficiency frontier of year A, that is, the efficiency in year B is farther from the efficiency frontier of year B. Therefore, a direct comparison of efficiencies in different years cannot reflect whether the efficiency of one DMU has changed and what the change is. Furthermore, some researchers brought together high-tech SMEs in different industries for comparison, ignoring that enterprises in different industries usually face different production frontiers, which is misaligned with the requirement of DEA model that all DMUs should be homogeneous.
Through the review of the above literature, it can be found that relevant research can be improved in the following aspects. Firstly, little literature took the Yangtze River Delta as an example to present the financing efficiency of high-tech SMEs, although the Yangtze River Delta is the core area for the development of Chinese high-tech SMEs. Secondly, in reality, financing efficiency is influenced by both external and internal environmental factors, while few papers incorporated them into the same analysis framework, rendering the implication one-sided. Thirdly, DEA model used for panel data in some papers had some methodological misuse. The objectives of this paper are to evaluate the financing efficiencies in a homogeneous environment of high-tech SMEs in the China Yangtze River Delta for the period 2014 to 2020, and to investigate the external and internal environmental factors. To achieve these objectives, high-tech SMEs of information technology industry, the pioneer of science and technology innovation in the Yangtze River Delta, are taken as research samples, to meet the requirement of DEA model that all DMUs should be homogeneous. In terms of the research models, a panel three-stage DEA model is employed to present the current situation of financing efficiency of the research samples, and external and internal influencing factors are integrated and analyzed by Panel Stochastic Frontier Analysis (Panel SFA) and Tobit model.
The study has made three main contributions to existing studies in the field. The first contribution is to make up for the lack of a case study of the Yangtze River Delta, the most developed region in China, in existing studies. In addition, high-tech SMEs selected and registered by provincial science & technology administrative departments in the Yangtze River Delta according to the Evaluation Methods of High-tech SMEs and the Guidelines on the Evaluation Service of high-tech SMEs are taken as research samples, which is more accurate than most previous studies in which researchers artificially screened samples based on simple indicators such as industry classification and enterprise size. The second contribution is to employ an improved three-stage model applicable to panel data to prevent the neglect of the differences in efficiency frontiers of different industries in the same year and of the same industry in different years when making efficiency estimates of high-tech SMEs to ensure the accuracy of financing efficiency estimation results. The third contribution is to construct a comprehensive index system that includes internal and external influencing factors affecting financing efficiency to comprehensively assess the factors affecting financing efficiency. This study helps to offer some more accurate practical implications for the better development of high-tech SMEs in the Yangtze River Delta.
Methodology
Research Model
Panel Three-Stage DEA
Removing external environmental factors and random noise, three-stage DEA can produce results that are closer to the real situation than single-stage DEA, but traditional three-stage DEA is only applicable to cross-sectional data. Panel three-stage DEA proposed by Liu et al. (2014) can overcome the problem of the non-uniform efficiency frontier for panel data to rationalize the comparison of efficiencies of time series across years. Although Malmquist method can objectively present the cross-year changes of efficiency, the result can only reflect the change direction but not the value at the unified efficiency frontier, while the panel three-stage DEA model can. It can proceed in three stages:
(1) The first stage: Construct a DEA model to estimate the initial efficiencies
DEA-BCC model input-oriented and based on variable returns to scale is constructed due to the easy control of inputs than outputs and the complex economic and policy environment high-tech SMEs face which lead to the different proportions of the increase of inputs and outputs. In the model, panel data is processed as cross-sectional data to obtain the efficiencies at the unified efficiency frontier.
(2) The second stage: Construct Panel SFA to modify initial inputs
The efficiency measured by the traditional DEA model is related to environmental effects, statistical noise and managerial inefficiencies which is criticized for causing inaccurate initial evaluation results. The first two factors need to be eliminated to avoid biased results. Some scholars consider employing SFA, the most widely used parametric technique, to decompose the input slack into a function containing three independent variables: environmental effects, stochastic disturbance term, and managerial inefficiency term so as to guide the modification of initial efficiency (Liu et al., 2014; Zhao et al., 2022). As the second step of panel three-stage DEA, Panel SFA proposed by Battese and Coelli (1992, 1995) is employed to estimate the impact of the external environment on input slack, which serves two purposes in this paper: one is to present the relationship between input slack of enterprises and external environment, that is, external influencing factors affecting financing efficiency, and the other is to remove the environmental effects and statistical noise of financing efficiency estimated in this stage in the third stage to make sure that the financing efficiency after modification of each enterprise is only related to its internal environment.
Assume that the sample number of high-tech SMEs is K, the number of periods is T, and the number of input variables is I. Panel SFA is performed with the dependent variable—input slacks obtained in the first stage:

In equation(1),
We can estimate

Where

Under the input orientation, the results of equation (3) need to be brought into equation (4) to modify the initial inputs:

In equation (4),
(3) The third stage: Re-estimate efficiencies with DEA model
Perform the DEA-BCC again after replacing the initial inputs with the modified inputs. The efficiencies which have excluded environmental effects and stochastic disturbance can more objectively reflect the actual financing efficiencies.
Tobit Model
Taking the modified efficiencies as the dependent variables, we investigate the influence of internal environmental factors on the financing efficiency of high-tech SMEs. Given that the efficiencies are all between 0 and 1 which are in accordance with a truncated discrete distribution, the Tobit model is constructed as follows:

In equation (5),
Variables and Data
Input Variables and Output Variables
Input variables should comprehensively reflect the financing situation of enterprises. Combined with the research results of other scholars and the availability of data, the input variables are set from three perspectives: financing scale, financing structure, and financing cost. Referring to X. Li (2015), financing scale is represented by total assets, for it reflects an enterprise’s total scale of debt financing and equity financing. Financing structure is represented by asset-liability ratio (Gu & Bian, 2020), specifically expressed as the absolute value of the difference between the asset-liability ratio of the enterprise and that of the industry average, and the smaller the value, the more reasonable the financing structure. Taking into account the fact that enterprises listed on the New OTC Market still mainly finance through indirect means such as bank credit due to the low market liquidity of the New OTC Market (Xu & Zhai, 2021), financing cost is thereby represented by debt financing cost, according to H. J. Zhang (2017). Financing has proved beneficial for the growth and profitability of enterprises, so output variables include operating income growth rate which measures the growth ability of an enterprise (W. Wang & Dong, 2020) and ROE which measures the profitability of an enterprise (Xiu & Li, 2016). For the former, the value is proportional to the growth ability of an enterprise. For the latter, it can measure the efficiency of an enterprise’s use of its own capital and the level of its owners’ equity, the higher the value, the higher the profitability. The description of input variables and output variables is shown in Table 1.
Variables Selection of the Panel Three-Stage DEA Model.

Note. According to the “Accounting Standards for Business Enterprises No.16-Government Subsidies (Revised in 2017)” revised by Ministry of Finance in 2017, government subsidies received by enterprises from 2014 to 2016 are obtained from “non-operating income,” and from 2017 to 2020 are obtained from “other income” and “non-operating income” in the annual report.
Original asset-liability ratio and debt financing cost are taken as the reciprocals to meet the requirements that all inputs and outputs in DEA are positively correlated and all the data are non-negative.
External Environment Variables
External environment variables should have impacts on financing efficiency but cannot be controlled by DMUs. Notable features of high-tech SMEs are high technological content, large capital demand, and strong government support, so four external environment variables—economic environment, financial environment, technical environment, and policy environment—are selected and shown in Table 1. Non dimensional treatment for the data of input variables, output variables, and external environment variables are conducted to make them in the range [0.1,1].
Internal Environment Variables
Internal environment variables are described as follows: (1) Growth ability represented by the growth rate of operating income, and profitability represented by ROE. (2) Short-term debt solvency represented by current ratio which is equal to current assets divided by current liabilities, and long-term debt solvency represented by asset-liability ratio which is equal to total liabilities divided by total assets. (3) Financing cost represented by debt financing cost. (4) R&D and innovation capability represented by three variables: R&D investment, the proportion of technical employees to the total employees, and the proportion of employees with a bachelor’s degree and above to the total employees. (5) Governance structure represented by three variables: equity concentration represented by the shareholding ratio of the largest shareholder at the end of the period, the proportion of managers with a bachelor’s degree and above to the total managers, and the average age of managers. (6) Enterprise age represented by enterprise operation period. The squared term of enterprise age is added to explore whether there is a trend of an inverted U-shaped curve between enterprise age and financing efficiency. (7) Scale of enterprise represented by total assets.
Data
This study takes high-tech SMEs of information technology industry in the China Yangtze River Delta (including Jiangsu, Zhejiang, Anhui, and Shanghai) as examples, and among them, enterprises listed on the New OTC Market constitute the sample set of this study because the New OTC Market is an important platform for low-cost financing and the information disclosure is complete for high-tech SMEs. After enterprises recognized as high-tech SMEs in Jiangsu, Zhejiang, Shanghai, and Anhui from 2014 to 2020 were collected from the website of Torch High Technology Industry Development Center, Ministry of Science & Technology, enterprises of information technology industry listed on the New OTC Market were selected from them. Data after 2014 were selected because National Equities Exchange and Quotations (NEEQ) began to officially accept applications for listing nationwide on December 31, 2013. Next, enterprises marked with ST, ST* and with unsound annual reports and abnormal data were removed. A total of 41 enterprises are ultimately found to be qualified, including 10 enterprises from Jiangsu, 7 enterprises from Zhejiang, 21 enterprises from Shanghai, and 3 enterprises from Anhui. Altogether, the study’s data set comprises 287 DMUs, which satisfies the rule of thumb that the number of DMUs should be more than twice the number of input and output variables. Enterprise data are derived from annual reports of each enterprise (2014–2020) disclosed in the NEEQ, and regional data are derived from Statistical Yearbooks of Jiangsu, Statistical Yearbooks of Zhejiang, Statistical Yearbooks of Anhui, Statistical Yearbooks of Shanghai (2015–2021), and the website of the National Bureau of Statistics.
Results and Discussions
Financing Efficiencies After Modification
Financing efficiency includes technical efficiency, pure technical efficiency and scale efficiency. Financing technical efficiency is a comprehensive evaluation of the financing efficiency affected by the ability of resource allocation and utilization, which is equal to the product of pure technical efficiency and scale efficiency (Say et al., 2020). Financing pure technical efficiency refers to the efficiency determined by the level of technology R&D and management at the optimal scale of enterprise (Coskun et al., 2021). Financing scale efficiency reflects the difference in financing efficiency between the actual scale and the optimal scale of the enterprise under certain condition of technology and management (Coskun et al., 2021). DEAP 2.1 and Frontier 4.1 developed by Coelli (1996a, 1996b) are the software used in this paper to complete the estimation of the first and third stage of panel three-stage DEA, that is, the evaluation of financing efficiency before and after modification, and the second stage of panel three-stage DEA, that is, Panel SFA, respectively. Table 2 reports the evaluation result employing DEAP 2.1 and Frontier 4.1. The influences of environment and luck have been removed from the financing efficiencies after modification, which are the main objects of analysis below.
(1) Analysis of the financing technical efficiency
Financing Efficiencies From 2014 to 2020.
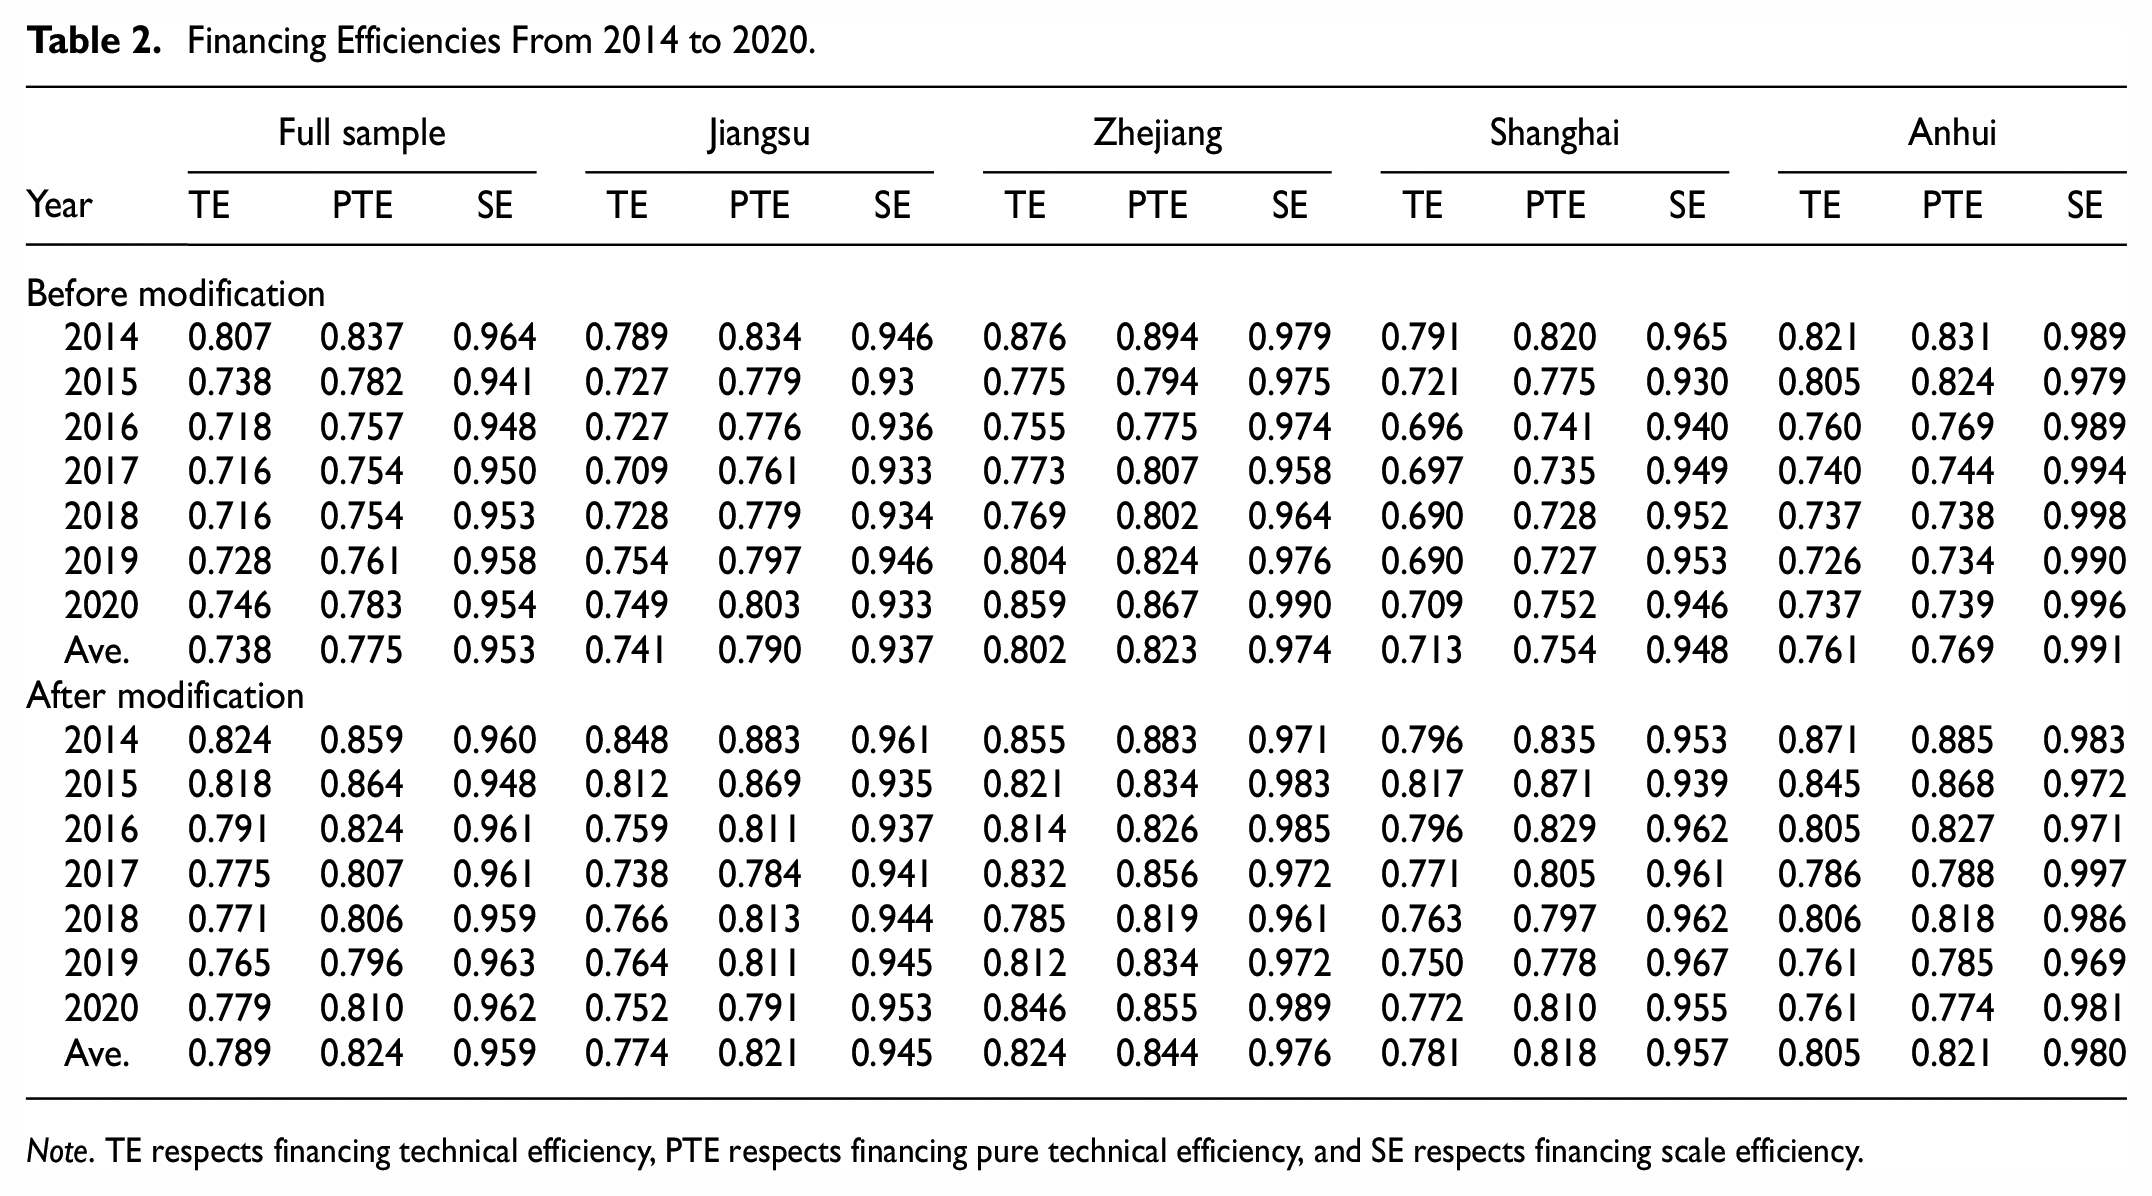
Note. TE respects financing technical efficiency, PTE respects financing pure technical efficiency, and SE respects financing scale efficiency.
On the whole, decreasing by 5.46% from 2014 to 2020, the financing technical efficiency is distributed between 0.765 and 0.824, at a moderate level, and shows a U-shaped trend. Losses caused by pure technical inefficiency and scale inefficiency account for 53.79 and 46.21%, respectively, which reveals that the main contributor to the not high financing efficiency is low pure technical efficiency. In detail, the financing technical efficiency of enterprises from Shanghai is greatly affected by the environment with the largest change in financing technical efficiency before and after modification. The average financing technical efficiency of 0.824 of enterprises from Zhejiang is the highest, followed by enterprises from Anhui and Shanghai, whereas the average financing technical efficiency of enterprises from Jiangsu is 0.774, which is the lowest among all provinces (municipalities).
(2) Analysis of financing pure technical efficiency
Overall, the financing pure technical efficiency of 0.864 in 2015 has improved compared with 2014, and then decreased year by year from 2015 to 2019, finally rose to 0.810 in 2020, which was 5.7% lower than in 2014. With respect to provinces (municipalities), the efficiency of enterprises from Shanghai still has the largest change (increases by 8.49%), followed by Anhui, Jiangsu and Zhejiang with changes of 6.76, 3.92, and 2.55%, respectively, before and after modification. According to the order from largest to smallest, the financing pure technical efficiency is sorted as Zhejiang, Jiangsu (equivalent to that of Anhui) and Shanghai, indicating that the management and science and technology innovation of enterprises from Zhejiang is at a higher level, whereas enterprises from Shanghai need to strengthen management and science and technology innovation to improve the financing efficiency.
(3) Analysis of financing scale efficiency
The financing scale efficiency at a relatively high level between 0.948 and 0.963 has fluctuated continuously over the last 7 years with a small magnitude of the change, from the perspective of the full sample. And it has increased slightly by 0.21% from 0.960 in 2014 to 0.962 in 2020. With regard to different provinces (municipalities), enterprises from Anhui present the highest financing scale efficiency of 0.980, followed by enterprises from Zhejiang of 0.976, and enterprises from Shanghai are relatively low at 0.957, whereas enterprises from Jiangsu are the lowest at 0.945. The result indicates that the inputs and outputs of the capital of high-tech SMEs from Anhui are more reasonable and more in line with returns to scale, whereas the scale of enterprises from Jiangsu limits the improvement of financing efficiency compared with the others.
(4) Distribution of financing technical efficiency of sample enterprises
The 7-year average of financing technical efficiency of each sample enterprise is between 0.677 and 0.898 by computation. Learning from the practice of W. Wang and Dong (2020), financing technical efficiencies over the years are divided into four ranges: [0, 0.5) represents a relatively inefficient range, [0.5, 0.8) represents a quasi-relatively inefficient range, [0.8, 1) represents a quasi-relatively efficient range, and 1 represents a relatively efficient range. Figure 1 provides the numbers of DMUs in each of the four ranges from 2014 to 2020.

Distribution of financing technical efficiency of sample enterprises.
In the past 7 years, there were 10 DMUs whose financing technical efficiency were in the relatively efficient range, that is, their financing reached the technical efficiency frontier. In 2014 to 2015, the number of DMUs in quasi-relatively efficient range was greater than that in quasi-relatively inefficient range, whereas the quantitative relationship reversed in 2016 to 2020. Overall, the proportions of DMUs in the relatively efficient, quasi-relatively efficient, and quasi-relatively inefficient ranges to the total DMUs during the 7 years were 3.48, 38.33, and 58.19%, respectively. No DMU was in the relatively inefficient range. The findings indicate that the improvement of financing technical efficiency should be further pursued for most enterprises.
(5) Distribution of financing scale efficiency and financing pure technical efficiency of sample enterprises
Referring to Xue et al. (2019), we calculate the 7-year average of financing scale efficiency and the 7-year average of financing pure technical efficiency respectively of each enterprise before using the former as the X-axis (bounded by the mean 0.959) and using the latter as the Y-axis (bounded by the mean 0.824) to establish a distribution map which is shown in Figure 2.
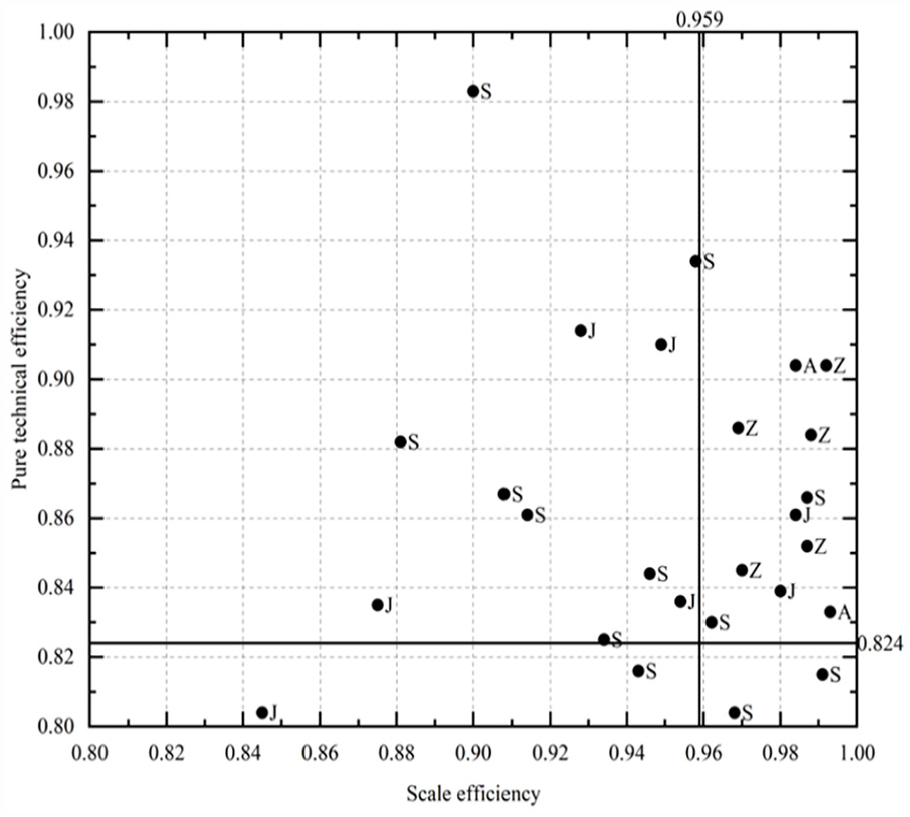
Distribution of financing scale efficiency and pure technical efficiency of sample Enterprises.
The distribution map is divided into four quadrants, corresponding to four types of enterprises. “Double-high-type” enterprises whose financing scale efficiency and pure technical efficiency are both higher than the average are located in the first quadrant, which account for 26.83% and should maintain the current science and technology innovation, management policies and enterprise scale to keep higher financing efficiency. “High-low-type” enterprises, which come in at 26.83%, in the second quadrant with higher financing pure technical efficiency but lower financing scale efficiency than the average, require an adjustment to the scale of enterprise to improve financing scale efficiency. Located in the fourth quadrant are “low-high-type” enterprises accounting for 39.02% with higher financing scale efficiency and lower financing pure technical efficiency, which should focus on the improvement of technology research and management in the future. The rest, in the third quadrant, accounting for 7.32%, are “double-low-type” enterprises which are suggested to not only enhance the level of technology R&D and management but also pursue the further optimization of the scale of enterprise. Figure 2 shows that the vast majority of the sample enterprises from Zhejiang and Anhui are classified into the “double high-type,” whereas most from Shanghai and Jiangsu are classified into the “high-low-type” or “low-high-type.”
In this section, we present the whole picture of the financing efficiency of high-tech SMEs in the Yangtze River Delta for the period 2014 to 2020, covering areas not covered by existing literature. The research is very necessary and worthwhile because the Yangtze River Delta is the most dynamic region in China from the perspective of economic development and technology innovation. Panel three-stage DEA overcomes some shortcomings in previous studies, such as ignoring the differences in efficiency frontiers of different industries in the same year and of the same industry in different years when making efficiency estimates of high-tech SMEs, hence the results are more credible. Although we just take the information technology industry in the Yangtze River Delta as an example, such a comprehensive analysis reveals the features of the financing efficiency of Chinese high-tech SMEs to a certain degree—the level is not high, and the regional differences are significant.
The Influence of the External Environment on Financing Efficiency
Using the three input slacks obtained in the first stage of panel three-stage DEA as the dependent variables and the four external environments as the independent variables, statistically meaningful results related to the relationship between input slacks of enterprises and external environment are drawn based on Panel SFA. Table 3 reports the estimation results.
The Influence of the External Environment on Input Slacks.

Note. Data in parentheses () are t value.
, **, and ***, represent significance at 10%, 5%, and 1%, respectively.
Almost all coefficients of independent variables and LR, σ2 are significant, indicating that there is a significant linear relationship between input slacks and external environment, and both model setting and variable selection are reasonable. It can be concluded that managerial inefficiencies rather than stochastic disturbance are dominant in the mixed error term from the three γ which are all significantly greater than 0.5 at the level of 1%.
(1) The three coefficients of economic environment are positive with statistical significance at the 10% level, indicating that the higher GDP per capita of the city where the enterprise is located, the more input slacks of the enterprise, that is, the lower the financing efficiency. This result is consistent with the reality: many enterprises, especially large and high-quality enterprises, tend to gather in economically developed areas for the pursuit of rich resources where financial institutions may face “mission drift”—provide more funds to large and high-quality enterprises but reject SMEs with high risks and high transaction costs (Sun et al., 2021), resulting in inefficient financing transactions of high-tech SMEs. Such a result is consistent with research by Zhao and Lian (2021) in the heterogeneity test based on regions with different development levels when they took listed enterprises on China’s Science and Technology Board as an example. It implies that financial institutions in economically developed areas should improve their awareness and ability to serve high-tech SMEs.
(2) From the perspective of financial environment, all of the three coefficients are significantly negative at the level of 5%, revealing that a high level of regional financial development in the Yangtze River Delta can significantly reduce input slacks. The positive correlation between the regional financial environment and the availability of access to financing of SMEs has been emphasized by a few studies (Khurana et al., 2020; Lin et al., 2020; Xia et al., 2019), while this paper extends the influence of financial environment to the financing efficiency of high-tech SMEs in the Yangtze River Delta and comes to the same conclusion. This conclusion has important policy implications for the financial environmental enhancement to improve the financing efficiency of high-tech SMEs in the Yangtze River Delta. It inspires us to promote regional financial development so as to widen the channel for financing and provide risk protection for local high-tech SMEs, which enables enterprises to obtain more information and funds to promote successful science and technology innovation to get more outputs.
(3) Great technical development in the Yangtze River Delta is conducive to the reduction of input slacks and the improvement of the financing efficiency of high-tech SMEs in the information technology industry, which can be found from the three significantly negative coefficients of the technical environment. There are few studies on the impact of the technical environment on the financing efficiency of high-tech SMEs. Some studies have investigated this issue for other types of enterprises in the Chinese context. Q. Wang and Geng (2017) indicated that the special technical level of the enterprise has an influence on the financing efficiency of strategic emerging listed companies from China; Ling et al. (2021) found that financial technology can alleviate the financial constraints on enterprises. Similarly, we extend the sample to high-tech SMEs in the Yangtze River Delta and draw similar conclusions. The important implication of this study is that a professional platform for innovation and transformation of scientific and technical achievements is available for high-tech SMEs in a good technical environment, which will lead to an improvement in financing allocation efficiency.
(4) Coefficients of policy environment on total assets slacks and asset-liability ratio slacks are significantly positive, while the coefficient on debt financing cost slacks is positive but not significant, which implies the negative effect of government subsidies on financing efficiency—R. Li and Feng (2009) pointed out that even if some coefficients in SFA are not significant, directional influences are still deemed to be present. It seems to be inconsistent with the positive role of government subsidies in SMEs’ performance concluded in some existing studies based on the information of enterprises in Aquitaine and South Korea (Bedu & Vanderstocken, 2020; Park & Seong-Pyo, 2021). However, Y. X. Zhang and Zhao (2015) reached the same conclusion as this paper based on a study of 559 science & technology listed enterprises in China. To some extent, this strengthens the conclusion that there is a negative correlation between government subsidies and financing efficiency in China by adopting another approach. It can be explained from the following two aspects according to the research of other scholars. On the one hand, government subsidies provide an informative signal to the market-based lenders to the benefit of the improvement of the financing transaction efficiency (Takalo & Tanayama, 2010); meanwhile, the availability of financing facilitates the growth of high-tech SMEs. On the other hand, perhaps more importantly, government subsidies may reduce high-tech SMEs’ awareness of risk and enthusiasm for reform and innovation, and cause excessive reliance on subsidies and even rent-seeking behaviors to defraud government subsidies (Yu et al., 2020), resulting in input slacks and wastes. The opposite effects of Chinese and foreign government subsidies on SMEs’ financing suggest that we should optimize financing support policies to make the positive effects of government subsidies outweigh the negative effects, and finally produce the desired result.
Although the relationship between SMEs’ financing constraints and external environmental factors has been widely concerned at home and abroad, most investigations of the impact of the external environment on SMEs’ financing efficiency point to China as an example since there is no such thing as inefficient financing in western countries, usually taking listed enterprises on China’s Science and Technology Board, SMEs, strategic emerging listed companies, and science & technology listed enterprises as research samples. High-tech SMEs in China are selected annually by provincial science & technology administrative departments in accordance with strict regulations on enterprises’ financial status, operating conditions, science and technology innovation, environmental friendliness, and so on. Such enterprises have been heavily supported by the government in recent years. Creating a favorable development environment has become an important means of government support. In this paper, a comprehensive external environment index system is constructed to investigate the relationship between the external environment and financing efficiency of enterprises recognized as high-tech SMEs and registered in the database, which is rare in the existing literature. We have concluded that compared with other external environments, the optimization of the financial environment has the greatest effect on reducing input slacks and improving the financing efficiency of high-tech SMEs in the Yangtze River Delta, no matter what kind of input slack is used as the dependent variable, followed by the technical environment. Regrettably, in the context of China, economic development and government subsidies are positively correlated with input slack. It is believed that policymakers in the Yangtze River Delta will draw some inspiration from the results.
The Influence of the Internal Environment on Financing Efficiency
The estimation results of the random effects Tobit model on the impact of high-tech SMEs’ internal environment on financing efficiency are shown in column (1) in Table 4.
(1) The coefficient of debt financing cost is significantly positive at the level of 1%, which is inconsistent with the study of Yao and Dai (2020) in the case of medium and small film & TV production enterprises and the study of Yuan et al. (2018) in the case of high-tech SMEs and micro businesses of NEEQ. The reason for this difference may be that different sample enterprises were selected and the samples in this paper are derived from the approved and registered high-tech SME, rather than simple and manual selection as in other studies. This result can be explained by the management pressure effect for high-tech SMEs. Those identified as high-tech SMEs will be assessed annually and excluded from the list of high-tech SMEs if they have abnormal situations such as poor management, thus losing the opportunity to enjoy the precise preferential policies. High debt financing cost directly results in the loss of financing transactions efficiency, which has been verified in the existing literature; whereas more importantly, the managers are under pressure to use funds efficiently in the absence of low-cost financing in order to pass the annual evaluation, facilitating the financing allocation efficiency. The coefficients of operating income growth rate, current ratio, and the proportion of highly educated employees are all significant and positive. To some extent, great growth ability, strong short-term debt solvency, and more highly educated employees help achieve the financing allocation efficiency improvement by fostering the enhancement of the labor productivity of the enterprise.
(2) The coefficient of asset-liability ratio, positive and significant, reveals that long-term debt solvency is positively correlated with financing efficiency, while most previous studies taking other types of enterprises as research samples have confirmed their negative correlation (G. Zeng & Geng, 2019). Research using the information on high-tech enterprises from 1994 to 2001 showed that the increase in liabilities relative to owners’ equity is conducive to the growth of enterprises (Cheng & Xing, 2003), which is consistent with the conclusion of this paper. In theory, a high asset-liability ratio is an indicator of not only the high risk of long-term debt repayment but also the strong ability to use assets from creditors for an enterprise. On the one hand, the high risk of long-term debt repayment leads to the improvement of the financing allocation efficiency due to the management pressure effect of high-tech SMEs mentioned above. On the other hand, assets provided by creditors, that is, assets acquired from debt financing, are considered to be more favorable to the return on assets than assets acquired from equity financing, according to the tax shield effect (Miller, 1963); therefore, benefiting from the better use of financial leverage, enterprises with high asset-liability ratio can maintain enough lower-cost available cash flow so as to improve financing efficiency.
(3) The coefficient of R&D investment is significantly negative at a 1% level, indicating the existence of a statistically significant negative relationship between R&D investment and financing efficiency. Such a result has been verified by several studies (Lan & Zhang, 2020). On the one hand, the outputs of R&D investment are mainly intangible assets, such as patent rights and copyrights, with the notable features of the difficult transaction and difficult value confirmation (Al-Tahat et al., 2021), which restrict enterprises from getting financing from outside to some extent, and thereby drive low financing transactions efficiency. On the other hand, return on R&D investment usually takes a long time (B. Yang & Lin, 2016), leaving a significant amount of funds tied up for a long duration and reducing short-term available cash flow which is essential to maintain the normal operation of the enterprise, to the disadvantage of financing allocation efficiency.
(4) Equity concentration shows a negative impact on financing efficiency, which can be inferred from the coefficient of equity concentration. Ma and Li (2019) came to the same conclusion based on a study of listed enterprises in China’s New Third board market. However, based on the information from 755 technology-type listed companies in China, Gu and Bian (2020) concluded that the improvement of equity concentration promotes the financing efficiency of enterprises. The reason for the different conclusions can still be attributed to the different samples. The possible explanation is that the concentration of equity may cause an asset substitution effect, mainly for the creditors to raise the borrower’s loan financing cost based on the consideration that wealth can be easily transferred from creditors to shareholders, particularly for enterprises with highly liquid assets and when they are financed by long-term debt (Han, 2008), and shareholders may invest in high-risk projects. In addition, equity concentration presents a positive influence on technology innovation activity in the long view (Kim et al., 2016), but the performance is not obvious in a short term. The above two aspects jointly lead to the negative correlation between financing efficiency and equity concentration observed in this study.
(5) The coefficient of the average age of managers is significantly negative, from which we can draw a conclusion that the younger the managers, the higher the financing efficiency, inconsistent with the conventional view in the literature based on a sample of traditional enterprises (Tian & Zhang, 2020). Compared with older managers, younger managers have more advantages in learning, information integration and the application of information technology, and they are more inclined to engage in technology innovation activities, which is exactly what high-tech SMEs need and conducive to the improvement of financing efficiency. Furthermore, it is visible that the scale of the enterprise is negatively correlated with financing efficiency from the coefficient of total assets, which has been revealed by some previous studies (Jin et al., 2021). The reason may be that small enterprise has more flexibility and freedom to adjust business strategy to realize the efficient use of funds.
The Influence of the Internal Environment on Financing Efficiency.

, **, *** represent significance at 10%, 5% and 1%, respectively.
It should be noted that the signs of some coefficients of internal influencing factors on financing efficiency such as debt financing cost, asset-liability ratio, and the average age of managers, are contrary to that in the existing literature based on the samples of other types of enterprises, which brings us some new insights for the reform of high-tech SMEs; for example, the practices of other types of enterprises cannot be mechanically applied to high-tech SMEs. In addition, some conclusions differ from some existing literature based on high-tech SMEs or technology-type listed companies, which may be attributed to the selection of different samples. We only take enterprises recognized as high-tech SMEs by provincial science & technology administrative departments and registered in the database in the China Yangtze River Delta as a research object. On the one hand, this avoids the average effect caused by taking enterprises in a wider range of areas as samples, so that the conclusions are more targeted. On the other hand, this avoids the subjectivity of the previous studies on the identification of high-tech SMEs, which leads to more accurate conclusions.
Robustness Check
Robustness Check of the Influence of the External Environment on Financing Efficiency
The robustness of the influences of external factors on the financing efficiency of high-tech SMEs is tested using the panel data model. Model selection is crucial in the empirical analysis of panel data. Hausman test is the basis for choosing a fixed effect model or a random effect model. Hausman test results show that when total assets slacks and debt financing cost slacks are taken as the dependent variables, p values are 0.1180 and 0.2133, respectively, thus accepting the null hypothesis that the random effect model should be constructed; whereas the p value is 0.0668 when taking asset-liability ratio slacks as the dependent variable, indicating conducting fixed effect model. Table 5 reports the estimation results.
Robustness Check of the Influence of the External Environment on Input Slacks.
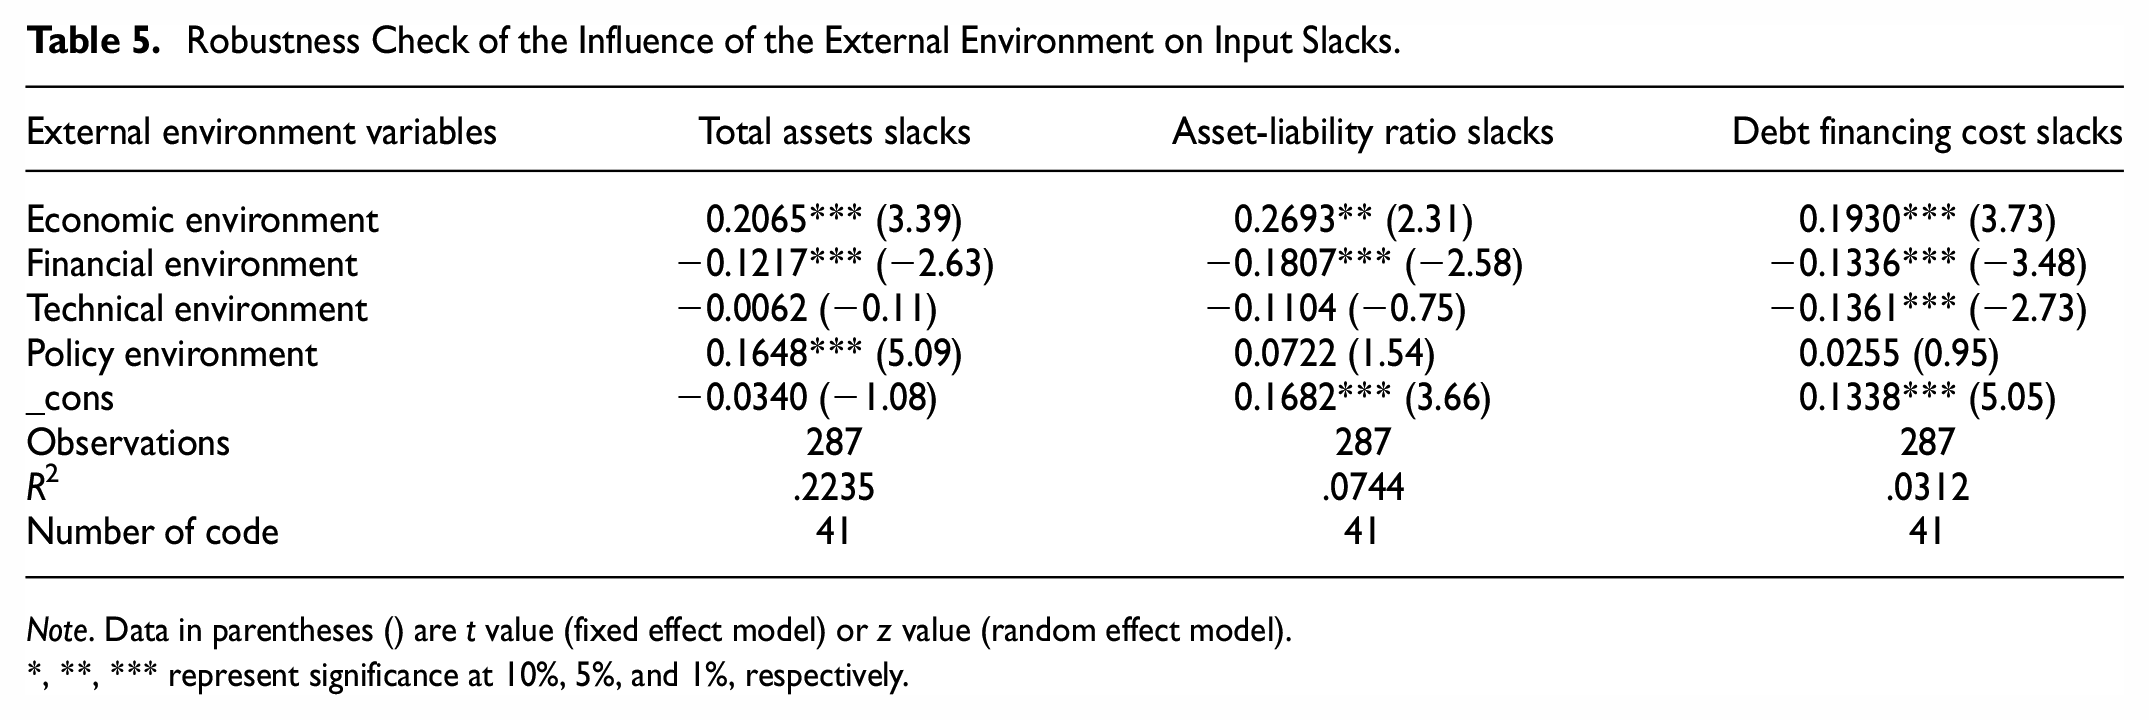
Note. Data in parentheses () are t value (fixed effect model) or z value (random effect model).
, **, *** represent significance at 10%, 5%, and 1%, respectively.
The signs of the three coefficients of the economic environment and the three coefficients of the policy environment are all positive, although some of them are not significant, confirming the conclusion that being in an economically developed area and receiving government subsidies are not conducive to the improvement of the financing efficiency of high-tech SMEs. The signs of all the coefficients of the financial environment and the technical environment are negative, which implies the conclusions mentioned above that high levels of financial development and technical development have positive impacts on the reduction of input slacks and the improvement of the financing efficiency of high-tech SMEs are robust.
Robustness Check of the Influence of the Internal Environment on Financing Efficiency
There are two types of Tobit model: mixed effects Tobit model and random effects Tobit model. The mixed effects Tobit model is conducted to test the robustness of the influences of internal factors on the financing efficiency of high-tech SMEs. The results are shown in column (2) in Table 4. It shows that not only the significance but also the sign of the coefficients has not changed. In detail, the coefficients of operating income growth rate, current ratio, asset-liability ratio, debt financing cost, and proportion of highly educated employees are all significant and positive, the coefficients of R&D investment, equity concentration, the average age of managers, and total assets are all significant and negative, the coefficients of ROE, the proportion of technical employees, the educational structure of managers, and enterprise operation period are not significant, indicating that the above results are robust.
Conclusions and Implications
Above results contribute to the existing relevant literature and policy guidance by investigating the financing efficiency of high-tech SMEs of information technology industry, together with its influencing factors in the case of China Yangtze River Delta.
The results reveal that over the whole period, mainly affected by the low pure technical efficiency, the financing technical efficiency shows a U-shaped trend and remains at a moderate level from the perspective of the full sample. In terms of provinces (municipalities), the financing efficiency shows different spatial distribution patterns: financing technical efficiency shows the spatial distribution pattern of Zhejiang>Anhui>Shanghai>Jiangsu, financing pure technical efficiency shows Zhejiang>Jiangsu=Anhui>Shanghai, and financing scale efficiency shows Anhui>Zhejiang>Shanghai>Jiangsu; most enterprises from Zhejiang and Anhui belong to the “double-high-type,” and most in Shanghai and Jiangsu belong to the “high-low-type” or “low-high-type.” More specifically, DMUs whose financing technical efficiency is in the range of relatively efficient, quasi-relatively efficient, quasi-relatively inefficient, and relatively inefficient account for 3.48, 38.33, 58.19, and 0%, respectively.
Further, an index system is established to explore the determinants of improving financing efficiency comprehensively. Among external environmental factors, the financial environment and technical environment can contribute to financing efficiency. On the contrary, the economic environment and policy environment are negatively correlated with financing efficiency. Internal environmental factors including growth ability, debt solvency, financing cost, R&D and innovation capability, governance structure, and scale of enterprise have significant and different impacts on financing efficiency. These conclusions deserve comprehensive concern in the pursuit of sustainable development of high-tech SMEs.
The study offers practical implications for both policymakers and high-tech SMEs. For policymakers, financing support policies should need to be reconsidered in ways to create a good atmosphere for science and technology innovation by opening a number of public technology platforms mainly for high-tech SMEs and encouraging cooperation between high-tech SMEs, universities, and scientific research institutions in production, education, and research; to allocate financial subsidies in a reasonable manner in the way of improving the ability to identify the authenticity of science and technology innovation information and offering incentive subsidies afterwards to avoid rent-seeking; and to introduce or improve more market-oriented means to broaden financing channels, such as financial institutions dedicated to providing services for high-tech SMEs, financial cooperatives, and other non-governmental organizations, mortgage guarantee mechanisms innovations which are suitable for high-tech SMEs such as the construction of enterprise credit file and the implementation of mutual-aid guarantee, and overseas financial market.
High-tech SMEs are suggested to optimize the internal financing environment and fulfill their potential. Firstly, improve debt solvency, growth ability and other capabilities, fully mobilize the enthusiasm and creativity of employees, and gradually strengthen the independent innovation capability to contribute to labor productivity. Secondly, improve external debt-raising and bargaining capabilities through strengthening credit creation and management, and reducing financing risks with measures such as improving the credit management system, improving product quality, strict accounting, timely tax payment, and debt repayment. Thirdly, avoid the blind pursuit of the expansion of enterprise scale and investment scale, and ensure the rationality and appropriateness of investment to maximize the benefits of economies of scale. Even more importantly, various regions of the Yangtze River Delta should be given full consideration to the coordination and communication, and avoid rushing, blind investment, and overcapacity so as to realize the inclusive and coordinated development of high-tech SMEs.
The limitation of the study is the insufficient sample size reflected in the fact that only 41 high-tech SMEs are explored and the rest enterprises are unexplored, which can be attributed to the unsound or abnormal data. With the improvement of the information disclosure system of high-tech SMEs, future research on financing problems of high-tech SMEs will be closer to the actual situations and provide better guidance for the promotion of financing. Furthermore, further studies are suggested to explore the emerging issues of the impact of the external environmental factor—the development of financial technology (Fin Tech) and the internal environmental factor—the participation of the supply chain on financing efficiency of high-tech SMEs in different industries.
Footnotes
Acknowledgements
The first author acknowledges on behalf of all authors for their concerted efforts toward the paper.
Declaration of Conflicting Interests
The author(s) declared no potential conflicts of interest with respect to the research, authorship, and/or publication of this article.
Funding
The author(s) disclosed receipt of the following financial support for the research, authorship, and/or publication of this article: This work was supported by the Key Project of Philosophy and Social Science Foundation of Higher Education Institutions (Education Department of Jiangsu China) [grant number 2021SJZDA022]; the General Project of Philosophy and Social Science Foundation of Higher Education Institutions (Education Department of Jiangsu China) [grant number 2020SJA0887]; the Key Project of Social Science Foundation of Jiangsu Province (Jiangsu Planning Office of Philosophy and Social Science) [grant number 22EYA005].
Ethical Standard
This paper complied with the code of ethics.