
Abstract
Sustainable tourism plays an important role in enhancing economic benefits, promoting the transformation of development methods, and strengthening international communication. And the tourism footprint is gaining research attention as an essential means for evaluating the sustainability of tourism. However, there have been few attempts to draw a scientific investigation map of the tourism footprint. With the purpose of reviewing systematically the research status and providing ideas for future research in this field, this study conducts a scientometric analysis of 517 academic publications on tourism footprint with CiteSpace. We find that tourism footprint is gaining attention and promotion on a worldwide scale which is becoming a popular multidisciplinary study area. China, the United States, and England have the most productive institutions. There is a marked trend of cross-fertilization of research in this field with other disciplines. And we summarize three predominant research themes: the economic impacts of tourism development, the assessment of tourism footprint, and the promotion of sustainable tourism. Developing a consensus model for tourism footprint accounting and establishing a dynamic monitoring mechanism may get more attention in the future.
Plain language summary
Purpose: systematically review the research status and provide ideas for future research in tourism footprint. Methods: conduct the scientometric analysis based on 517 academic publications with CiteSpace by visualizing the social network, dual-map overlay, co-cited references, structure variation article, and co-occurrence keywords. Conclusions: the tourism footprint become an interdisciplinary hot research topic. China, the United States, and England have the most productive institutions. The relevant articles were mainly published in journals focusing on ecology, veterinary, economics, politics, psychology, and education. The economic impacts of tourism development, the assessment of tourism footprint, and the promotion of sustainable tourism are the predominant research themes. Implications: it helps researchers to track the hotspots of tourism footprint and provides a reference for further collaboration among researchers; innovatively grasps the knowledge sources, the transformation process of research ideas, and the scope of concern; helps researchers understand the research themes and carry out in-depth research around the research hot issues. Limitations: get the publications only from WOS; the academic documents are choosing the type of “article.”
Introduction
In many nations, tourism is one of the socioeconomic industries with the fastest growth rates (International Labour Organization, 2022). Moreover, it is a critical field for industrial transformation (Lee & Chang, 2008), with total global tourist arrivals reaching 12.3 billion in 2019 and total global tourism profits topping $5.8 trillion (6.7 % of global GDP). Although the disastrous effects of the COVID-19 pandemic on the tourism industry, the United Nations World Tourism Organization’s confidence index forecasts that by 2023, international visitor arrivals might rebound to 80% to 95% of pre-pandemic levels globally (World Tourism Organization, 2023), signaling an accelerating recovery in tourism. But the over-exploitation of tourist resources and increasing environmental deterioration impede the development of industry (Makoondlall-Chadee et al., 2021). The research on tourism’s environmental impact, which can be dated back to the 1920s, has lately received more attention (Ehigiamusoe et al., 2022; Khatib, 2023). Many scholars hold the view that tourism may pollute the environment during developing and operating tourism resources (Medeiros et al., 2021). From the tourism supply side, tourism service facilities and faulty planning release environmental pollutants, such as waste gas, wastewater, and solid waste (Gössling, 2002; Gössling & Schumacher, 2010; Cavalheiro et al., 2020). Then from the standpoint of tourism demand, an influx of tourists can result in crowding, chaos, and environmental damage. It may increase energy consumption, water pollution, solid waste, and greenhouse gas emissions from transportation (aircraft, cars, and boats) (Cummings, 1997; Smerecnik & Andersen, 2011; Nocca et al., 2023).
Some researchers discuss how tourism affects the environment by creating a set of indicators that take a variety of elements into account and calculate the environment’s carrying capacity (Sun & Wang, 2005; Andersson & Lundberg, 2013; Roumiani et al., 2023). But the effects of tourism as a whole are not taken into account in these studies. Then the concept of ecological footprint, proposed in Rees (1992), offers a new viewpoint for the investigation of how tourism affects the environment (Mancini et al., 2022). The term “ecological footprint” describes how much biologically productive land and water is required for a population unit (a person, a city, a nation, or all human beings) in a specific area to generate the necessary resources and absorb the created waste under present technological conditions. The ecological footprint measures how much humans rely on nature to survive and estimates the human effect on ecosystems (Khan et al., 2021; Okumus & Erdogan, 2021). Wackernagel and Yount (2000) investigate the ecological footprint of international tourism for the first time. Hunter (2002) defines the tourism ecological footprint and explores its potential for application in tourism sustainability research. Since then, more and more scholars study the term “tourism footprint” (Li & Weng, 2016; Lin et al., 2018; Yeoman & McMahon-Beattie, 2020).
Tourism footprint refers to the numerous resources utilized and waste generated by tourists during their visit in a fixed time and space (Wang et al., 2017). It is a novel perspective in quantifying the tourism industry’s sustainable development status, which includes tourism ecological footprint, tourism water footprint, and tourism carbon footprint (Sun, 2014; Sun & Hsu, 2019). At present, research around the topic of tourism footprint has focused on measurement, especially the computation of a single tourism footprint. In particular, researchers are primarily concerned with tourism ecological footprint (Martín-Cejas and Sánchez, 2010; Lv, 2022; Roumiani et al., 2023), tourism water footprint (Cazcarro et al., 2014; Tian et al., 2015), and tourism carbon footprint (Sun et al., 2019; Yu et al., 2019; Osorio et al., 2023). For example, Li and Zhang (2020) calculate the tourism carbon footprint in Jiangsu Province’s scenic areas in terms of transportation, accommodation, and catering. Sun and Pratt (2014) explore the share of carbon emission levels from domestic tourism, international aviation, and imports in Taiwan’s tourism carbon footprint with a novel framework. Additionally, Habibi et al. (2022) believe that policymakers need to pay adequate attention to the activities of tourists in small areas by calculating the tourism ecological footprint per capita in Hosainabad village in 2018. Using input-output tables and tourism satellite account data, Lee et al. (2021) measure the blue tourism water footprint in China and discuss the main components according to direct and indirect tourism consumption. In addition to the input-output analysis methods mentioned here (Munday et al., 2013; Sun et al., 2020), life cycle assessment methods are also widely used in the calculation of tourism footprint (Filimonau et al., 2011; Michailidou et al., 2016). For instance, based on a life cycle assessment, Santana et al. (2019) discuss the effect of reusing water on the tourism carbon footprint and the tourism water footprint.
When assessing the tourist footprint, it is important to determine the boundary which is the delineation of the geospatial extent of the study. Scholars have used tourism footprint to measure the environmental effects of tourism activities from different scales, such as the city (Lin et al., 2018), country (Laroche et al., 2023), and global (Lenzen et al., 2018). Expanding the scope of tourism footprint accounting has become a hot topic for academics due to the increasing prosperity of global trade in goods and services and the growing interest in outbound tourism (Mancini et al., 2018; Khatib, 2023). For instance, with a panel of 35 countries, Qureshi et al. (2019) measure the ecological footprint of inbound and outbound tourists and further discuss the differential impact of inbound and outbound tourists in terms of nitrogen oxide emissions, biodiversity loss, and air pollution.
In general, current research around the topic of tourism footprint is improving in terms of measurement methods and domains, however, less often it is included within a unified framework for the analysis of knowledge structures. Wang et al. (2017) systematically reviewed the studies related to tourism ecological footprint, tourism water footprint, and tourism carbon footprint in terms of the analytical framework and research methods. This paper provides an important reference for systematic review studies in this field. However, it lacks an in-depth analysis of the knowledge structure of tourism footprint research and the evolution of the research themes. Tourism has the potential to make a significant contribution to the accomplishment of sustainable development goals (Boluk et al., 2019; Sun et al., 2020). Academics and governments still need to pay attention to the environmental impact of tourism development (Osorio et al., 2023). Tourism footprint is an effective approach for quantifying tourism’s environmental impact (Wang et al., 2017; Yeoman & McMahon-Beattie, 2020). Systematically describing the knowledge base of tourism footprint research, application fields, and the future development space of tourism footprint through visualization is an important way to actively promote tourism development and enrich the scope of tourism footprint research. Bibliometric analysis is a form of data mining that allows for a more intuitive and systematic visualization of the current state and direction of research in a given field (Chen et al., 2022; Wani et al., 2023). To guide and inspire interested researchers and practitioners in this field, this conducts a bibliometric analysis to reflect the current state and future trends of tourism footprint research using CiteSpace. Our study should provide answers to the following questions:
Q1:Which authors, countries, and institutions are most influential in this field?
Q2:What are the internal logical connections of tourism footprint research? Which studies are the most cited and have greater influence?
Q3:What are the main hot topics in tourism footprint research? And how can tourism footprints be used to improve sustainable tourism development in the future?
By answering the above questions, this paper has the following contributions. First, it helps researchers to track the hotspots in the field of tourism footprint based on the research dynamics by core authors, institutions, countries, and journals, and provides a reference for further collaboration among researchers. Secondly, this paper innovatively grasps the knowledge sources, the transformation process of research ideas, and the scope of concern through journal dual-map overlay analysis, classical literature analysis, and structural variation analysis. This will enhance researchers’ understanding of the knowledge structure of the tourism footprint research, as well as provide a reference for potential future research directions. Third, with the keyword cluster analysis, researchers can better understand the research themes and carry out in-depth research around the research hot issues.
Methods and Data
Methods and Software
Bibliometric analysis can statistically analyze and assess the influence, contribution, and collaborative networks of authors, journals, papers, and other objects in the literature through data processing and utilization of academic literature (Adnan et al., 2022). Scholars are widely using this method to reveal the knowledge structure and frontier dynamics of a subject area (Anuar et al., 2021; Manyangu et al., 2021). In this study, we perform a visual analysis of tourism footprint basics knowledge and research frontiers through literature co-citations, research collaboration networks, and thematic contributions. Specifically, we achieve this process through social network analysis, the dual-map overlay analysis, cited literature co-occurrence analysis, article structure variation analysis, and keyword cluster analysis with the help of CiteSpace.
Among these analytical methods, the social network analysis is useful to help scholars track core scholars and institutions to understand the latest research developments in the field, as well as to inform scholars, institutions, and countries of collaboration (Guan & Huang, 2022). The dual-map overlay analysis can illustrate the correlation between disciplines in tourism footprint research showing the flow of knowledge at the journal level and reflecting changes in the discipline (Zhang et al., 2022). Cited literature co-occurrence analysis aids in identifying the leading researchers in this subject and their influential works (Chen et al., 2022). Analysis of article structure variation identifies an article’s ability to create unusual or unexpected linkages between various clusters (Yan & Zhang, 2022). And keyword cluster analysis can explore the dynamic evolution of topics in the field of tourism footprint research (Bicheng et al., 2023).
Data and Process
We select publications from WOS which includes the Social Sciences Citation Index (SSCI) and the Science Citation Index Expanded (SCI-E) databases. After several comparisons of various sets of literature data, the search code TS = (tour* footprint) was ultimately established to prevent false detections and missing detections in the search. The selected type is “article.” The initial search generated 517 articles as of January 5, 2022. Because of the necessity for analysis, the data contains complete bibliographic information but is not limited to including author, title, source publications, abstracts, keywords, and cited references. Figure 1 explains the process of CiteSpace and the framework of this study.

The framework of this study.
The visual graph is a network of countless nodes and connecting lines. This research began with the analysis of social networks generated by 517 articles. Then the journal dual-map overlay analysis is used to find the knowledge flow. Next, the co-citation analysis and structural variation analysis were conducted to find the significant and potential literature. Finally, this study conducts a keyword cluster analysis to uncover the hot topics and emerging study trends in tourism footprint. Figure 2 shows the parameters and functions selected for this study.

The main user interface of CiteSpace.
Basic Feature Analysis
Total Number of Publications and Journal Distribution
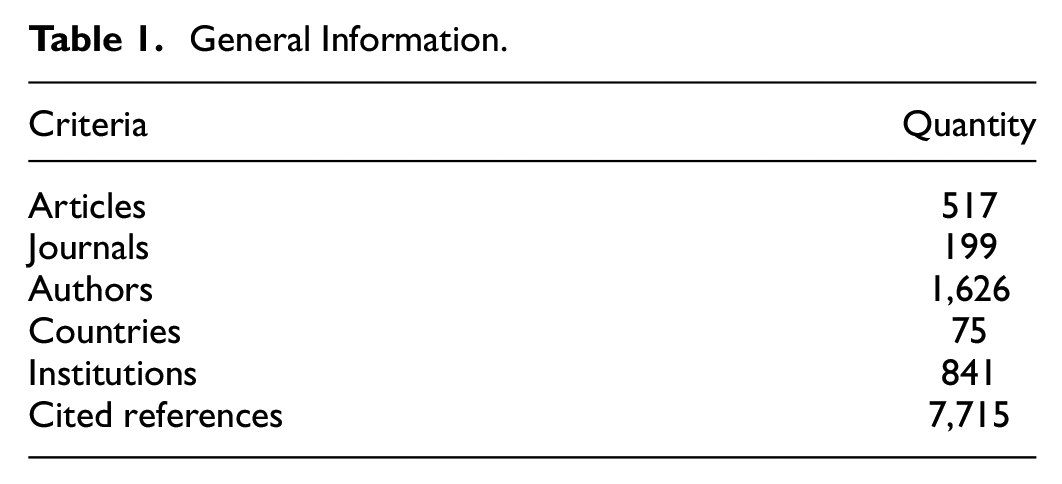
From the WOS website, we get information about papers that have been retrieved (Table 1).
General Information.
As shown in Figure 3, the number of papers published about tourism footprint increased from 1 in 1997 to 95 in 2021 (because 2022 is just one in the cutoff search, the publications are presented up to 2021). Before 2010, tourism footprint research was generally steady, but as the role of tourism in economic development has grown, the environmental effect of tourism has become increasingly important. Tourism footprint research has entered a stage of fast expansion. The number of papers is growing exponentially (R2 reaching 0.975), indicating a rising interest among academics in this field.

The number of published papers on tourism footprint (1997–2021).
Table 2 shows the top journals publishing papers related to tourism footprint, with Sustainability at the top with 58 articles, followed by the Journal of Sustainable Tourism and Journal of Cleaner Production with 41 and 36 publications, respectively. Figure 4 depicts the annual publication status of the top five journals on tourism footprint, with the Journal of Sustainable Tourism and Tourism Management publishing papers on tourism footprint earlier, and the number of publications in Environmental Science and Pollution Research has increased significantly in recent years.
Ranking of Top 10 Active Journals Based on the Frequency.


The top five active journals based on frequency in the field of tourism footprint.
Social Network Analysis
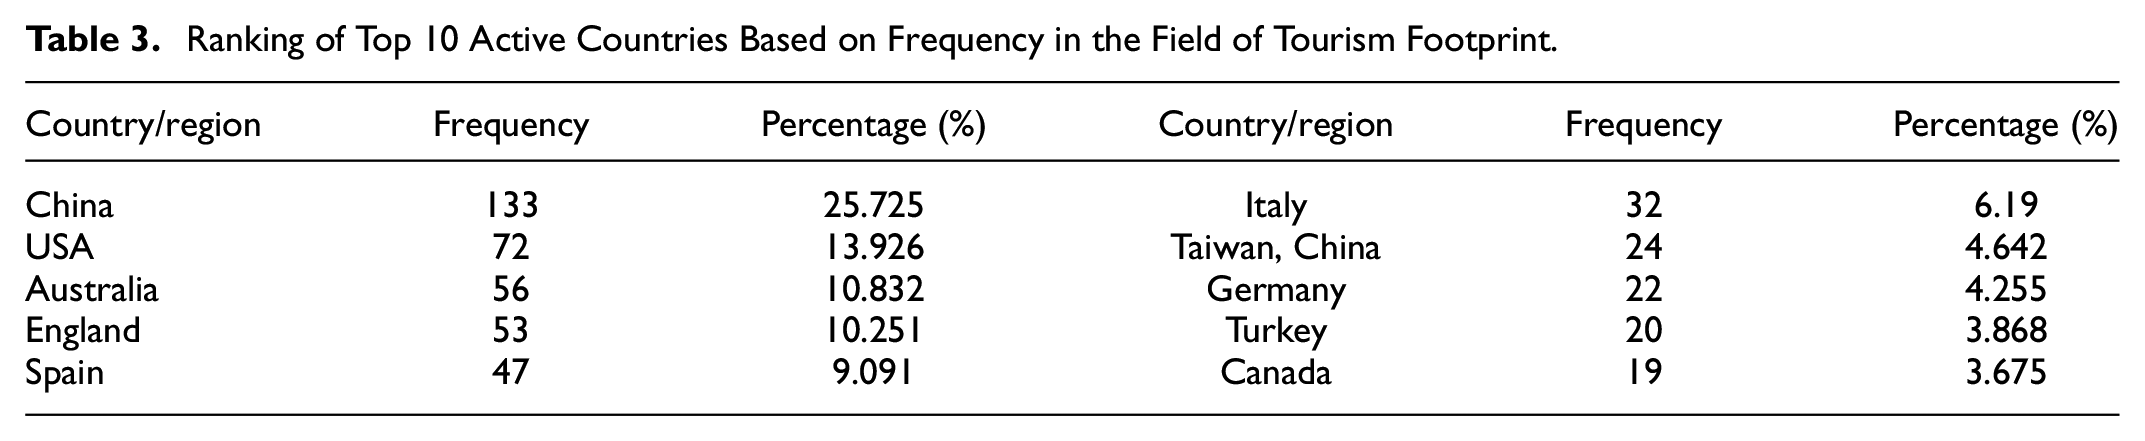
Table 3 shows the ranking of countries with the highest output. China is the country with the most publications (133), followed by the United States (72), Australia (56), and England (53), respectively. Both China and the United States engage in considerable international collaboration. From the thickness of the connecting lines between the nodes (Figure 5), we can find that the cooperation between USA and China, USA and Italy is closer, with a thicker connection. In recent years, several nations have increased their cross-border cooperation study on the tourism footprint.
Ranking of Top 10 Active Countries Based on Frequency in the Field of Tourism Footprint.
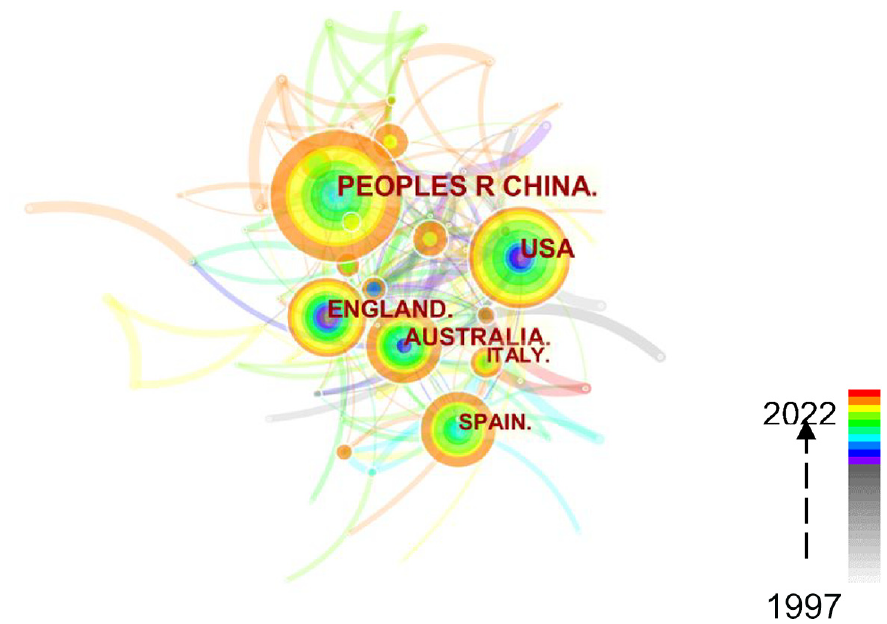
A network map of countries’ collaboration.
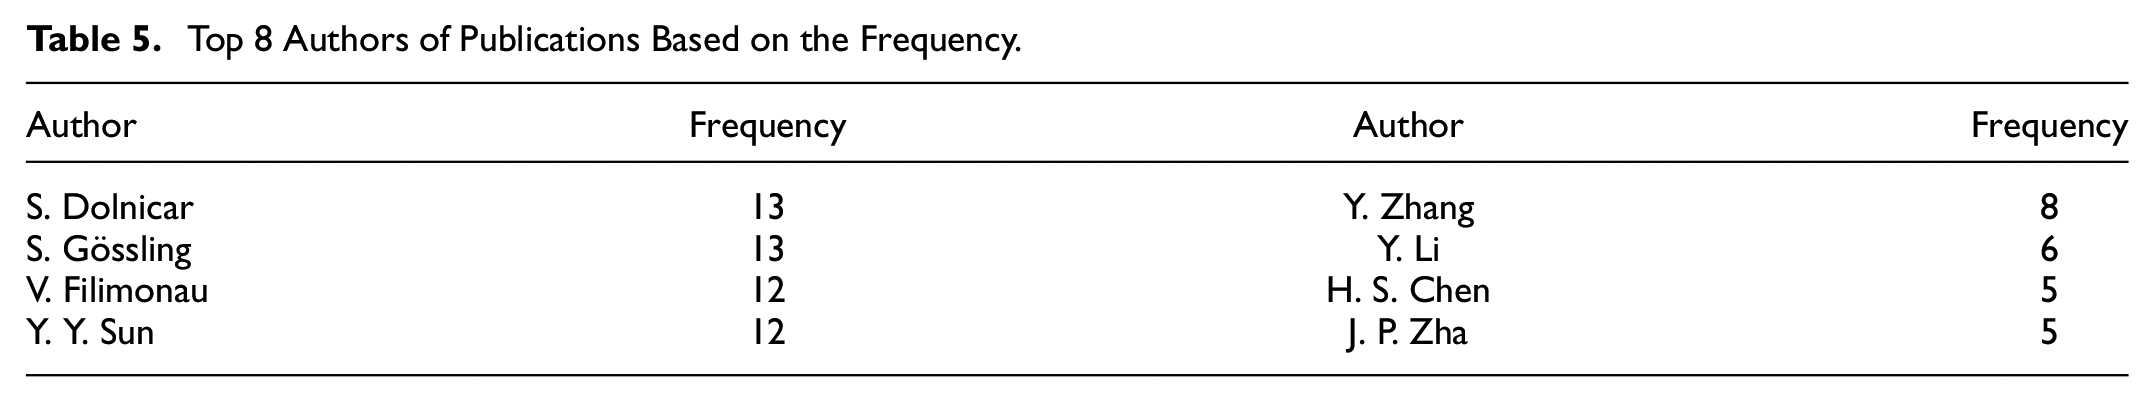
The Chinese Academy of Sciences published the most articles among institutions. And the distance is quite little between the first one and the following universities, such as the University of Queensland and Bournemouth University. These institutions are mainly located in China, Australia, and Sweden (Table 4). S. Dolnicar, S. Gossling, and V. Filimonau are among the most productive prominent authors on this topic, as demonstrated in Table 5.
Ranking of Top 10 Active Institutions Based on the Frequency.

Top 8 Authors of Publications Based on the Frequency.
Developed countries such as the United States and England conduct earlier research in the field of tourism footprint. Their accomplishments in this area have significantly advanced the research on the tourism footprint. The quantity of studies on the tourism footprint has expanded as a result of China’s increasing focus on environmental governance concerns including climate change in recent years as the largest developing country in the world.
Knowledge Sources and Structure Analysis
Journal Knowledge Sources
The scientific fields covered by the literature on tourism footprint are mainly distributed in the fields of environmental sciences (227 articles, 43.91%), green sustainable science technology (161 articles, 31.14%), hospitality leisure sport tourism (130 articles, 25.15%), engineering environmental (124 articles, 23.99%), and engineering environmental (51 articles, 9.87%), according to WOS.
Then to show the relationship between disciplines in tourism footprint research, we conduct a dual-map overlay analysis of the science mapping literature. Figure 6 shows that the knowledge carriers of tourism footprint, which reflect the frontier of the study results, are mostly dispersed in the clusters on the left-hand side, including 6# psychology, education, health, 3# ecology, earth, marine, 10# economics, economic, political, and 7# veterinary, animal, science. And on the right-hand side, there is the information source (most often a referenced journal article), including 12# economics, economic, political, 10# plant, ecology, zoology, 2# environment, toxicology, nutrition, and 3# earth, geology, geophysics. Stronger information flow links between the journals in the cluster are indicated by thicker connecting lines. Through analyzing the tourism footprint journal domain distribution and knowledge flow, we find that tourism footprint research was early developed from the perspective of geography, ecology, and natural sciences. As the study of tourism footprint continues to deepen, it has expanded into the fields of economy, society, policy, and management. Tourism footprint research is a complete study of several fields, with multidisciplinary and diverse features.

Dual-map overlay graph of journals and disciplines regarding the tourism footprint.
On the left-hand side, we discover a few important journals, including Sustainability (127 citing articles; yellow circle), Journal of Cleaner Production (36 citing articles; yellow circle), and Journal of Sustainable Tourism (41 articles; blue circle). Additionally, on the right-hand side, we can see some representative cited journals that are related to the tourism footprint, including Tourism Management (frequency = 1,135; the frequency denotes the number of papers published in this journal on the topic of the tourism footprint), Journal of Cleaner Production (frequency = 908), Journal of Sustainable Tourism (frequency = 845), Ecological Economics (frequency = 678), and Energy Policy (frequency = 395).
Cited Literature Co-occurrence Analysis
Figure 7 displays the temporal evolution of the cited reference, which is represented by the node carrying the information “name of the author and year of publication.” The number of times the article has been co-cited is indicated by the node size; hence, the bigger the node size, the more influential the article is in the field of study.

Time zone view of the cited articles.
Table 6 shows 15 articles with the top node sizes (Figure 7) and high emergence intensity. Then we get the evolution pattern of tourism footprint by analyzing some important articles based on the time zone diagram and the emergent value ranking figure. The ecological footprint, according to Hunter and Shaw (2007), is a crucial metric for determining how environmentally sustainable tourism is. This idea laid an important foundation for the subsequent research on tourism footprint. This article caused the first structural mutation. The tourist carbon footprint has drawn the greatest interest among studies of tourism footprint. Using carbon footprint, some researchers attempt to investigate the connection between tourism development and carbon emissions (Dwyer et al., 2010; Scott et al., 2010). The impact of tourism on the environment not only exists as a direct impact process but also as an indirect impact, which is often overlooked. To assess the current water needs of the industry and to identify current and future management challenges, Gössling et al. (2012) review the direct freshwater consumption of tourism from both a quantitative and qualitative viewpoint. Similarly, Filimonau et al. (2014) are concerned about indirect greenhouse gas emissions from tourism. Juvan and Dolnicar (2014) emphasize the importance of tourists’ access to information on the tourism carbon footprint. Sun (2014) construct a consistent carbon measurement framework to research the connection between travel and carbon emissions. The second stage of the bursting is made up of these articles.
The Top 15 Most Cited Papers with Co-citation Frequency.

Using the environmental Kuznets curve (EKC) as a breakthrough point, some researchers attempt to confirm the connection between the tourist footprint and economic growth (Ozturk et al., 2016; Zaman et al., 2016; Katircioglu et al., 2018). Lenzen et al. (2018) calculated the worldwide carbon fluxes associated with tourism across 160 nations. The direct and indirect emissions are also estimated by Rico et al. (2019). He believes that to minimize CO2 emissions, measures that strategically focus on accommodation and transportation are required. The publication of these results implies that the study of the tourism footprint presents more complex and comprehensive models and more diverse research scales. These articles’ influence continues today.
Article Structure Variation Analysis
The keyword clusters are depicted in Figure 8a with various colors, such as Cluster #0 ecological footprint, Cluster #1 low-carbon tourism, Cluster #2 carbon footprint, Cluster #3 tourism destinations, Cluster #5 environmental indicator, Cluster #8 tourism water footprint, Cluster #9 menu design, Cluster #10 greenhouse gas emissions, Cluster #11 environment. In the illustration, the five-pointed star denotes the turning point, and the dotted line represents the clustering tendency that may occur now or in the future as well as the formation of bridges between clusters.
Juvan’s publication created new dense and complex connections between Cluster #10 greenhouse gas emissions and Cluster#2 carbon footprint (Figure 8b). Unlike some scholars who call for tourism operators to improve energy use efficiency and reduce environmental pollution proactively (Inoue & Lee, 2011), Juvan and Dolnicar (2014) argue that tourists are more effective in reducing their environmental impact by taking the initiative to make environmental decisions. And he believes it is necessary to bridge the gap between tourists and environmentally informed decision-making, and help tourists make decisions about tourism activities that are more environmentally sustainable with carbon calculators. Their study highlights the importance of tourist initiatives in promoting sustainable tourism development, which provides new research ideas for studying sustainable tourism activity planning. As tourists’ environmental awareness increases, they will have a preference for more sustainable and low-carbon tourism product portfolios and tourism options (McKercher et al., 2010; Munday et al., 2013; Susanty et al., 2020).
The publication made by Sun created new dense and complicated links between Cluster #0 ecological footprint, Cluster#1 low-carbon tourism, Cluster#8 tourism water footprint, and Cluster#9 menu design (Figure 8c). Sun (2016) focuses on the dynamic relationship among the economic contribution of tourism, technological innovation, and environmental externalities through empirical analysis, such as the use of environmental extended input-output models and quantile autoregressive distribution lag (QARDL) models. Sun analyzes the relationship between tourism and eco-innovation utilizing the ecological footprint within the context of the environmental Kuznets curve (EKC) in addition to proposing an analytical methodology for dissecting the carbon footprint and carbon efficiency of national tourism. By combining innovation with tourism, Sun’s study offers fresh perspectives for empirical assessments of the tourist footprint and aids policymakers in striking a balance between growth and pollution.

Keyword clusters of cited articles (a); novel co-citations made by Juvan (b); and Sun (c).
Analysis of Hotspots and Trend
The top 10 keywords include impact, footprint, tourism, management, climate change, ecological footprint, carbon footprint, consumption, energy consumption, and sustainability. Figure 9 shows the keywords cluster analysis on citing documents under the “timeline view.” Horizontally, the time span is from 1997 to 2022. At present, Cluster #0 life cycle assessment, Cluster #1 adaptive management, and Cluster #2 economic growth still have a high co-citation rate, indicating that these fields still maintain a high degree of research enthusiasm. Figure 9 shows that the network linked by these keywords has a large time span and a complex structure which indicates the diversity of perspectives and research content of the tourism footprint. Based on the frequency of keywords and the timeline graph, we analyze the hot issues of tourism footprint in the following three aspects.

Timeline map of research hotspots.
Economic Impacts of Tourism Development
Tourism is a rising industry that contributes significantly to economic growth (Wright, 2023). The development of the tourism industry may still cause substantial issues in environmental sustainability (Khatib, 2023). Therefore, it is critical to assess both the environmental and economic implications of tourism. Cluster #2 economic growth contains keywords such as EKC and ecological footprint (EF). We find that the EKC and EF are important tools for analyzing the environmental impacts of tourism (Katircioglu et al., 2018). Some scholars believe that the Environmental Kuznets Curve is not present for the relationship between tourism footprint and tourism development (Mikayilov et al., 2019), while others hold an opposing view (Ozturk et al., 2016; Okumus & Erdogan, 2021). Some scholars think that tourism increases economic revenue while leading to environmental pollution and a tourism footprint deficit (Solarin, 2013; Katircioglu et al., 2014; Roumiani et al., 2023). However, other studies think that the damage that tourism does to the ecosystem may be reduced (Buckley, 2009). For example, reforming air travel legislation and upgrading public transportation technology can cut energy usage and carbon emissions (Sherafatian-Jahromi et al., 2017; Khatib, 2023; Gössling & Humpe, 2023).
The Assessment of Tourism Footprint
Cluster #0 life cycle assessment and Cluster #5 input-output show the two main accounting approaches, including Life Cycle Assessment (LCA) and Input-output Analysis (IOA). Life Cycle Assessment (the bottom-up method) evaluates the composition of resource consumption in a certain spatial and temporal range by transcribing the inventory (Omolayo et al., 2021). Some scholars use LCA to account for hotel computable general equilibrium emissions (Filimonau et al., 2011), evaluate the carbon implications of tourist travel induced by transportation (Pereira et al., 2017), and measure the environmental sustainability of holiday farms (Cerutti et al., 2016). They think that this method can give a more thorough account of how tourism affects the environment, which may help identify opportunities for improvement and action (Pereira et al., 2017). But other scholars contend that the LCA has several flaws, including its high cost (Heidrich & Tiwary, 2013; Zhou et al., 2015). Some scholars proposed an alternative method, that is, input-output analysis. IOA (the top-down method) calculates the tourism footprint through an input-output table. Some researchers utilize input-output models to calculate the water and carbon footprints of tourism activities (Sun & Pratt, 2014; Lee et al., 2021; Sun & Drakeman, 2021), mostly from the scale of countries. These two approaches are applicable in accounting for the carbon footprint, water footprint, and ecological footprint of tourism. They are also widely used in the tourism footprint measurement of different scales such as regions, cities, and specific attractions (Luo et al., 2020; Katircioglu et al., 2018).
The Promotion of Sustainable Tourism
Local resources are being overused as a result of the tourism industry’s rapid growth. Furthermore, the deterioration of the destination’s environment has resulted in a loss of competitiveness and appeal (Krajickova et al., 2022). How to promote sustainable tourism development has sparked extensive discussions in the international community (Vargas-Sánchez, 2018; Nocca et al., 2023). Tourism footprint is an essential approach to investigating the environmental sustainability of tourism (Schianetz et al., 2007). Using the tourist footprint to chart the path toward sustainable tourism is an intriguing avenue for future study. A key expression of sustainable tourism is the decrease of the tourism footprint. As a result, a tourism footprint study is utilized to determine which components hinder the development of sustainable tourism (Okumus & Erdogan, 2021). And then we can explore the countermeasures to solve the problem. Lin et al. (2018) argue that reducing the tourism footprint requires considering the various components of the footprint reduction and building a resource-efficient consumption model. For example, increasing the energy efficiency of transportation, accommodation, and other tourism activities, or alter the way tourism can reduce environmental effects (Fermani et al., 2020; He et al., 2020). At the same time, urban tourism must conduct management according to city type (Shi et al., 2020). Cities with a higher EF per capita, for example, could optimize their urban ecology by utilizing modern industrial structures and rapidly developing service industries. Furthermore, tourist environmental awareness is crucial for sustainable tourism (Buckley, 2012; Nocca et al., 2023; Palli et al., 2023).
Discussion
Top Research Contributions
Based on 517 papers obtained from the WOS database, we answer the first question (Q1) by analyzing the number of papers on the topic of tourism footprint, the number of journal publications, and the social network of authors, countries, and institutions. We find that the publications on tourism footprint have grown exponentially in recent years. And the research in this field is mainly dominated by China, the United States, Australia, and England, which have the most authors and institutions. Representative authors include S. Dolnicar and Y. Y. Sun from the University of Queensland, S. Gössling from Linnaeus University, and Y. Zhang from the Chinese Academy of Sciences, who have contributed significantly to the study of tourism footprint. And we find that the color of the cooperation network started to shift to warm tones and thicker connecting lines, implying closer cooperation across institutions and countries. In the future, cooperation among stronger institutions should be strengthened to exchange theoretical frontiers and promote the development of tourism footprint research.
Primary Knowledge Sources and Structure
Through journal dual-map overlay analysis cited literature co-occurrence analysis, and structural variation analysis, we answer the Q2, namely, the basic knowledge sources and structure of tourism footprints. We find that the tourism footprint has become a cross-pollinated research subject in numerous domains, including economics, geography, and other relevant content. Follow-up studies should strengthen both the depth of research and the breadth of research by adopting a multidisciplinary and multi-perspective approach. Then we discuss some important publications on the topic. The changing phases of these publications can reflect the changing research scope, research themes, and research methods in the field of tourism footprint. Representative publications include the studies from Hunter and Shaw (2007), Gössling et al. (2012), and Lenzen et al. (2018). In the analysis of structural variation, we find that the research results represented by Juvan and Sun focused on the role of tourists’ autonomous behavior, activity decisions, and innovative activities in the tourism footprint, respectively. These concerns may have unexpected potential for future development.
Major Topic Areas
Through keyword cluster analysis, we answer the Q3. The connection between environmental impact and tourism development, measuring the tourism footprint, and promoting sustainable tourism are some of the research hotspots in this area. We find that the growth of tourism provides large economic advantages, even while the negative consequences on the environment are getting more attention. The quantitative assessment of the tourism environmental effects is different from traditional industries (e.g., manufacturing). For example, the environmental effects of manufacturing can be assessed through the processes of production, consumption, and trade. Tourism can be assessed both through the whole process and also has some special characteristics. For example, the conservation of sites developed by attractions is also part of environmental sustainability; the assessment of tourism footprint is mainly carried out in terms of consumers’ consumption behavior. The tourism footprint discussed in this paper is a synthesis of a category of studies that encompasses the environmental impacts that accompany tourism behavior such as water footprint, carbon footprint, and nitrogen footprint. LCA and IOA are the main measurement methods. By measuring the environmental impact of tourism, we can both lessen its negative effects on the environment and increase its economic benefit. A tendency in the development of tourism is unavoidably toward sustainable tourism. There are some key ways to develop sustainable tourism, including raising consumers’ awareness of environmental protection and making them choose greener and more environmentally friendly ways to travel while encouraging the various companies in the industry chain to continuously increase their green products and services.
Future Research Directions
The analysis of literature through knowledge mapping provides insight into the current research state as well as trends in the field of tourism footprint. To combat environmental degradation and global climate change, it is crucial to improve tourism’s economic contribution while also strengthening the sustainable development of tourism. As a result, measuring tourism footprint to analyze tourism’s environmental sustainability level is the necessary basis. Some studies on tourism footprints can be undertaken in the future. For example, to lessen the damaging effects of tourism development on the environment throughout the process, we can develop a consensus model for tourism footprint accounting. Exploring tourism footprint accounting models at different scales such as countries and cities, which include various types of resource consumption and environmental impacts, can make it easy to compare the sustainable development of the tourism industry. Following the measurement of the tourism footprint, monitoring changes in the footprint is crucial. Therefore, we believe that future research should strive to explore methods that allow for long-term tourism footprint monitoring and establish a dynamic tourism footprint monitoring mechanism that can continuously optimize tourism development. This is very meaningful to promote sustainable tourism.
At the same time, the emergence of the COVID-19 epidemic leads to a change in the focus and direction of research on tourism footprints (Osorio et al., 2023). With the impact of the epidemic, people’s travel patterns and needs have changed. We will no longer focus on the tourism footprint in the traditional sense but will need to consider the sustainability of the tourism industry in the context of changing travel patterns and business models. First, domestic travel is likely the starting point for the industry recovery in most tourist cities. As people stop making distant travel plans and look for flights closer to the present, airline, and hotel operations will need to adjust accordingly. At the same time businesses, as well as local policies, need to work together to promote domestic tourism and make it more attractive. The main players, such as airlines and hotels, need to be more flexible and consider the environmental impact of tourism while taking into account the economic recovery. Furthermore, with the rapid development of the internet, it is necessary to expand the members of the tourism footprint, such as the tourism digital footprint (Yu et al., 2023). Currently, new technologies such as artificial intelligence, big data, cloud computing, 5G, AR, and VR are being deeply integrated with tourism. Virtual tourism, cloud exhibitions, and other non-contact tourism services can reduce operating costs, improve the tourism experience, enhance the ability to provide quality services and respond flexibly to emergencies. This is because one of the major advantages of digital platforms is the ability to integrate tourism, cultural, restaurant, retail, and agricultural industrial resources to create a digital service position for sustainable operations. Therefore, the study of tourism digital footprints is not only an important direction for future research, but also an inevitable trend to actively respond to the changing epidemic and the call for sustainable tourism.
Conclusion and Limitations
We select 517 papers from WOS and conduct a visualization analysis of the tourism footprint with CiteSpace. This study provides a visual analysis of collaboration networks, knowledge structures, knowledge sources, and hotspot changes, which is more advantageous than previous reviews. It can effectively help interested and related researchers in the field to swiftly comprehend and grasp the current status of tourism footprint research. Specifically, it helps scholars to track the frontier of the research field and provide a collaborative reference; meanwhile, it helps scholars to deeply understand the knowledge evolution pattern of tourism footprint and serves as a guide for future research methods.
This study is exploratory and not without its limitations. On the one hand, because of the functional properties of the software, only literature from the WOS database can be analyzed econometrically at this time. WOS is also a representative database, and a thematic analysis of literature from this database is persuasive. On the other hand, since the type of documents obtained from WOS is “article” (published in peer-reviewed journals) and CiteSpace can only perform co-citation analysis on “article,” the analysis of knowledge bases and classic documents omits significant achievements in books. In addition, frequency is the basis for co-citation analysis. Although the latest publications have major changes in this field, may not be presented in classic literature due to the low frequency of co-citations and emerging value.
Footnotes
Declaration of Conflicting Interests
The author(s) declared no potential conflicts of interest with respect to the research, authorship, and/or publication of this article.
Funding
The author(s) disclosed receipt of the following financial support for the research, authorship, and/or publication of this article: The authors declare that fund support was received from the Fundamental Research Funds for the Central Universities of Chongqing University (2018CDYJSY0055, 2022CDJSKJC26, 2021CDSKXYGG013).
Ethical Approval
Not applicable.
Consent to Participate
Not applicable.
Consent to Publish
Not applicable.