
Abstract
Surveys are typical for student evaluation of teaching (SET). Survey research consistently confirms the negative impacts of careless responses on research validity, including low data quality and invalid research inferences. SET literature seldom addresses if careless responses are present and how to improve. To improve evaluation practices and validity, the current study proposed a three-step procedure to screen SET data for quantifying careless responses, delete and justify the removal of careless responses, and assess if removing careless responses improved the internal structure of the SET data. For these purposes, a convenience sample was taken from a Chinese university. A web-based survey was administered using a revised version of the Students’ Evaluation of Education Quality. One hundred ninety-nine students evaluated 11 courses with 295 responses. Longstring and Rasch outlier analyses identified 49% of nonrandom and random careless responses. The careless responses impacted evaluation results substantively and were deleted. The subsequent study demonstrated that removal improved data validity, using reliability, separation, and inter-rater agreement from the multi-facet Rasch model and G- and D-coefficients, signal-noise ratios, and error variance from generalizability theory. Removing careless responses improved the data validity in terms of true score variance and discrimination power of the data. Data screening should be a prerequisite to validating SET data based on the research results. Data removal is necessary to improve the research validity only if there is a noticeable change in the estimated teaching abilities. Suggestions and implications were discussed, including developing sound evaluation practices and formative use of SET.
Plain Language Summary
Student evaluation of teaching (SET) exists everywhere in education. However, people question whether they trust SET data and feedback. The survey is popular in SET. Literature has consistently reported the survey participants’ careless response (CR). CRs mean that participants complete a survey without enough attention to instructions and the content of the survey items. There are two types of CRs—non-random or random. Random CR means that participants choose the options randomly. Nonrandom CR occurs if respondents consistently select the same options. When CRs are present, people question data quality and research inferences. Researchers can take preventive measures during survey development and/or administration to address the CR issue. Some scholars recommend deleting CRs. The current research proposed a three-step procedure to (1) identify CRs and remove them, (2) prove that removing CRs was correct, and (3) evaluate whether removing CRs improved the SET data quality. For these purposes, two types of analyses were performed to identify the CRs. The analyses detected 49% of CRs in the dataset. 54.4% of the teachers’ abilities were misclassified. Thus, CRs impacted the evaluation practically. The evaluation criteria demonstrated that CR removal improved data quality. Based on the results, the evaluators should take necessary measures, including prevention measures during survey development and administration and checking data quality. Deleting CRs should be based on careful research ONLY IF many teachers’ abilities were misclassified. It is also important to use a set of criteria to ensure that data quality improves after deleting CRs. The proposed evaluation criteria can be applied to different evaluation settings.
Keywords
Introduction
Despite the importance of student evaluation of teaching (SET), there is a debate around its validity (e.g., Spooren et al., 2013). Validity is the extent to which empirical evidence and theory support or refute the intended use of the results. SET literature has either supported or disputed its validity. For example, some research has confirmed the validity of SET (Marsh, 1987). Other research has also demonstrated various sources of invalidity of SET survey data, including bias (i.e., the deviation from the truth), the halo effect (i.e., the tendency to assign similar ratings), and other factors unrelated to teaching (e.g., Stoesz et al., 2022). Evaluation survey data validity impacts evaluation feedback’s utility (i.e., usefulness). The existing research documented that some teachers found SET feedback useless (Spooren et al., 2013). Therefore, examining and exploring approaches to quantifying and improving the SET data validity is of practical importance.
Similarly, survey researchers have been plagued by data invalidity. Survey data validity issues arise from careless responses (CRs) (Hong et al., 2020; Niessen et al., 2016; Palaniappan & Kum, 2019; Ward & Meade, 2023). CRs refer to patterns where respondents complete a survey without sufficient attention to instructions and the content of the survey items (Huang, Curran, et al., 2012; Huang, Liu, & Bowling, 2015). CRs compromise data quality and threaten research validity (Curran, 2016; Huang et al., 2015). Scholars recommended identifying and deleting careless responses to improve data quality and ensure valid inference (Goldammer et al., 2020; Huang et al., 2012).
To date, limited survey research has been done to identify careless responses (Goldammer et al., 2020; Kam, 2019). In SET research where the survey prevails, literature searches only identified a limited number of articles addressing the phenomena of the halo effect and bias (e.g., Marder et al., 2021; Valencia, 2019). Hardly has any research gone further to investigate the careless rating behaviors behind the phenomena. Therefore, the purpose of the current research was to propose a three-step analytical procedure to quantify CRs in SET surveys, verify the necessity of CR removal, and assess if deleting careless responses improved data validity. Data validity in the current research refers to internal structure validity. More specifically, we first quantified CRs using two data screening techniques. Next, we compared the results with and without data removal and deleted CRs because CRs impacted evaluation results substantially. Last, a set of evaluation criteria was proposed to investigate if CR removal improved internal structure validity using reliability, true score variance, and error variance obtained with generalizability theory (GT, Brennan, 2001a) and multi-facet Rasch modeling (MFRM, Linacre, 1994a). Specific questions included:
Q1:What was the amount of CRs in the current SET research? This aimed to identify and quantify CRs in the SET survey.
Q2:Was removing CRs justified? This evaluated the necessity of eliminating CRs by assessing their impact on ratees’/teachers’ performance.
Q3:Could CR removal improve the internal data structure? This assessed if removing CR improved data validity with a set of evaluation criteria.
For these questions, a convenience sample was taken from a regular Chinese university, and a web-based questionnaire was administered to two groups of students.
Literature Review
SET is ubiquitous in higher education. It increases student participation and provides valuable feedback for instructional improvement and educational quality assurance. Universities may use it for faculty promotion, tenure decisions, and institutional policies. It serves as a key performance indicator of institutional effectiveness and teaching quality. The survey is typical in SET. The utility of SET rests on the assumption that the data collected from the surveys are accurate. However, SET validity has been controversial (e.g., Bassett et al., 2017; Spooren et al., 2013; Valencia, 2019). CR is the potential source of SET invalidity. Thus, it is critical to examine SET validity by studying and quantifying the prevalence of CRs in SET surveys. Next, the necessary measures must be taken to solve the issue. For these purposes, it is essential to address validity with its related concepts and CRs with the impacts.
Validity
To examine SET validity, we must first define validity and conceptually discuss the related sources of validity.
Validity Definition and Sources of Validity
American Educational Research Association (AERA) et al. (2014) define validity as “the degree to which evidence and theory support the interpretations of test scores for the proposed uses of the test (p. 11).” In education, assessments require evidence of validity for the scores to be interpreted meaningfully. AERA et al. (2014) point out five sources of validity in assessment: content validity, internal structure, response processes, relation to external variables, and consequences. Validity is a unitary concept, and sources of validity are different aspects complementing each other. The following paragraphs only discuss the validity sources relevant to the current study.
Response Process
It is the evidence of data validity with instrument administration and data collection process, in which various sources of errors should be controlled or eliminated to the maximum degree (Downing, 2003). For a survey, it is the extent to which the respondents adhere to and interpret the survey instructions and items and react to the instrument during the survey administration. Various factors may impact the attitudes and behaviors of the survey participants, including survey design, cognitive loads and complexity of the survey items, the interest in the research topic and the participants’ motivation, and environmental factors. With the complementary nature of different sources of validity, response process validity impacts other sources, including internal structure and content validity.
Internal Structure
It indicates “the degree to which the relationships among test items and test components conform to the construct on which the proposed test score interpretations are built (AERA et al., 2014, p. 16).” The critical internal structure validity evidence includes but is not limited to inter-item correlation, reliability, error, generalizability study analysis of the assessment, bias analysis (such as differential item functioning, DIF), factor analysis, structural equation modeling, etc. The response process and internal structure are two different validity sources. With a well-designed survey, researchers collect quality data if the respondents pay attention and behave carefully. Data will be distorted if the participants behave abnormally, compromising the internal structure of the data and jeopardizing the research inferences.
Careless Responses in Surveys, Their Impacts and Remedies
Careless Responses in Surveys
The validity of survey research depends on how honestly respondents react to survey items. Research has consistently documented the CRs of survey participants. CR occurs when participants lack motivation or fail to comply with survey instructions (Huang, Curran, et al., 2012; Huang, Liu, & Bowling, 2015). CR can be random or non-random. Random CR happens when respondents choose the options randomly (Curran, 2016). Nonrandom CR, also known as the straight-lining or halo effect, denotes respondents’ behavior of selecting the same options in a highly consistent manner (Hong et al., 2020). In their research, Meade and Craig (2012) detected 10% to 12% CR rates. Hong et al. (2020) summarized that CR accounted for 2% to 50% of the responses in survey research. Some researchers detected that survey participants were engaged in at least one type of CR behavior (Barge & Gehlbach, 2012). Research verified the existence of CR in web-based surveys (Johnson, 2005; Niessen et al., 2016; Ward et al., 2017). Electronic surveys (such as computer-based and web-based surveys) are increasing with SET. Thus, quantifying CRs and improving data validity in electronic surveys is crucial, especially when the research rests on web-based surveys to collect SET data.
Impacts of Careless Responses on Data Bias and Validity
CR poses a data validity issue (Curran, 2016; Niessen et al., 2016). CR occurs during the survey administration, impacting data quality and internal structure validity. CRs contribute to data bias (Goldammer et al., 2020; Palaniappan & Kum, 2019; Ward et al., 2017). Random CR decreases inter-item correlations, and nonrandom CR increases these correlations (DeSimone et al., 2018). CR inflates item variances, deviates item means toward midpoints, and reduces within-group agreement on consensus-based constructs (Goldammer et al., 2020). As a result, CR inflates Type I error rates (Huang et al., 2015; Osborne & Blanchard, 2011). CR can also distort factor loading patterns, threatening the underlying construct validity (Kam, 2019). Its effects range from introducing error to influencing psychometric properties and distorting statistical inferences and research conclusions (DeSimone et al., 2018).
Remedies for Careless Responses
The current practices to solve the CR issue include three different approaches, namely, (1) prevention measures during the survey design or administration, (2) data screening and deleting CRs after data collection, and (3) the combination of the two approaches mentioned above.
Several strategies have been proposed to prevent careless responses. Huang et al. (2012) detected that warnings significantly reduced CRs. A quality check item in the survey, which instructed the respondents explicitly to select a specific option for the item, was proven to be effective in reducing CRs (Reyes, 2022). Francavilla et al. (2019) tested three different levels of proctoring (remote online un-proctoring, remote online virtual proctoring, and in-person classroom proctoring). In-person proctoring performed the best in reducing CR. Ward and Meade (2018) found that signing initials next to statements indicating that they understood what it meant to complete the survey carefully increased participants’ efforts to respond consistently. The most effective strategy to prevent CRs is ensuring respondents know they are being monitored (Ward & Meade, 2023).
However, prevention may only partially solve the issue. Sometimes, prevention measures during the survey design or administration are neither implemented nor feasible. Under these circumstances, there is another viable option, which is deleting the CRs because careless respondents provide invalid data. Osborne and Blanchard (2011) removed careless responses, and the intervention effect became significant. Arias et al. (2020) deleted CR, and their theoretical models exhibited improved fit indexes. Screening and removing CR enhanced data quality and reduced bias (DeSimone & Harms, 2018; Zijlstra et al., 2011). Figure 1 shows the benefits of prevention and CR identification. Some scholars have pointed out that CR identification is rare (Goldammer et al., 2020; Huang et al., 2012; Kam, 2019). Furthermore, it is rare or possibly absent in SET literature to identify CRs, examine their impact, remove them, justify the removal, and assess the improvement in data validity because a literature search has not identified any research in this direction.
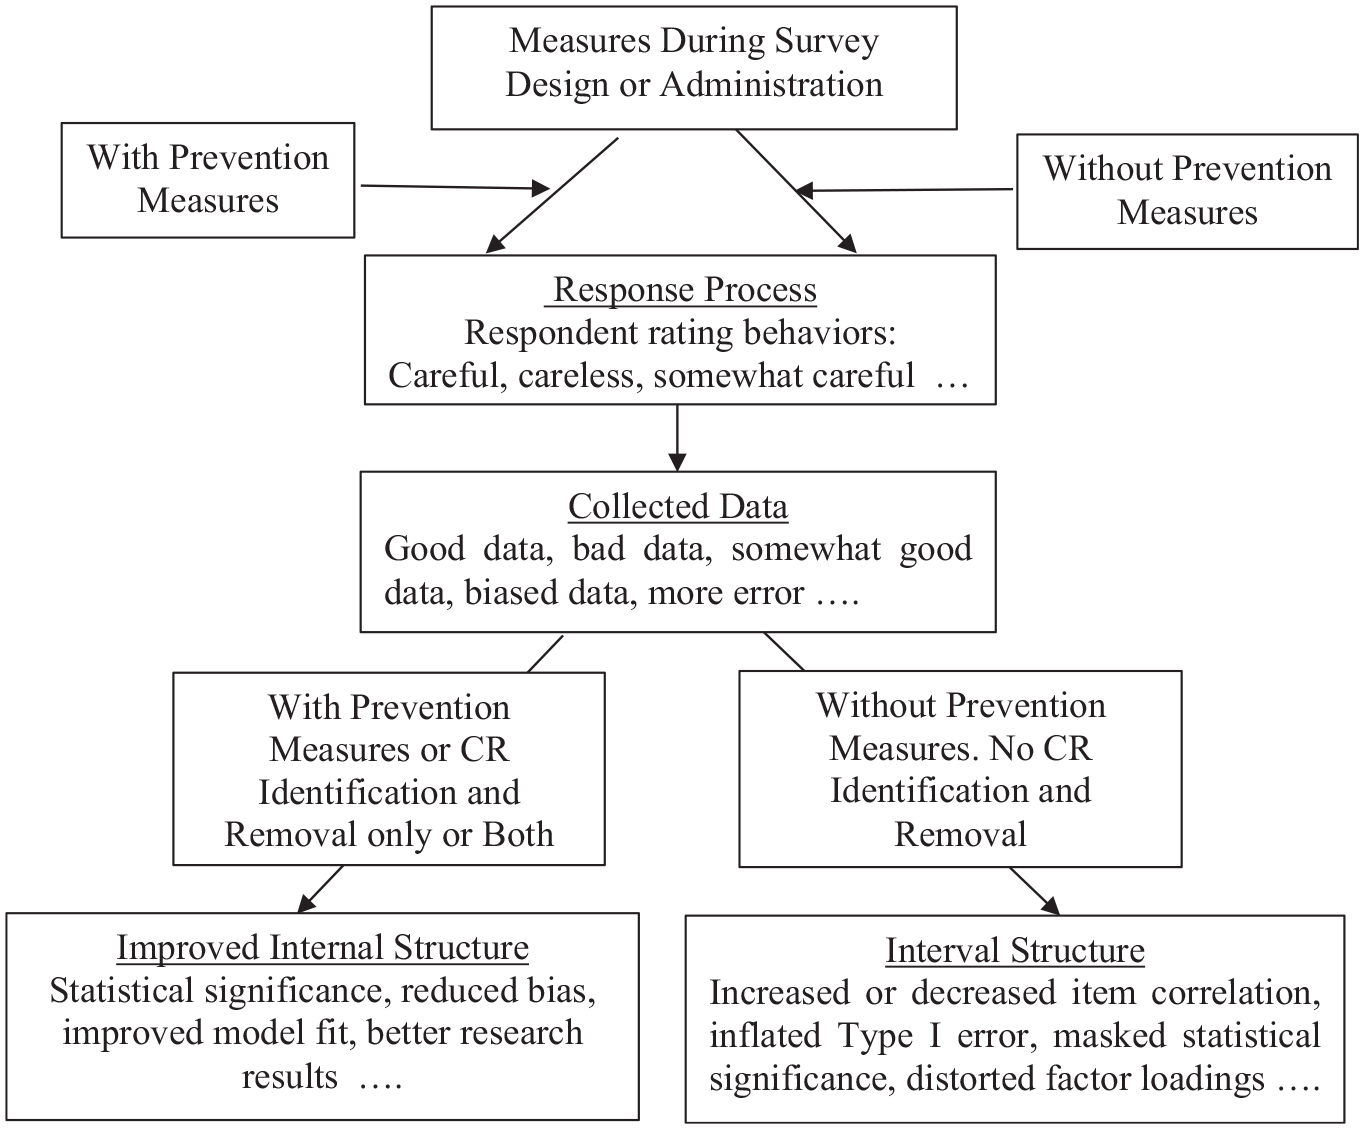
Connection between prevention, CR removal, and internal structure.
Careless Responses in SET and Their Impacts
Careless Responses in SET
Surveys are typical instruments in SET research. Genetically, it carries the characteristics of surveys, including the respondents’ careless behaviors during the response process. In SET, it is common for students to exhibit the halo effect, which is defined as the respondents’ inability to differentiate among distinct traits and the tendency to assign similar ratings (Myford & Wolfe, 2004). Conceptually, it is the same as non-random CR or straight-lining.
Research has consistently confirmed the presence of the halo effect or non-random CR behaviors in SET (Feeley, 2002; Spooren et al., 2012). The halo effect also manifests as acquiescence responses, where students tend to give higher ratings (Marder et al., 2021; Spooren et al., 2013; Valencia, 2019). However, the degree of halo effect varies. One study verified the halo effect in their sample but concluded that it was not a concern (Cannon & Cipriani, 2022). Clayson (2018) reported that Krippendorff’s alpha, a measure of inter-rater consistency, decreased as the item consistency increased. The decrease in Krippendorff’s alpha suggested the response randomness.
Impacts of Careless Responses in SET on Data Bias, Validity, and Faculty
Bias in SET is conceptualized to occur “when a student, teacher, or course characteristic affects the evaluations made, either positively or negatively, but is unrelated to any criteria of good teaching, such as increased student learning” (Centra, 2003, p. 498). Research has consistently detected biases in SET. For instance, Stoesz et al. (2022) systematically reviewed the articles published between 2012 and 2021 and concluded that biases existed against female and minority faculty. Feistauer and Richter (2018) reported that the effect of likability and prior subject interest exerted significant bias on student evaluation. Self-serving and cultural biases also existed (Arnold, 2009; Arnold & Versluis, 2019). Only very few studies linked SET bias to students’ lack of motivation during survey administration (e.g., Spooren et al., 2013; Valencia, 2019).
In addition to bias, many SET researchers have concentrated on the impact of SET on criterion validity (i.e., the relation with some criterion variable in the present) or predictive validity (i.e., the relation with some measure in the future) and faculty. One meta-analysis reported no significant relation between SET and student learning (Uttl et al., 2017), suggesting SET invalidity. Even careful and judicious use of SET failed to identify the best instructors (Esarey & Valdes, 2020). Studies revealed the existence of negative comments (including abusive language) in SET (Heffernan, 2022; Sabagh et al., 2018). Faculty suffered from burnout with SET (Sabagh et al., 2018). The consequences of job burnout include occupational injury, problematic alcohol use, suicide risk, career regret, and sub-optimal professional development (National Academies of Sciences, Engineering and Medicine, 2019). The consensus is that SET, as the primary measure of teaching quality, can systematically disadvantage some faculty members (American Sociological Association, 2019). Very few SET researchers recommended performing the data quality check and removing CR (e.g., Bassett et al., 2017; Valencia, 2019). However, it is rare to identify any SET research examining the impact of CRs and improving data quality as survey researchers in other areas have done—the current study filled this gap.
Research Focus and Significance
Following the trend in survey research to improve data quality, this study proposed a three-step analytical approach to address CR issues in SET after data collection. The approach identified CR first, evaluated the impact of CRs, and assessed if it was necessary to remove CRs. With the importance of data quality, it was essential to investigate and quantify the CRs and determine if removing CRs was justified. Lastly, evaluating if CR removal improved data validity was equally important. Some survey research resorted to simulation to evaluate (Hong et al., 2020; Niessen et al., 2016). Others compared the statistical results before and after removing CRs (e.g., Kam, 2019; Osborne & Blanchard, 2011). In addition to comparing the results before and after CRs, the current research proposed a set of statistical indexes to assess if CR removal improved data validity.
The significance of the study was tri-fold. First, if CRs were detected in the current research, it suggests that, based on the survey and SET literature, the phenomenon might exist in SET data in different settings. Practitioners need to detect CRs in the SET with the varying severity of CRs in other samples. Secondly, if CRs were detected in the current research, evaluators must take necessary measures to improve data quality in the real world. Data removal is one of the options. Thirdly, if data removal was justified in the current study, a set of evaluation indices is necessary to assess whether removal improves the data quality. The set of suggested evaluation statistics in the current study would be helpful for evaluators in the real world.
Research Methodology
The ultimate goal of the current research was to examine CRs and improve SET validity. For this goal, the study adopted the following design and research methods.
Research Design and Sample
An institutional grant funded the study; IRB approval was embedded. A convenience sample was taken from a regular application-oriented university in eastern China. One hundred ninety-nine students evaluated 11 faculty members with 295 responses. The first group comprised 78 students from the science and engineering (S&E) school. They evaluated six courses with 174 responses. The school chose which courses to assess. The online questionnaire was distributed to the participants by students. The second group of 121 students at one humanities school evaluated five courses. The students selected which courses to evaluate. The researcher (the author of this manuscript) instructed students before forwarding them the online survey. Due to intermittent schooling during the pandemic, 67 students (55.4%) in the second group filled in the survey in the classroom, and 54 students (44.6%) were remotely contacted via QQ (a Chinese social media platform). The survey’s beginning emphasized the instrument’s intended purpose and use. Participation was voluntary for both groups.
Instrument
We revised the Students’ Evaluation of Educational Quality (SEEQ) from the University of California (Marsh, 1982, 1987; Marsh & Hocevar, 1991). SEEQ has been implemented to measure different teaching aspects. Research confirmed nine instrument dimensions/traits—passion, knowledge, interaction, organization, rapport, breadth of teaching, grading, workload, and homework (Marsh et al., 2009). Over 30 published articles have demonstrated SEEQ’s validity and reliability (Marsh & Hocevar, 1991). After consulting evaluators at the university, we determined that teacher expectations were more appropriate to assess than passion because of their essential role in student learning and degree completion (e.g., Boser et al., 2014; Trusz, 2018; Wang et al., 2018). The questionnaire comprised 40 teaching evaluation items. It also included 24 items for personal information, including gender, grade, major, educational expectations, and time management. This study utilized 40 evaluation items.
The questionnaire was distributed among university faculty and evaluators for feedback and revised accordingly. For example, the answer options changed from “Very Poor,”“Poor,”“Ordinary,”“Good,” and “Excellent” to numerical options (1 indicating “Strongly Disagree” to 5 demonstrating “Strongly Agree”). The revised questionnaire was then pilot-tested on a convenience sample of 20 students, who provided more input for improvement. For example, “Instructor was adequately accessible to students during office hours or after class” was changed to “Instructor was accessible to students in and after class.” After the pilot test, the questionnaire was administered on WenJunXing (a Chinese survey website). Both groups were followed up.
Analytical Procedures
Figure 2 presents the flowchart for analytical procedures, comparing the conventional and data screening approaches. The Multifacet Rasch model (MFRM, Linacre, 1994a), a model of the Rasch family, was chosen because of its advantages. Specifically,

where
c = counting index ranging from 0 to k,
K = the maximum rating scale category,
h = a counting index ranging from 0 to K, and
F 0 ≡ 0.

Comparison of Flowcharts for Analytical Procedures. Figure 2(a) at the top presents the conventional approach. Figure 2(b) at the bottom presents the data screening approach.
It was an appropriate model to study rating behaviors and can accommodate several dimensions or traits. All traits are analyzed simultaneously but independently, and the results are presented on a single linear scale (i.e., the logit scale), which was teaching ability in the current study, with higher scores indicating higher levels of teaching effectiveness. Researchers can simultaneously investigate all relevant factors, including random rating behaviors, rating bias, raters’ severity, inter-rater agreement, and ratee (i.e., teachers in our study) performance. The Rasch model is robust with small sample sizes (e.g., Lunz, 2010; Wright & Stone, 1979). Another advantage is that cut-off criteria exist with the Rasch model if researchers remove items or persons, which is not true with many CR detection techniques. To run MFRM, the design should be connected, that is, at least one rater rates all the ratees. In the case of disconnected design, the MFRM program offers the option of anchoring the related facet(s)/trait(s). The details of the anchoring are elaborated by Linacre (2012).
As an extension of classical test theory and ANOVA, GT can estimate multiple sources (also known as facets or dimensions) of measurement error and compute reliability indices. Generally speaking, GT estimates the proportion of total score variance explained by true score variance. In GT, the universe score, the expected score across all measurement conditions, is analogous to the true score in classical test theory. A generalizability study (G-study) identifies various sources of error and the set of all facets known as the universe of admissible observations. The G-study estimates the magnitudes of potential sources of variances in the universe of admissible observations. It produces relative error variance and a generalizability coefficient (G-coefficient) appropriate for relative decisions, such as rank-ordering the ratees’ observed scores. A decision study (D-study) specifies a universe of generalization to which a decision-maker wants to generalize based on the results of a particular measurement procedure. It yields absolute error variance and dependability coefficient (D-coefficient) appropriate for absolute decisions, such as rank ordering the ratees according to criteria. GT was chosen to compare the improvement in data validity due to its capacity to compute true score variance and error variance. To our knowledge, no research has been undertaken to evaluate if removing CR improves data validity using GT.
Conventional Approach to Data Analysis
Figure 2a shows the steps for the conventional approach.
Data collapsing. The number of response options was reduced from 5 to 4 to ensure enough responses for each scale option. Linacre (1994b) suggested a minimum of 10 respondents per option for item and person parameter estimation precision within +1 logit confidence intervals.
Item and dimensionality analyses. Item-total correlation analysis was performed to remove items with negative correlations, and principal component analysis (PCA) was then conducted. On the dataset from step 1, “Course speed” produced a negative item-total correlation and was deleted. PCA on the dataset with 39 items produced a first eigenvalue of 27.80, explaining 69.50% of the total variance, and a second eigenvalue of 1.63 (explaining 4.07% of the total variance). When the uni-dimensionality assumption is met, the first eigenvalue should be larger and account for a larger proportion of total variance than the second eigenvalue. PCA analysis is necessary to confirm the unidimensionality of the data, which is the essential assumption for the Rasch model.
MFRM analyses. The FACETS program (Linacre, 2020) was run on the dataset with 39 items from step 2 for item quality analysis. Using infit and outfit Zstd (i.e., standardized) >|3.0| as cut-offs, some items exhibited misfits. For the Rasch model, infit and outfit Zstd >|3.0| are the cutoffs for a sample size of less than 300 (Linacre, personal communication, March 09, 2022). Following the recommended procedures by Linacre (2010), we removed them one by one, and the scatterplots yielded no noticeable changes in the ability estimates of the teachers. Therefore, the misfit items were kept. Teaching effectiveness was estimated using the MFRM.
Generalizability theory analysis was conducted. Please refer to the “Data Validity Improvement Evaluation” section.
Data Screening Approach to Data Analysis
The analytical procedure for the data screening approach was the same as the conventional approach, except that additional steps (i.e., steps 1 to 3) were added, as shown in Figure 2b. These extra steps included (1) quantifying and removing CR, (2) justifying CR removal, and (3) improvement evaluation.
Quantifying and Removing CR (Step 1)
Curran (2016) and Hong et al. (2020) have proposed applying at least two detection techniques; thus, we adopted two techniques, one for random and one for nonrandom CR detection—long-string analysis and Rasch outlier analysis (Figure 2b).
Long-string analysis for nonrandom CR. Non-random CR are consistent response patterns. Those who ignore survey instructions might select one option consistently. Curran (2016) demonstrated that long-string analysis could identify some severe CRs. No universal cut-off exists for long-string analysis. Johnson (2005) and Niessen et al. (2016) chose the maximum long string. Long-string analysis was performed on the original dataset, and the identified responses were removed. The long-string analysis was performed using the free R package “careless” (Yentes & Wilhelm, 2023).
Rasch outlier analysis for random CR. Random CRs are selections in random fashions. For individual-level random rating behaviors, Rasch outfit statistics and single rater-the rest of the rater (SR/ROR) are suggested (Myford & Wolfe, 2004). SR/ROR is the correlation between a rater and the rest of the raters. When this index is substantively lower than expected, it indicates randomness. We adopted a conservative approach to select random careless respondents by (1) setting outfit Zstd >|3.0| as cut-off or (2) outfit Zstd close to |3.0| plus negative SR/ROR. The instrument measures teaching effectiveness with several positively correlated dimensions (Marsh & Hocevar, 1991). When SR/ROR is negative, it suggests randomness. Research demonstrated that the Rasch outfit index is as sensitive to random responses as other statistics (Osborne & Blanchard, 2011). Rasch outlier analyses were done on the collapsed dataset from step 1 in “Conventional Approach to Data Analysis.”
The FACETS program (Linacre, 2020) yields one infit and outfit index for each student, regardless of how often a student participates. To eliminate the confounding effect of multiple evaluations from an individual on fit indices, MFRM was run separately for each course. With the small sample sizes, an outfit Zstd larger than |3.0| indicates an outlier. The identified random respondents were removed. The percentage of CR, both the random and nonrandom responses in the data, was reported for the question.
Justifying CR Removal (Step 2)
Two evaluation criteria were utilized to investigate the necessity of CR removal (Figure 2b). They included (1) the comparison of the latent teaching ability estimates for the conventional and screening approaches and (2) the classification of the teachers’ ability estimates. The teaching abilities for the conventional and screened datasets were estimated using MFRM after anchoring within each SET dataset (conventional or screened datasets) (Linacre, 2012). Next, for the friendly understanding and interpretation of the results, the individual estimates were linearly transformed onto a 100th scale and classified into “Excellent” (90–100), “Good” (80–89), “Medium” (70–79), or “Pass” (60–69) categories. The transformed scale was popular in China. The exact χ2 test was performed on a 2 × 2 contingency table.
In addition to the statistical test, practical significance was examined to assess the necessity of removal. Regardless of the number of CRs in the data, it is meaningless to delete the CRs if there are no noticeable changes in the estimated thetas or the classification of the instructors before and after the CR’s removal. CR removal is justified if there are any noticeable changes in the estimated thetas or the classification of the instructors. By “noticeable,” we mean that instructors can be classified as “Excellent” before the data removal but “Good” after the removal, or vice versa. The misclassification will impact the feedback; thus, it is a critical index for assessing the impact of CRs.
If the results before and after the CR removal did not show any noticeable changes in the classification or estimated thetas of the ratees/instructors, the next step was to return to the conventional approach. However, if the results did show noticeable change, the analyses moved to the next step.
Item-Total Correlation, Dimensionality, and Rasch Item Analyses
These analyses were done on the dataset with CR removed. “Course workload” and “Course speed” had negative item-total correlations. They were removed one by one. PCA results produced the first eigenvalue of 19.39 (51.03% of the total variance) and the second eigenvalue of 2.17 (5.70% of the total variance). Thus, the uni-dimensionality assumption for the dataset was met. We checked the misfit items, using infit and outfit Zstd greater than |3.0|. The program flagged some misfits, but removing them one by one produced no noticeable changes in the ability estimates for the instructors. Subsequent MFRM and GT analyses were performed for the data screening approach on the remaining 38 items.
The FACETS program was re-run on the screened dataset with 38 items to obtain Rasch results and mGENOVA (Brennan, 2001b) to get GT statistics. Detailed information about GT analysis is elaborated in the following section.
Data Validity Improvement Evaluation (Step 3)
A set of criteria was utilized, including (1) reliability, separation, strata, SR/ROR, exact agreement (exact%), and expected agreement (expected%) obtained from MFRM results; and (2) Signal/Noise (S/N) ratio, G- and D-coefficients, and error variance from GT (Figure 2b). Two preliminary steps, randomly selecting participants and determining the sample sizes, were necessary to obtain these indexes.
The purpose of randomly selecting was to create a nested design. The generalizability software accommodates either a crossed or nested design. Table 1 shows the results of random selection. Our dataset had a two-facet nested design: students nested in the teacher/course, and survey items nested in the teaching trait. The multivariate expression was (s•:c•) × i°. An empty circle represents the facet nested within the fixed multivariate variables. A filled circle indicates that the facet is crossed within the fixed multivariate variables. The univariate expression is (s:c) × (i:v). Sample sizes of 10, 15, 20, and 25 for the G- and D-coefficient analyses were chosen because the class sizes at the university varied from 20 to 25 for smaller classes. mGENOVA was run on the two types of datasets to obtain the S/N ratio, error variance, and G- and D-coefficients under varying sample sizes to evaluate data validity improvement.
Randomly Selected Sample Sizes for Two Approaches.

Note. Missing “|” indicates no random selection.
In GT, S/N is the ratio of discrimination to noise/error. The G-coefficient indicates the consistency of the evaluators for rank ordering of the ratees according to the norm. The D-coefficient suggests the consistency of the evaluators in rating the ratees according to the criteria. If survey respondents repeatedly select the same options to an unwarranted degree and the amount of nonrandom CR is substantial, they would contribute limited variability to the true score variance. Random, careless respondents contribute random error instead of true score variance. Under these circumstances, the G-coefficient and D-coefficient are expected to be lower for the conventional approach. Moreover, the signal-noise (S/N) ratio should be larger and the error variance lower for the data screening approach. Thus, comparing the statistics obtained from two data types could reveal the improvement in data validity after removing CRs. Please look at Table 3, Figures 5 and 6 for details of improvement evaluation indexes from G-theory.
The statistics from FACETS, including separation, strata, reliability, χ2 statistics, and inter-evaluator agreement, were also obtained to evaluate if removing CR improved data validity (see Table 2 for details). The interpretation for separation and strata is the same. Separation is preferred for normally distributed outliers of interest. For heavy-tailed distributed outliers, strata is preferred (Linacre, 2022). For inter-evaluator agreement, higher values indicate better results. The agreement included SR/ROR, exact agreement (exact%), and expected agreement (expected%). If CR removal improved data validity, the related index from the data screening approach should either improve or remain as stable as it was with the conventional data.
Improvement Evaluation Statistics from MFRM.

Note. Bolded numbers indicate statistical significance. The numbers in the parentheses are df.
Results
Question 1: The Amount of Careless Responses
Figure 3 presents the long-string frequency. The most frequent long string in this study was 36. Ninety-seven students selected the same options invariably for 36 items. Nine students consecutively selected the same options for 37 items. Six students selected the same options for 39 items. Eight students selected the same options for every item (40). In total, 120 students (40.7%) exhibited nonrandom patterns.

Long-string frequency.
FACETS detected 28 random responses. Sixteen S&E students and 12 humanities students provided random responses. The means of these outfit Mnsq and Zstd statistics were 4.35 and 5.84, and the mean of SR/ROR was −0.28. In summary, 109 S&E students (62.2% of the first group) and 36 humanities students (29.8% of the second group) provided careless responses. CR detection techniques identified 145 evaluations as CR, accounting for 49% of the sample.
Question 2: Justifying the Removal of CRs
Figure 4 presents the latent abilities of the conventional and data-screening approaches. The mean score for the conventional approach was 73.19 (average standard deviation of 0.39), with a maximum of 77.89 and a minimum of 69.09. The mean for the screening approach was 75.60 (average standard deviation of 0.65), ranging from 83.62 to 70.53. The conventional approach underestimated the teachers’ abilities.

Comparison of ability estimates of the two approaches.
The conventional approach organized eight teachers into “Medium” and three teachers into “Pass,” whereas the data screening approach dichotomized two teachers into “Good” and nine teachers into “Medium.” The exact χ2 test produced a nonsignificant result. The disagreement was 54.4%. Practically, CRs impacted the ability estimates significantly, although the exact χ2 test was non-significant.
Question 3: Evaluating the Improvement in Internal Structure
Table 2 lists the improvement evaluation statistics from MFRM. Different facets produced significant χ2 results. A significant fixed χ2 test, sensitive to sample size, suggests substantial differences between observed and theoretical ones. For the teacher/ratee facet, the conventional approach yielded a separation index of 8.24 and a strata index of 11.31. The data screening approach produced a separation index of 6.61 and a strata index of 9.14. For the student/evaluator facet, the two approaches yielded the same magnitudes of reliability. Regarding exact% and expected%, the differences (42.70% vs. 39.50%, 40.80% vs. 39.50%) between the two approaches were small, with the conventional approach having slightly higher values. SR/ROR was 6% higher for the conventional approach. For the trait/teaching facet, the two approaches produced the same reliability index of 0.99. The separation and strata indices from the conventional approach were 10.96 and 14.95. They were 9.24 and 12.65 for the data screening approach.
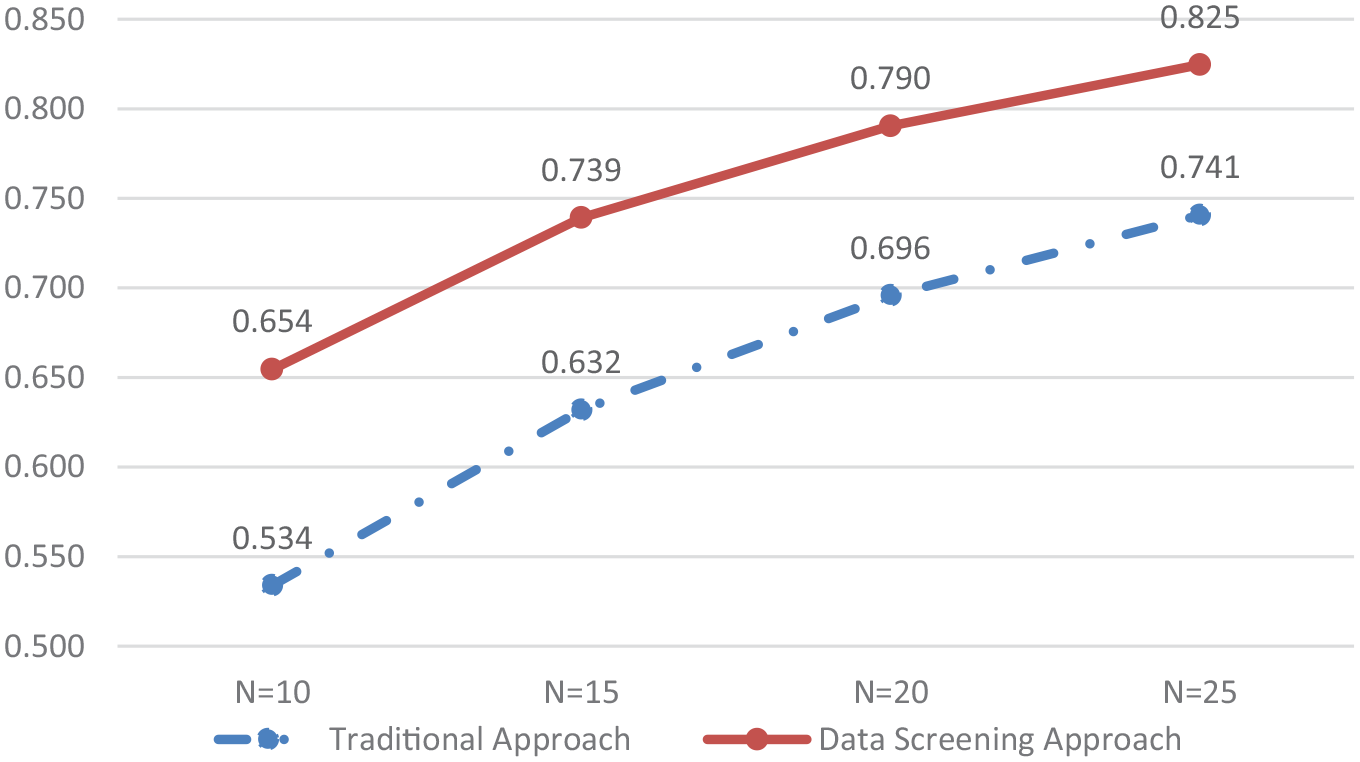
Figures 5 and 6 show the G-coefficients and D-coefficients under different scenarios. Holding sample sizes constant, the data screening approach outperformed the conventional approach regarding both coefficients. No consensus exists regarding the optimal magnitude of the coefficients. Practitioners often accept values greater than 0.70. For sample size 20, both coefficients were >0.78 in the screened data but ~0.69 in the conventional data.
Validity improvement evaluation—G-coefficients.

Validity improvement evaluation—D-coefficients.
Table 3 presents a set of improvement indexes from the generalizability theory. Holding sample size conditions constant, absolute error, and relative error standard deviations were smaller for the data screening approach. Similarly, holding the sample size constant, the S/N absolute and relative ratios were also larger for the data screening approach.
Improvement Indexes—Signal-Noise Ratio, Relative and Absolute Error.

Note. S/N = signal-noise ratio; RE = relative error; AE = absolute error; SD = standard deviation.
Discussion
This section discussed important findings. The first sub-section dealt with CRs, survey features, and evaluation practices. The second sub-section dwelt upon CRs and potential environmental factors. The next sub-sections discussed the improvement in the data’s internal structure and the practical impact of CRs, concluding with the limitations of the current study.
Severity of CR, Survey Features, and Evaluation Practices
Both random and nonrandom CRs coexisted in the sample. More careless responses were nonrandom than random. 49% of the participants were careless, suggesting that CRs prevailed in the dataset. CRs are related to survey features, including design and instruction (Ward & Meade, 2018, 2023). Krosnick (1991) and C. Zhang (2013) proposed that students’ responses to survey items are on an effort continuum from complete carelessness to optimal carefulness with three key factors—item difficulty, participant ability, and motivation. Item difficulty refers to the level of cognitive load to which an item requires participants to respond. SET survey items require not only student motivation but also a certain amount of expertise and a sufficient understanding of the rating criteria. In testing, it is routine for teachers to receive training to rate student performance, such as essays. It is unknown if students are trained to understand the rating criteria before they rate the teachers. Lack of training may compromise students’ ability to properly understand the criteria and rate. Considering survey features and evaluation practices, SET surveys, at least some SET survey items, might be difficult for some students.
Autonomy, Relatedness, and Motivation in SET
Among the students producing the CR patterns, 36 (29.8%) of the humanities students (or 12.2% of the sample) and 109 (62.6%) of the S&E students (or 36.9% of the sample) were careless during the response process. The χ2 test produced a statistic of 30.89 with a p-value of <.001. The administrators at the S&E school determined what to evaluate. In contrast, the students at the humanities school had autonomy in choosing which courses to evaluate. Autonomy might have impacted student rating behaviors. It might also be related to the fact that the author of this study had taught the students in the humanities school, and students felt connected with the survey administrator. This significant difference revealed problems in students’ motivation to participate in SET. The careless evaluation behaviors quantified in the current study are evidence of students’ lack of motivation in SET. This is consistent with the literature, which has documented the response rates between 30% and 50% (Spooren et al., 2013).
Autonomy and relatedness in the preceding paragraph are the critical concepts in self-determination theory (SDT) (Deci & Ryan, 2012; Ryan & Deci, 2000, 2017), a theory of motivation. SDT proposes that humans have three basic needs—autonomy, competence, and relatedness to have motivation. Autonomy refers to the desire that one can choose freely. Relatedness is the need to feel connected with or attached to others around. Competence refers to the experience of mastery and the feeling of effectiveness in what individuals do. In his highly cited research on intrinsic motivation, Deci (1971) reported that positive feedback could fulfill individuals’ need for competence. Chen and Hoshower (2003) highlighted that students were motivated to participate in evaluation if their feedback was meaningful. However, recent research on Chinese SET revealed that many faculty members received numerical numbers and considered evaluation feedback useless (Y. Zhang & Li, 2022). Proceeding from the perspective of SDT, the current research provided a better understanding of students’ lack of motivation to engage in evaluation.
Qualitative Impact on Teachers’ Classification
Figure 4 shows that the conventional approach underestimated the teaching quality. The exact χ2 test for the two approaches produced a nonsignificant statistic with a p-value of .56. However, more than half of the instructors (54.4%) were misclassified. They would receive the wrong information to improve teaching. Therefore, the data screening approach yielded qualitatively different results for teachers’ latent abilities. Practically, this was significant. Removing CRs was justified in the current study.
Improvement in Internal Structure
With SET survey features and environmental factors, some students did not adhere to the survey instructions and answered the items carelessly. The following paragraphs show that MFRM and G-theory analyses confirmed that CRs entailed noises. After removing CRs, the proposed set of evaluation criteria detected an improvement in data quality, thus verifying the necessity of deleting CRs in the dataset.
Improvement in Internal Structure by MFRM
Indexes from MFRM in Table 2 compared the internal structure of the data in terms of reliability separation, strata, expected%, exact%, and SR/ROR. Separation and strata indicate the number of statistically different performance strata the assessment can identify. Comparatively, the screening approach shows an outcome closer to the instrument design. The two different approaches yielded the same magnitudes of reliability indexes. As discussed in the literature review, random CR decreases inter-item correlations, and nonrandom CR increases these correlations (DeSimone et al., 2018). Responses that increased and decreased correlations were removed; thus, the reliability indexes were the same. Expected% and exact% were slightly higher for the conventional data. SR/ROR was 6% higher for the conventional dataset. MFRM results generally revealed that CR removal deleted noises and inaccurate data.
Improvement in Internal Structure by G-Theory
Figures 5 and 6 compare the increments in the G-coefficients and D-coefficients as sample sizes increased. As indexes analogous to reliability coefficients in classical test theory, the two coefficients quantify the ratio of the true score variance to the total score variance. Larger coefficients, either G-coefficient or D-coefficient, mean more true score variance and less error variance in the dataset. Relative and absolute error standard deviations decreased more with the data screening approach as the sample size increased. Thus, the data screening approach eliminated error variance from the original dataset.
Table 3 lists the S/N ratio, relative error, and absolute error with their standard deviation. The S/N ratio is the magnitude of the intended discrimination ( μ p −μ ) over noise/error (Brennan, 2001a). Higher values indicate the higher power of the intended discrimination. Conversely, smaller values mean more error. The data screening approach magnified the discrimination power of the original dataset.
G-theory analyses demonstrated that the data screening improved the data validity in terms of true score variance, error, and discrimination power. Removal of CRs eliminated some noise and improved data accuracy.
Limitations of the Current Study
The current study had some limitations. There were only 11 courses and 295 students. After data removal, the sample size decreased. Sampling error would affect the results and interpretation. Next, there was no criterion-referenced variable in the current study; thus, it was not feasible to perform predictive validity analysis.
Conclusion
This study introduced a three-step procedure into SET research and proposed a set of criteria to evaluate whether CR removal improved internal structure validity. When left unaddressed, the number of careless responses impacted the data’s internal structure and the evaluation of teaching effectiveness. Thus, careless responses were removed. The evaluation criteria detected improved data validity after removing CRs. The proposed methods can be applied under different evaluation settings.
Based on the results and discussion, there are several implications and suggestions. The first implication is that evaluators should take necessary measures, including prevention measures during the survey development and administration and a data quality check to minimize errors. The second implication is that deleting CR should be based on careful research IF and ONLY IF there are any noticeable changes in the estimated performances of the evaluated. Last, it is equally important to utilize a set of criteria to ensure an improvement in data quality after deleting careless responses.
Some suggestions follow. The first is the necessity of using formative evaluation. With summative evaluation, faculty promotion and tenure depend on student rating of instruction. They tend to assign high grades to students based on their interests. Students tend to give higher ratings of instruction. Both parties make optimal decisions for their benefit. The second is to develop sound evaluation practices, including improving SET survey design and satisfying students’ basic psychological needs to motivate them. For example, evaluators should provide faculty members with positive and useful feedback containing specific suggestions for improvement. This will facilitate instructional improvement, which, according to Deci (1971), will increase students’ competence in evaluation.
Footnotes
Acknowledgements
The author would like to express gratitude for the help of Miss Rong Yin, who provided help with instrument development, survey administration, and data collection.
Declaration of Conflicting Interests
The author declared no potential conflicts of interest with respect to the research, authorship, and/or publication of this article.
Funding
The author disclosed receipt of the following financial support for the research, authorship, and/or publication of this article: This work was supported by Shandong Youth University of Political Science.
Ethical Approval
The institutional research board approval was embedded with the school grant.
Data Availability Statement
The data supporting this study’s findings are available from the author upon reasonable request.