
Abstract
We have less time and focus than ever before, while the demand for attention is increasing. Therefore, it is no surprise that when answering questionnaires, we often choose to strongly agree or be neutral, producing problematic and unusable data. The current study investigated forced-choice (ipsative) format compared to the same questions on a Likert-type as a viable alternative. An established motivation questionnaire was administered in two versions, forced-choice and Likert-type, to 1088 first-year engineering students. Descriptive, non-parametric statistics and Rasch measurement models were applied to assess usefulness, validity and reliability. Results: The ipsative version had a higher response rate, less missing data, and the motivations emerged more clearly. Evidence for the reliability and validity of the forced-choice version was excellent. The forced-choice format is recommended as an alternative to the Likert types when collecting human or social survey data.
Plain language summary
Questionnaires can be great tools for collecting data but often require time from respondents to read and rate each statement. The current study used a forced-choice format, where respondents had to choose their top reasons, as an example of how to collect data more efficiently. Asking respondents to choose their preferred options or rank questions can also lead to more precise answers. When you give respondents a rating scale, they tend to opt for the middle choice or agree with most statements. Asking them to choose their preferred option instead took less time and concentration, resulting in more people completing the questionnaire and better-quality data. The current article demonstrates how to evaluate the consistency and legitimacy of the questionnaire with the Rasch model. The article argues for forced-choice formats and applying a psychometric theory so that researchers can show evidence for the measurement quality of their instrument and obtain valuable results.
Keywords
Introduction
Rensis Likert originally designed his rating scales to reflect the underlying construct through the level of agreement on a numerical continuum (Likert, 1974). His original idea was that the level of agreement could be summed or averaged and that each item contributes to the measured central dimension (H. Boone & Boone, 2012). The assumption that aggregated responses represent the underlying construct is based on Classical Test Theory (C.T.T.) (South et al., 2022; Warmbrod, 2014). Critique of the Likert-type scale includes the assumption that they lead to interval variables, whether parametric tests are appropriate for such formats and the oversimplification of complex attitudes created from the response structure (Harpe, 2015; Sullivan & Artino, 2013). The other critique of Likert scales is that they can lead to response biases such as social desirability and central tendency responding (Kusmaryono et al., 2022), addressed in the current article. Self-report data of any type can be vulnerable to acquiescence bias, social desirability and neutral responding, which Likert-type response options can potentially aggravate (Brown & Maydeu-Olivares, 2018a, 2018b; Combrinck & Inglis, 2020; Wang et al., 2017). The interpretation of Likert options and ratings may also vary among respondents, causing other potential biases due to the ambiguities of language (Hancock & Volante, 2020). Using a questionnaire which has shown acceptable and high-reliability indices will not necessarily reduce over-reporting of “good” behavior, and the halo effect might persist (Douglas & Tramonte, 2015; Kreitchmann et al., 2019). Respondents might be tempted to endorse statements they perceive as socially acceptable (Latkin et al., 2017; Vesely & Klöckner, 2020). Careless or inattentive survey responses could be due to several factors, including poor targeting, inappropriate sampling or poor item writing (Jaeger & Cardello, 2022). Berry et al. (2019) found that inattentive responses correlate with being male, low on personality factors such as conscientiousness and agreeableness, and less sensitive themes included in the items (whereas susceptible topics, e.g., crime, drew more attention from respondents). The number of categories in a Likert scale could increase inattentive responding, and M. A. Revilla et al. (2014) found that five categories were the maximum number that should be employed. Even transient psychological states (e.g., negative affect) could influence a respondent (Huang & Wang, 2021). While we have little to no control over the respondent’s traits and feelings when completing a survey, the instrument’s quality is the researcher’s responsibility. This is why using Rasch models is strongly advocated to assess any format type of instrument, including Likert-types (Knoch & McNamara, 2015; Retief et al., 2013). From a measurement perspective, many of these critiques leveled at Likert formats can be addressed by testing the hypothesis that respondent ability to endorse more of the construct aligns with the difficulty of item endorsability, that is, applying the Rasch rating scale model, and testing the claim that an underlying construct is consistently being represented by all items (Combrinck, 2020; Fisher, 2009). The researcher should be aware of the shortcomings of using any particular format and examine underlying assumptions of measurement (Fisher, 2022). Likert item types remain immensely popular in survey design due to familiarity with the format and ease of analysis.
Alternative formats have been suggested, such as dichotomous scales (Dolnicar et al., 2011), fuzzy rating scales (Castaño et al., 2020), slider scales (Kemper et al., 2020) and rankings (Yannakakis & Martínez, 2015). Forced-choice questions present the respondents with a list of statements or items, and they choose the most suitable options (Brown & Maydeu-Olivares, 2018a, 2018b). Compared to Likert-style formats, the advantages of forced-choice questions have been explored in various studies with potential advantages well explored (Chan, 2003; Cheung & Chan, 2002; Lee et al., 2019). The Forced-multiple choice format is popular in psychological research, especially personality and career assessments (Brown & Maydeu-Olivares, 2013). Forced-choice formats have disadvantages, such as the complexity of administration and analysis. Administering forced-choice would be especially difficult if a paper and pen route is followed, as the respondents may not understand what is required to answer the question (Buchanan & Morrison, 1985; Zhang et al., 2020). Analyzing traditional Likert-type scales is also more accessible, with established techniques and parametric analysis options after applying logarithmic transformations (Hontangas et al., 2015; Smyth et al., 2006). Deriving interpretations from forced-choice formats can be complicated, making it challenging to compare groups or longitudinal assessments, and this places an additional burden on the researcher (Salgado et al., 2015; van Eijnatten et al., 2015). Some constructs and ratings do not work well with forced-choice formats, and here, the Likert type is preferred as it is more versatile (Lee et al., 2019; J. D. Miller et al., 2018).
Bäckström and Björklund (2024) found that Likert type items and forced-choice options yield similar information. A mixture of items format solution which leaves a backdoor for the researchers could be very beneficial and should be considered (Schulte et al., 2021). Using forced-choice might be valuable in certain instances, for example, constructs that lead to mid-choice favoring (Nadler et al., 2015). At the same time, using Likert-type formats may be advantageous when a response is required for each item, when respondents are more familiar with the format and when analysis requires the numerical range of the items for analysis and comparison purposes (Hall et al., 2016; Nemoto & Beglar, 2014; Wu & Leung, 2017). Despite the advantages of Likert formats, social desirability remains a serious concern. Therefore, the paper presents a case for forced-choice formats in social and human science settings to offer more usable data. Forced-choice questions also have a definitive practical advantage—the format requires less time and can be less attention-intensive for respondents than rating each statement on a Likert-type (Brown, 2016; Brown & Maydeu-Olivares, 2011). The short attention span of humans has been well documented, and we researchers want accurate answers, which our respondents are more likely to give if we do not overburden them (M. Revilla & Ochoa, 2017). The usefulness of item response models (I.R.T.), including the Rasch model, for analyzing ipsative data is well documented (Brown & Maydeu-Olivares, 2013, 2018a, 2018b). Test-retest and comparative studies using Likert-type items have been used to validate ipsative results (Calderón Carvajal et al., 2021). However, the current paper argues that this is unnecessary when using log-transformed measures such as those produced by the Rasch model (Rasch, 1960, 1993; van Alphen et al., 1994). A valid and reliable representation of a construct requires a range of relevant aspects to be examined, and Rasch models offer strategies to evaluate instrument functioning (Bond et al., 2021; W. J. Boone, 2016). Instruments are valid if their results inform decisions, changes and growth (W. J. Boone et al., 2014). When responses lack variance, that is, skewed values, the data quality is severely impacted, and limited inferences can be drawn (Kreitchmann et al., 2019; Xiao et al., 2017). In the current study, I demonstrate how the Rasch model can be used to check the functioning of forced-choice questionnaires, which could lead to increased awareness and application of the format to gain more valuable inferences and enhance meaningful measurement. I offer guidelines for researchers who want to use alternative formats. In previous studies, Rasch models have been applied to ipsative data with promising results (Andrich, 1989; Van Zile-Tamsen, 2017; Wang et al., 2017).
Research Questions
Materials and Methods
Instrument
The Academic Pathways of People Learning Engineering Survey (APPLES) contains 15 motivation-related items used in higher education to understand students’ drive to study engineering. The questionnaire demonstrated reliability and validity in previous uses in the United Kingdom (Sheppard et al., 2010) and has been used in the United States and South Africa (Direito et al., 2019; Donaldson et al., 2008; Eris et al., 2010). The motivation questionnaire covers six dimensions of motivation:
1. financial (F)—Example of item: An engineering degree will guarantee me a job when I graduate
2. intrinsic behavioral (I.B.)—Example of item: I like to figure out how things work
3. intrinsic psychological (I.P.)—Example of item: I feel good when I am doing engineering
4. mentor influence (M)—Example of item: A mentor has introduced me to people and opportunities in engineering
5. parental influence (P)—Example of item: My parents want me to be an engineer
6. social good (S.G.)—Example of item: Technology plays an important role in solving society’s problems
Figures 1 and 2 show the two forms of the APPLES questionnaire administered in this study.

Forced-choice format of the APPLES questionnaire.

APPLES original version with Likert-type response options.
Version 1 is the forced-choice type, where students had to choose up to five reasons for studying engineering. Version 2 is the original Likert-type scale, where a respondent could indicate that the option was not a reason, a minimal reason, a moderate or a major reason for studying engineering. Most respondents answered the forced-choice version of the assessment, but a randomly selected subsample (n = 221) received the original Likert version for comparison.
Sample
The APPLES questionnaires were administered online via Qualtrics and completed by 1089 first-year South African engineering students who participated in a broader study on student success (Inglis et al., 2022; Inglis & Simpson, 2023). There were more male (71%) than female respondents; almost two-thirds of the respondents were White (58%), followed by African (26%) and other ethnicities such Indian or Mixed race (16%). Most students had a family member who had attended university (81%), and the average age was 19. The sample size is adequate as 68% of first-year students responded to the survey and allowed their data to be used for research purposes. I intend to use non-parametric statistics in future analyses to detect differences in response patterns. Non-parametric tests have fewer assumptions, and my large sample size should enhance the detection of effect sizes and significance. The responses are interdependent, and choosing one option might influence one’s choice to select another, but the large sample size should help account for this. Sample size recommendations for Rasch Analysis suggest that complex models require larger sample sizes for stability (Linacre, 1994), and the forced-choice nature of the ipsative data increases the complexity. Studies of Rasch parameter stability suggest that sample sizes larger than 250 are adequate for 15 items (Chen et al., 2014).
The Rasch Rating Scale Model (R.S.M.)
The Rasch Rating Scale (R.S.M.) model was designed to analyze survey-type data where the same response options are present, using the Rasch logic of comparing a person’s ability to item endorsability (Andrich, 2016). The R.S.M. is uniquely suited to analyzing survey data, especially ipsative data, as each option is evaluated in relation to the other, effectively handling the nature of the comparisons (Engelhard, 2013; Rost, 2001; Vidotto et al., 2018). The R.S.M. comparisons consider the options’ interdependencies rather than evaluating items in isolation. The Rasch model also transforms raw scores into logic, a logarithmic scale that converts ordinal data into actual interval scale data. The logit scale can range from negative to positive infinity (although most applications see values within about −3 to +3) (Bond et al., 2021; W. J. Boone et al., 2014). The mean item location is usually set to zero logits as part of the estimation process, and the Standard Deviation (S.D.) is sample-specific.
Data Analysis
I applied the Rasch dichotomous model using Winsteps© 5.4.0.0 (Linacre, 2023a). SPSS version 28 was used to generate descriptive statistics and compare dimensions with non-parametric statistics (IBM, 2023). Every question was conceptualized as an option. Students were required to select their most relevant 5 of 15 statements and scored 1 for selected or 0 if not chosen. The six dimensions were treated as distinct, and items were analyzed separately in Winsteps to produce the item statistics. Rasch statistics examined include the Wright map, item reliability and differential item functioning (DIF). Cronbach’s alpha was calculated for the sub-sample who answered the original version of the questionnaire (Likert-type). The reliability and validity of the motivation dimensions were examined via five aspects of measurement:
Do items fit the Rasch model? The criteria used were infit and outfit mean square statistics (MSQ) to find items which significantly misfit the model, and if items had outfit or infit values higher than 1.5, they were investigated (Combrinck, 2020; Linacre, 2002). The point-measure correlation (PTMA) was assessed for the Likert-type data, and a positive correlation is expected as items should correlate with one another and the underlying construct. Negative correlations would require further investigation as this could indicate items that should have been reversed scored or that are not behaving as expected (Linacre, 2023b). Some authors offer guidelines such as 0.30 to 0.70 as a range for the PTMA (Allen & Yen, 2002). Wright (1992) emphasized that eliminating items based on low correlations could remove necessarily easy or difficult items that form part of the construct. The current analysis only investigated the positive nature of correlations.
Due to the ipsative nature of the data, a further step was taken to check items’ invariance across background factors. Non-parametric tests were conducted using an average number of times a category was chosen (e.g., the mean of social good options chosen). I added this additional analysis to check if the differential item functioning resulted in all items becoming more likely to be chosen (differential test functioning) in the forced-choice format. The combination of Rasch analysis and non-parametric statistics is due to the ipsative nature of the data. I include both as an additional check of whether the two formats can be compared and whether valid and reliable inferences can be derived from the forced-choice format. Ipsative data have certain constraints, one being that parametric statistics cannot be applied. Furthermore, some types of psychometric analysis cannot be conducted with this type of data, for example, reliability coefficients being calculated. As the onus lies here with the author to show the feasibility of using the forced-choice format, additional analysis was warranted for extra checks of instrument functionality.
The comparability for the two formats was first established by randomly assigning the sub-sample who answered the Likert format to reduce sampling bias. Secondly, common item equating was built into the process through the other APPLES items students completed. There were other items related to their motivation to study engineering, such as career aspirations after graduation. For example, measuring social good was done with the Likert-type items, the forced-choice items and the linking items from aspirations after studying engineering.
Ethical Statement
Both faculty and students provided permission for the study. All first-year students completed the survey, but I only used data in the current analysis when students gave informed consent for further research uses.
Results
In this section, I compare the forced choice and the Likert format using descriptive and inferential statistics. Then, I delve into the internal validity and reliability of the two types by applying the dichotomous and rating scale Rasch models.
Comparison of Forced-Choice and Likert Response Rates
Table 1 shows the percentage of students who started the survey and finished it to compare the forced-choice version to the original Likert data (excludes 13% of respondents who completed the survey but declined consent for data to be used). I also show how many cases overall were missing; in the forced-choice version, this would be students who did not select any option and, in the Likert scale, those who chose not to answer.
Count and Percentage of How Many Started and Finished the Survey and Missing Cases.
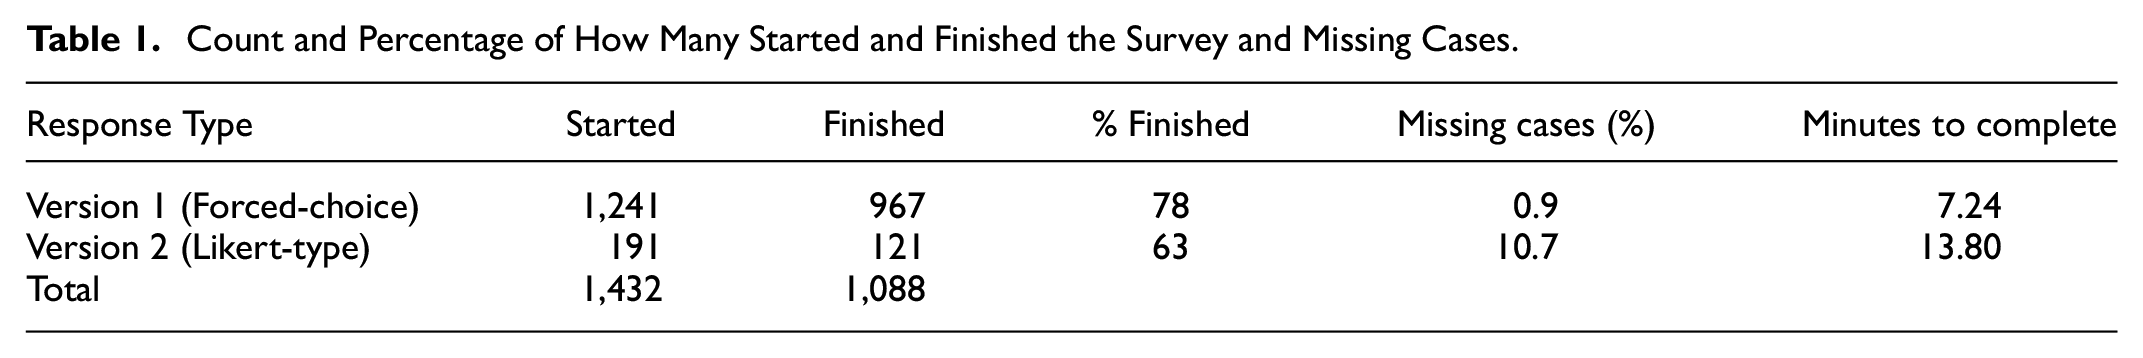
The original Likert options were given to a smaller, random subsample. The Likert options require more time and attention, and the completion rate (63%) is lower than that of the forced-choice format (78%). The missing data rates also differ, with more respondents not answering all questions in the Likert version (10.7%) compared to the forced-choice version, where 0.9% of respondents did not select at least one option from the list. The average time required to complete the forced-choice format was 7.25 min, whereas the Likert type required more time (13.80 min on average). General recommendations from the literature are that shorter surveys are preferable and that 10 to 20 min should be the maximum time respondents spend online answering (Barton et al., 2021; M. Revilla & Ochoa, 2017).
The difference between forced-choice and Likert-scale selection is shown in Figure 3, with a percentage calculated for the forced-choice (out of options chosen) and the Likert format, out of 4.

Degree of dimension endorsement comparison for Likert-scale and forced-choice.
The two formats have a similar underlying pattern, with social good being the most highly chosen aspect and parental influence being the least. However, the Likert format has a higher endorsement for all motivations to study engineering. Asking respondents to choose their top five reasons leads to a less ambiguous indication of which aspects motivated them, whereas asking them to rate on a scale from 1 to 4 led to high endorsement for most options (mentor and parental being the exceptions). The difference is most notable for financial motivation, where in the Likert version, students endorsed this highly overall (71%), and there was considerably less choosing of financial options in the forced-choice version (23%).
Item Indices
The item reliability and separation statistics are shown in Table 2.
Item Reliability and Separation Indices Per Questionnaire Type.

The high item reliability (α = .99) for both formats indicates that the sample size is large enough to accurately locate items on the motivations construct. The high item separation index shows that items highly endorsed are most likely the favored options, and items with less endorsement are most likely less favored; the items accurately measure the construct. The item reliability and separation index provide evidence for the construct validity of both formats.
Table 3 shows the mean, model standard error (S.E.), infit mean square (IN.MSQ), outfit mean square (OUT.MSQ) and point-measure correlation (PTMA) for both item types, calculated per dimension. The only item with a high outfit mean square (M.S.Q. = 1.55) was question 6 (My parents want me to be an engineer), which came from the forced-choice format. However, the outfit needed to be deemed larger to warrant the removal or revision of the item (Linacre, 2023b). As expected in an ipsative data structure, the point-measure correlations are minor for the forced-choice format. The PTMAs are positive and reasonable for the Likert-type version. Since ipsative data constrain individual choices, responses cluster at extreme ends. The clustering is advantageous as it gives us a clearer idea of valid preferences. However, it also limits the potential for correlations as the range within the variable is constrained (L. A. Miller & Lovler, 2020). The constant sum produced by ipsative data can also create negative correlations, which are inflated (McLean & Chissom, 1986; Ried, 2014). Therefore, the low correlations for the forced-choice version are not unexpected. Generally, the fit statistics are unremarkable, that is, satisfactory, for all items on both test formats.
Descriptive Item Statistics From the Rasch Model—Calculated Per Construct and Compiled.

Reliability—Consistency of Items Endorsed
Using the Likert-type data showed most of the aspects had sufficiently high person reliabilities (coefficient alphas): Social good = .72 Financial = .71 Intrinsic = .81 Mentor = .80 Parental = .62
The parental dimension was the only construct with a lower-than-desirable reliability coefficient.
When examining item patterns for the forced-choice version, there was a consistent endorsement of questions related to the same aspects and item fit statistics, indicating agreement amongst students on the construct, as seen on the Wright maps Figures 4 and 5. The maps show that intrinsic motivation and social good were readily endorsed and consistently chosen options. Conversely, mentor and parental influence were the least favored. The findings from the Wright maps can be used as evidence of the reliability of the dimensions.
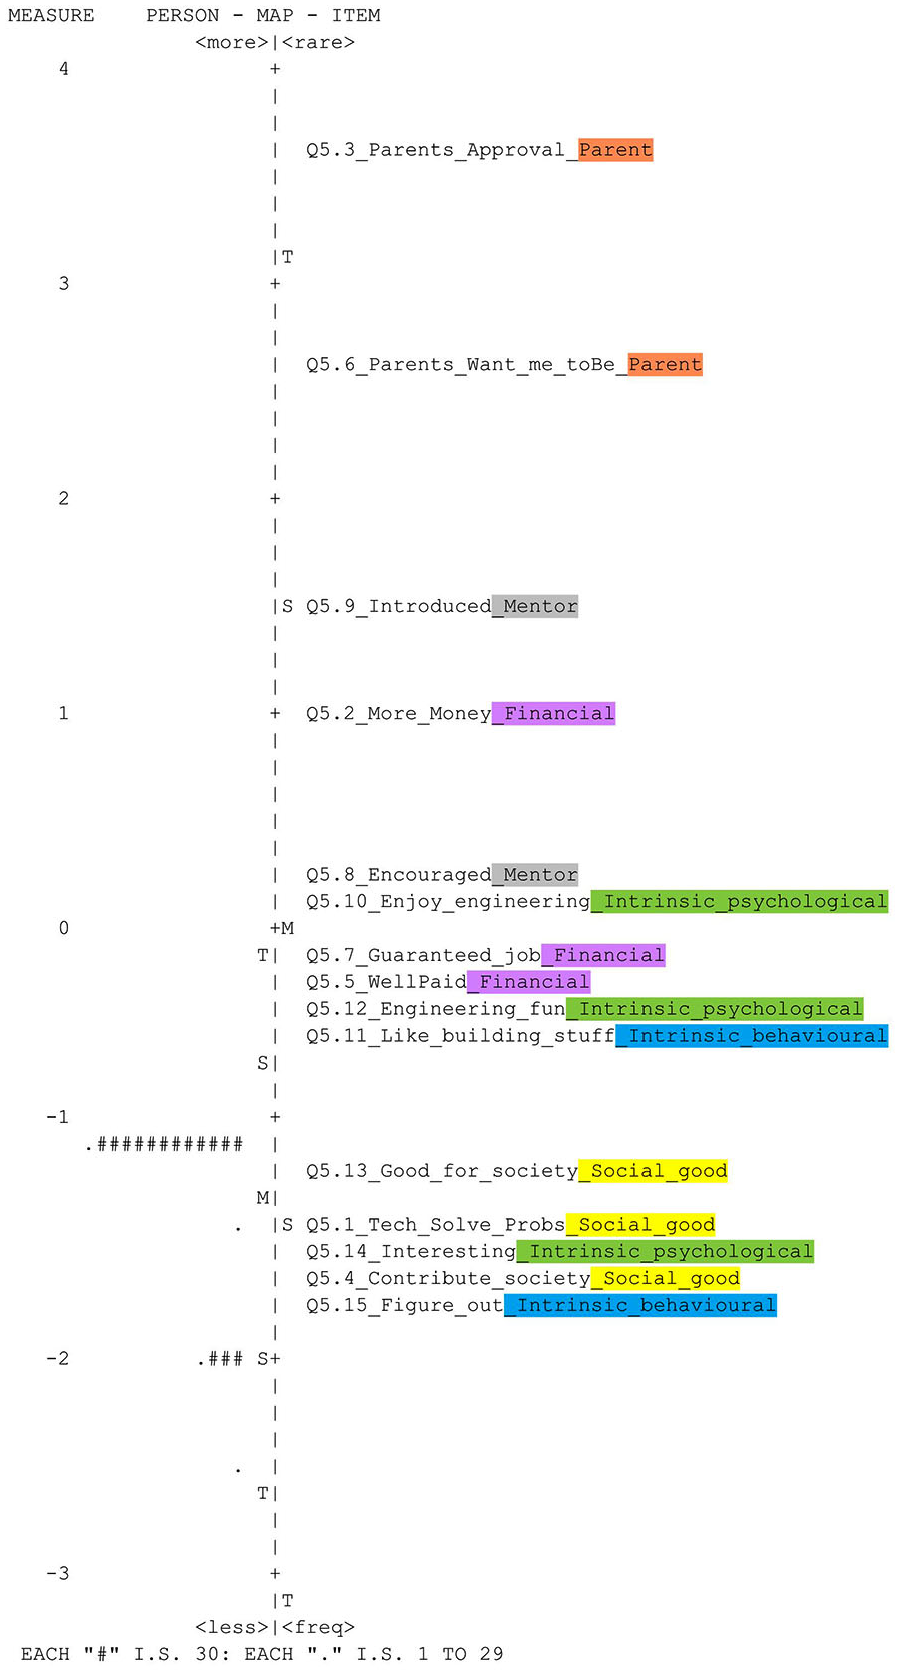
Wright map of forced-choice format.

Wright map of Likert type format.
Invariance—Differential Item Functioning (DIF)
The Likert-type options revealed no differential item functioning between males and females, but large and significant DIF was found in the forced-choice version shown in Table 4. Only items with large (contrast > 0.5) and significant (p < .05) DIF are reported.
Differential Item Functioning—Items Showing Significant and Large Differences Between Genders.

Women had a large and significant differential contrast for item 7 (Engineering will guarantee me a job). At the same time, men were more likely to choose items related to intrinsic motivation (e.g., engineering is fun). The difference is significant across all intrinsic and financial motivation items, as shown in Table 5.
Mann–Whitney U Test to Compare Gender Means on Motivation Constructs.

*p < .05.
The Likert-type options did not show significant differences between the genders on the six motivational aspects. In the forced-choice format, women are significantly more likely to choose motivation options related to finances (p = .00), and men are significantly more likely to choose intrinsic behavioral (p = .03) statements as their reason for choosing to study engineering. However, the effect size is small for financial reasons, and for intrinsic behavioral motivation, the effect is negligible.
In terms of ethnic differences for the Likert types, I did not find large and significant DIF between the ethnic groups. The Kruskal–Wallis test also revealed no significant difference in the dimensions between groups for the Likert options. Four items were identified with large and significant DIF in the forced-choice format analysis. For the items where DIF was detected, the percentage per ethnic group that chose the motivational forced-choice option is displayed in Figure 6.

Percentage of ethnic groups who chose the option showing differential item functioning.
White students chose the options for social good and most intrinsic behavioral options more often than the other groups. For the intrinsic options, White students chose an intrinsic reason as their primary motivation for studying engineering more than 60% of the time.
Table 6 compares differential item functioning (DIF) among ethnic groups responding to the APPLES survey, and only large and significant differences are reported.
Differential Item Functioning—Items Showing Significant and Large Differences Between Ethnicities.

*p < .05.
Item 1 revealed significant and large DIF between African and White students and between White and Other ethnicities. A similar pattern can be observed for the other items, where White students were significantly more likely to endorse the intrinsic options. Table 7 shows the Kruskal-Wallis results and the effect sizes based on the Mann-Whitney comparisons.
Kruskal-Wallis H Tests to Compare Ethnic Means on Motivation Constructs.
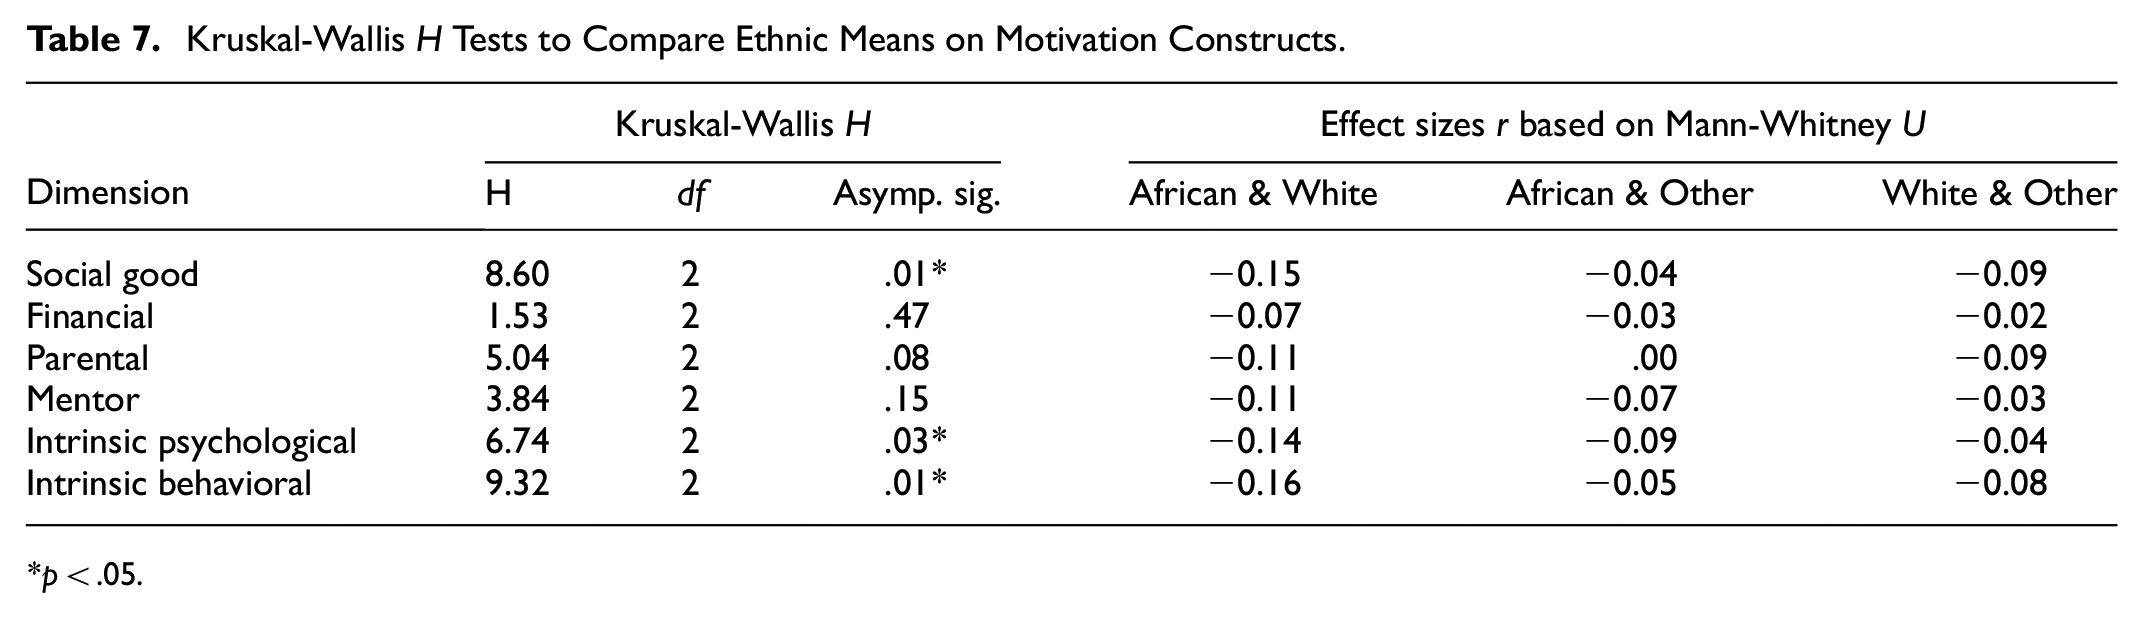
p < .05.
African and White students were the only comparisons that yielded significant differences and small effect sizes. The White students are significantly (p = .01) more likely to choose the social good options, but the effect size is small (r = −.15). The same findings show up for intrinsic psychological and behavioral motivation.
Another variable, first-generation students, was also investigated for DIF. None of the items showed large or significant differences for students who were first-generation attendees when compared with students who had parents or relatives who attended university for either of the survey versions.
Unidimensionality
A comparison using the current data shows that P.C.A. results for the traditional Likert items (version 2) and the forced-choice options yielded similar results, as shown in Table 8.
Comparison of P.C.A. Unexplained Variance of Two Types of Variables.
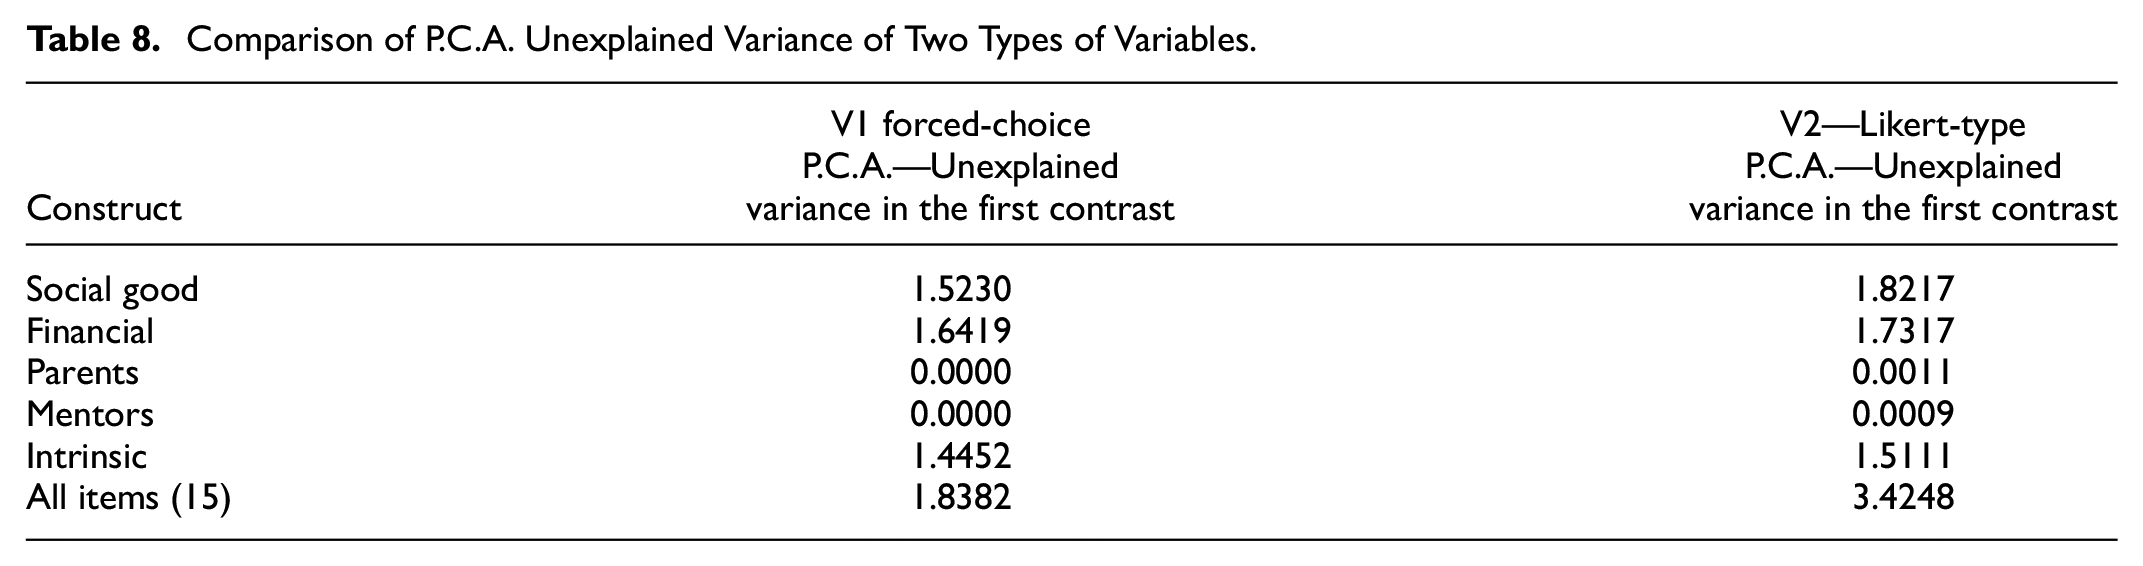
In both the ipsative and the Likert-type versions, there was sufficient evidence that the respective constructs are unidimensional, and the unexplained variance is below the threshold of 2, as Linacre (2023b) recommended. In a Rasch PCA, the main component is the underlying construct, and the contrasts are potential dimensions which could compete with the main Rasch-explained variance. In the current comparison, the most substantial contrast does not reach the threshold to compete with the central dimension, except if a PCA is conducted on all the Likert-type items and the dimensions are not considered. The analysis presented here shows that Rasch PCA can be used for ipsative data if the dimensions are pre-defined; the PCA for a forced-choice format does not reveal underlying dimensions.
Discussion
The study found that forced-choice items had improved response and completion rates. The forced-choice format could lead to a more efficient survey with enhanced respondent engagement. The fact that missingness was reduced in the forced-choice format indicates a potential contribution to improved data quality. Construct endorsement emerged more clearly in the forced-choice format. The same patterns of construct endorsement were observed in the two format types, suggesting that both types can help identify the underlying constructs on a range. However, specific motivations emerged more strongly in the forced-choice format, which could indicate a more accurate measurement, or it could be a by-product of the forced nature of the item. The reliability and separation indices were acceptable for both formats. When I looked at patterns in the data between the two versions, there were similarities in which motivations were highly favored. The consistency is encouraging as the forced-choice version picks up the same pattern but more clearly. For example, most participants selected social good as their reason for studying engineering, and only a few selected parental influence in both questionnaire versions. The most substantial difference can be seen when choosing financial reasons for studying engineering; while most students (71%) said it is a moderate or major reason in the Likert-version, only 23% chose a financial option as part of their top five in the forced-choice format. Using Likert-type formats can lead to a high agreement with statements due to time constraints, a lack of engagement from the respondent, or social desirability (Subedi, 2016). Using forced-choice items can reduce acquiescence bias and provide a clearer picture of the construct; similar findings were reported by Kreitchmann et al. (2019), Watrin et al. (2019), and Geldhof et al. (2015).
Both formats had high item reliability indices, indicating the satisfactory accuracy of measuring the underlying constructs. The Rasch model was valuable in analyzing both types of item formats. However, the user should be cautioned that the forced-choice format has more limitations regarding statistical models that can be applied. Differential item Function (DIF) was more clearly detected in the forced-choice format, whereas no DIF was detected in the Likert-type data. The presence of DIF in one but not the other could indicate that the forced-choice format reveals patterns which are not evident in the other format or that the nature of the format causes more differences between groups due to its obligatory nature.
The Rasch measurement model was a valuable tool for assessing the functioning of the forced-choice version and comparing psychometric properties to the Likert-type version (Bailes & Nandakumar, 2020). The forced-choice version data fit the Rasch model but not the Likert type. Both had high item reliability values (0.99) and large separation indices, which showed consistency in the options selected. Juxtaposing the two Wright maps, it emerged that the overall pattern is consistent in that social good and intrinsic reasons are easy to endorse and parental and mentoring are the least likely to be chosen. However, the item ordering on the maps differs; for example, financial items were more challenging to endorse on the Forced-choice Wright map. This difference in ordering may be a downside of the forced-choice data, as ipsative data produces more significant variance.
Cronbach’s alpha cannot be calculated for ipsative data, and other Rasch statistics, such as the item separation index, were used to indicate consistency in responses. When I investigated the coefficient alpha values for the Likert version, the dimensions had acceptably high values (above .700) except for parental motivation, showing that the forced-choice version mirrored the reliability through the item separation index and the Wright map. The person separation index cannot be calculated for the forced-choice type, but I suggest using the Wright map to guide the consistency of items and dimensions endorsed and examining the item reliability produced by software such as Winsteps. The forced-choice type gave a good description of the items and dimensions.
The item fit statistics for the forced-choice version only had one item misfit, for the statement: My parents want me to be an engineer. A common phenomenon in surveys is that participants are less likely to endorse certain items. This trend is likely to be duplicated in forced-choice formats. Certain vital items may be under-selected, which happened in the current study. Therefore, it is crucial to understand why the respondents might view the options as irrelevant, uncomfortable, or undesirable. Consultation with engineering educators and other researchers raised the possibility that the negative slant of the questions may discourage respondents from choosing parental options. For example, if the item was rephrased as My parents would be proud if I became an engineer, it might draw a more positive and realistic endorsement of belief (area for future research). Negatively phrased statements and items may produce item bias and problems (Franchignoni et al., 2010; Pey Tee & Subramaniam, 2018). Therefore, we recommend that future versions of the APPLES adapt the parental influence items to reflect positive contributions parents can make to the motivation to study engineering.
When assessing the unidimensionality of the ipsative data, the Rasch model was identified as a viable method for principal component analysis (P.C.A.) due to the natural log transformations. A juxtaposition of Likert and forced choice P.C.A. results showed similar findings, where the first contrasts were too small (<2) to compete with the central dimension. The P.C.A. results show that Rasch models can assess the unidimensionality of constructs for ipsative data and support the alternative format used if the dimensions are specified prior to analysis.
In psychology, the forced-choice format has a well-known history of use with either positive results or comparative findings. For example, Guenole et al. (2018) found that ipsative formats worked well when evaluating maladaptive personality traits in the workplace. K. B. Boone (2021) found that forced-choice formats work well with neuropsychological exams. Bäckström and Björklund (2024) showed that the two formats can yield comparable information for personality research, leading them to advise using a mixture of the two types of items. Morillo et al. (2019) found that the F.C. format worked well for assessing personality traits, but the format did not wholly cover some aspects of the constructs. Wetzel et al. (2020) advise that more research and consideration are needed before changing the format of the response structure. Brown and Maydeu-Olivares (2018a, 2018b) found that the format works well for sensitive topics in educational settings. Zhang et al. (2024) did a comprehensive study of graded forced-choice items and their applicability in educational research and found that graded formats outperformed the traditional dichotomous style. Conversion of the format into conjoint analysis is also possible, and Hainmueller et al. (2014) demonstrate how to do this so that causal inferences can be derived in political science (Hainmueller et al., 2015). Ross and Bibler Zaidi (2019) make the crucial point that any survey format has limitations, and it is far more critical that the researchers are aware of the limitations and explicitly acknowledge these extensively in their reporting.
The current study’s results should be used with other factors, and researchers are encouraged to find the balance between practical administration, high-quality data, and ease of analysis. Likert-type and forced-choice items have pros and cons, and the trade-offs should be considered before choosing a format. Of course, piloting both types could be optimal if a large enough sample is available.
Limitations of the Study
The nuances and limitations of question formats must be acknowledged. The Likert-type format may suit some survey types, such as questions requiring ratings rather than ranking or paired comparisons (J. D. Miller et al., 2018; Sung & Wu, 2018). Alternatively, both formats could yield equally reliable and valid inferences for some surveys, in which case the decision should be based on the practicalities of administration (Cohen et al., 2017; Ried, 2014). The Likert-type format has produced better comparative data for researchers who want to investigate the association between groups, another factor that should be considered (Heo et al., 2022). The advantages of Likert-type formats are that they offer a continuum of responses, produce ordinal data, offer the opportunity to investigate equal intervals, and are more flexible in currently available statistical methods (Bäckström & Björklund, 2024). The distinct advantages of Likert-type scales’ rich data analytical flexibility should be considered against their disadvantages when researchers decide whether to try forced-choice. The choice of first-year engineering students as a sample is a limitation as first-year students are more eager to please and may be more prone to social desirability. Further research studies can be done where other samples and constructs are trialed with forced-choice formats and compared to Likert-type scales for usability.
Guidelines for Researchers
The results presented a psychometrics-based case for the validity and reliability of using forced-choice questions in self-reported instruments and how psychometric models can be applied to evaluate ipsative data. A valid and reliable construct representation requires a range to be measured, which can be more challenging to obtain with the Likert format if social desirability or acquiescence bias is present. Forced-choice options indicate a construct’s range more clearly and negate some social desirability responses. The Rasch model can assess the reliability and validity of ipsative data.
Guidelines for researchers on how to analyze and defend forced-choice formats:
1.
2.
3.
The current study demonstrated how the Rasch models could be used to check the functioning of forced-choice questionnaires, and awareness and application of the format could lead to more valuable inferences and enhance meaningful measurement for future researchers.
Footnotes
Acknowledgements
Professor Trevor Bond and Professor William P. Fisher, Jr. read and gave valuable feedback. I am very grateful to both for their time, inputs and congeniality.
Declaration of Conflicting Interests
The author declared no potential conflicts of interest with respect to the research, authorship, and/or publication of this article.
Funding
The author disclosed receipt of the following financial support for the research, authorship, and/or publication of this article: The South African Department of Higher Education and Training (DHET) provided funding for writing this article and academic support through the Scholarship of Teaching and Learning (SoTL) grant.
Ethics Statement
Ethical clearance was obtained from the University of Pretoria’s Built Environment and Information Technology Faculty’s (EBIT) ethics committee to conduct the study, reference number: EBIT/46/2020.
Data Availability Statement
The datasets generated during and/or analyzed during the current study are available from the corresponding author on reasonable request