
Abstract
The testlets are prevalently used in national and international standard tests and the teacher-made achievement tests thanks to their practicality. The purpose of the current study is to evaluate the testlet effect in test consisting the open-ended items and to identify the possible errors when this effect is ignored. The data consists of the scores given by three raters of the responses of 380 students in the teacher training program to two open-ended items in two testlets. The two designs with and without the testlet effect were modeled (totally crossed random design and the nested random design) and the differences between them were analyzed by Generalizability Theory (GT). The results showed that raters had a slight effect on the scores in both models tested, and the reliability of the scores was overestimated when the testlet effect was not ignored in such measurement tools.
Introduction
Open-ended items (“constructed-response”) are question type used to collect data in many measurement tools such as achievement tests, interview forms, or questionnaires. Open-ended items used in standard or teacher-made achievement tests are the item type that student structures an answer by using the processes of applying to information, interpreting, comparing, organizing, and justifying information, and freely expresses this by gathering writing and language skills (Badger & Thomas, 1992; Downing, 2009; Gronlund, 1998; Haladyna & Rodriguez, 2013). Although open-ended items are mostly preferred for formative assessment, their use for assessment is also increasing. Because of its advantages, such as measuring higher order skills, testing companies especially encourage the use of this item type in large-scale and high-stakes testing (Haladyna & Rodriguez, 2013).
Open-ended items have advantages and disadvantages compared to other types. The first of these advantages is that the open-ended items are more effective in assessing high-level skills. This item type makes students think much more, it is mostly preferred in the measurement of the skills at analysis, synthesis, and evaluation level, such as problem-solving and critical thinking (Sanchez, 2013). Studies conducted to measure higher-order thinking have shown that these skills can be exhibited through open-ended items (Brookhart, 2010; Schraw & Robinson, 2011; Silva, 2009; Soland et al., 2013). Its second advantage is that this type of item decreases measurement errors by reducing chance success as there is no option (Bridgeman, 1992). Another advantage is that the answer can be partially graded, contrary to the dichotomously scored items. This allows flexible scoring of the information level of students (Ebel & Frisbie, 1991). Although they are easy to be prepared (Aiken & Groth-Marnat, 2005), their administration and scoring processes are laborious, which is one of their disadvantages. The greatest disadvantage of this type of item is that as a result of the partial scoring, it causes objectively scoring. Even if raters use a detailed rubric, the scores differ among them because of rating behavior (McMillan, 2017; Turgut & Baykul, 2015). This is the most common source of error in open-ended items
The fact that response in open-ended items can be constructed in various format allows them to be used in context-dependent item sets. The item format structured based on a common content is referred to as testlet (Haladyna & Rodriguez, 2013). It is a set of items that are generally used in problem-solving, especially to determine the reactions of students to various stimuli in person tasks or exercises. Wainer and Kiely (1987) proposed the testlets to eliminate problems such as the content balancing, context effect and the item order problem in computerized adaptive tests. Thanks to its benefits for practical applications in education, it is used in many large-scale assessments (PISA, PIRLS, TIMSS, SAT, NAEP, etc.) (Messick, 1994). The items can be mostly grouped in a general stimulus such as reading a passage, a laboratory scenario, a graphic, or a complex problem (DeMars, 2006). The testlets can measure not only the general ability but also a range of special cognitive information processing in complex tasks thanks to their structures (Rosenbaum, 1988). There is no limit in the number of the item within the testlets but Wainer and Lewis (1990) state that the structure of them should be small enough to manipulate and large enough to form its scope.
Testlets are preferred in various test administrations for different reasons. The most significant of them is that it saves time and energy for test developers, item writers, or other stakeholders since it allows the opportunity to answer many items depending on a stimulus (Thissen et al., 1989; Wainer et al., 2000). This is the answer that why the testlets are so much used in national and international large-scale tests. Another reason is that persons are more successful in following the predetermined path such as consecutive questions (Lee et al., 2000). In this sense, it is possible to reveal the mental network of the person in the assessed issue, especially in competitive tests by using the testlet.
Testlet brings the problem of local dependency as a statistical result in unidimensional measurement theories (Sireci et al., 1991; Thissen et al., 1989; Wainer & Kiely, 1987; Wainer & Thissen, 1996). This problem also exists in testlets consisting of open-ended items which structurally contain the rater error. Therefore, in order to increase the reliability of the scores, it is necessary to take measures to minimize these two sources of error in the process of item writing, test administration, and scoring. The main point of the proposed measures is to analyze the items within the testlet with appropriate models and statistical methods that treat as units forming the item-set depending on the context-related nature instead (methods taking into account the testlet effect or item nested-testlet methods) of considering each as a separate item (item-based methods). The statistical appropriateness of the scoring model is another point to be conceived.
One of the measurement theories that consider multiple error sources simultaneously is Generalizability Theory (GT). This theory is a statistical approach based on a variance analysis that can determine the number and magnitude of sources of error in observed scores depending on both separately and the interaction of these sources, and estimate reliability depending on these (Shavelson & Webb, 1991). With these features, GT is cut out for coping with more than one error source in testlet composed open-ended items.
The study aims to examine the change of reliability index in testlet composed of open-ended items under the conditions of including/ignoring the testlet effect. In this direction, two designs with and without the testlet effect were modeled and the differences between them were analyzed by GT. The parameters of achievement test formed testlets consisting of open-ended items including a unit of course in the teacher training program at Sakarya University are estimated with GT. The models in the study are p (person) x r (rater) x i (item) that ignore testlet effect with the fully crossed design and p (person) x r (rater) x (i:t) (item:testlet) with the random nested design. By performing G study, the variances obtained from the two designs and explanation percentage of the total variances were compared, and the change in G and Phi coefficients by increasing and decreasing condition numbers of the facets through D study. The primary purpose of the current study is to evaluate the testlet effect in a test composed the open-ended items and to identify the possible errors when this effect is ignored. The testlets are prevalently used in national and international standardized tests and teacher-made achievement tests thanks to their practicality. To reveal the cases to be conceived in the estimation of parameters resulting from this prevalence is significant. Thus, it is thought that determining and eliminating errors considered in parameter estimation of testlets is of privileged importance for test developers, item writers, and other stakeholders who are interested in test development processes. This study using real data presents new empirical evidence for how the reliability is affected by possible error sources if the testlet effect is ignored and composed of open-ended items
Background
Although open-ended items measure higher-order thinking skills, they have some psychometric issues in the assessment processes. The scoring of these items brings along the risk of being subjective based on the rater judgments. The rater effect/error stem from have a tendency higher or lower scoring than s/he deserve (severity/leniency) (e.g., Eckes, 2005; Liu & Xie, 2014), use the middle categories in the rating scale more (central tendency) (e.g., Engelhard, 1994; Leckie & Baird, 2011; Myford & Wolfe, 2009), and effect from judgment regarding the overall test (halo effect) (e.g., Engelhard, 1994; Kim, 2020). These are a systematic source of variance in the observed ratings of open-ended items (Bimpeh et al., 2020; Kim & Moses, 2013; Myford & Wolfe, 2003). Previous studies have shown that the rater effect cannot be ignored in large-scale assessment, this affects item parameter estimation and the validity of the results, and decreases reliability (Donoghue et al., 2006; Kim, 2009; Koretz et al., 1994; Wang & Yao, 2013).
Several methods that test the rater effect are discussed in different measurement models (Engelhard, 2013). Classical Test Theory (CTT) investigates this problem by calculating the simple percentage of the rater agreement and inter-rater reliability and rater agreement statistic (Cohen’s kappa, Fleiss’ kappa, Krippendorff’s Alpha, etc.). These methods are based on only one error source (Myford & Wolfe, 2000). Generalizability Theory (GT), which is an extension of CTT and variance analysis, has been proposed to eliminate this disadvantage. Apart from these, many methods based on Item Response Theory (IRT) have been presented to determine and correct or control the rater effect (Nieto & Casabianca, 2019; Wang & Yao, 2013): Many Facet Rasch Model (MFRM; Linacre, 1994) (the most popular and known among them), the hierarchical rater model (HRM; Patz, 1996), the rater bundle model (Wilson & Hoskens, 2001). In MFRM, like GT, it handles all sources of variability that affect the scoring together and estimates scores by separating the effects of each variable unlike other methods (Eckes, 2019).
Testlet is another concept addressed in the study, and its sources of error should be explained to understand the framework of the study. The advantage of testlet that structuring a subset of items by sharing the common stimulus also brings along the problem of violation of the local independence assumption of the IRT (Li, 2017; Sireci et al., 1991; Wainer & Thissen, 1996; Yen, 1993). Mainly, local independence means that a response to an item in the test should not be affected by other items when an ability is conditioned/controlled (Hambleton & Swaminathan, 1985). Previous studies have demonstrated that violation of local independence leads to imprecise person ability and item parameter estimation, overestimated test reliability scores, and errors in scaling, test equating, and calculation of standard error of measurement (Jiao & Zhang, 2015; Jiao et al., 2012; Sireci et al., 1991; Tao & Cao, 2016; Wainer et al., 2007). Lee and Park (2012) stated that the degree of overestimated test reliability scores differed in previous studies, the practical importance of this was discussed and this overestimation causes crucially errors of interpretation in high stake tests.
To overcome this issue, different methods were used under GT and IRT theories in testlet literature. GT suggested a solution with the help of using the concepts of crossed and nested design together: persons (p) crossed with items (i) nested in testlet (t) design [px (i: t)] (Lee & Frisbie, 1999). Thanks to GT, this problem can be overcome by using raw scores (Li, 2017). Another solution is to employ a polytomous IRT model by considering all items within the testlet as a single multi-scored item (Lee et al., 2001). However, this procedure brings with its possible disadvantages such as loss of information at the item level (Wainer et al., 2000, 2007; Yen, 1993). Apart from that, the local dependencies of the item within the testlet were modeled as a general random effect in the IRT approach (Li, 2017), for example, bi-factor model (Gibbons & Hedeker, 1992), the multilevel model (Jiao et al., 2005), testlet response theory (TRT) models (Bradlow et al., 1999; Wainer et al., 2007).
Various studies have been carried out to evaluate the rater effect with different models based on measurement theories in scoring open-ended items. (Cor & Peeters, 2015; Güler, 2014; Leckie & Baird, 2011; Nieto & Casabianca, 2019; Toffoli et al., 2016). In addition, the performances of the methods on this subject were compared with each other, especially GT and IRT models (e.g., Kim & Wilson, 2009; Lee & Cha, 2016; Sudweeks et al., 2004). Kim and Wilson (2009) compared two well-known and frequently used analyzing methods (GT and MFRM) deal with the rater effect. They concluded that both methods have pros and cons, and they are worthwhile in obtaining more reliable scores. Regardless of the model and theory, it was found that the raters affect the scoring and this also affects the reliability of the scores. For example, Toffoli et al. (2016) study evaluated the scoring quality of the responses given by 350 students to two open-ended items scored by 42 raters using the Many Facet Rasch model. The results of the study showed that although the raters received training course, the scoring severity of the raters differed significantly. Similarly, in recent studies addressing this subject with the GT, it has been observed that raters and their interaction with other factors (e.g., task, items, time) is a variance component of varying magnitude in scoring. These studies also revealed that more raters are needed for higher reliability estimation (Atilgan, 2019; Bouwer et al., 2015; Kim et al., 2017; Zhao & Huang, 2020).
In the literature on testlet, a number of studies were documented in which the item parameters of testlets were estimated and the reliability of the scores obtained from them was examined by employing the above-mentioned different approaches (Eckes, 2014; Eckes & Baghaei, 2015; Li, Li et al., 2010; Paap et al., 2015; Ravand, 2015; Shaw et al., 2020). Also, these issues have been addressed in many studies within the scope of GT (Chien, 2008; Kaya Uyanık & Gelbal, 2018; Lee, 2000; Lee & Frisbie, 1999; Lee & Park, 2012). Among them, a key study by Lee and Park (2012) compared the methods under GT and IRT framework using simulation data in calculating the reliability of the test scores constructed testlets. These methods are classified as item score (item-based), testlet score, and item nested-testlet approaches for both measurement theories. The results reported that the item-based methods produced the highest error and the methods in IRT overestimated more than those in GT under the same approaches. Starting from this result, it can be stated that GT makes the most accurate estimation when multiple error sources are considered together in scores. Therefore, GT proposing a solution to both the testlet effect with nested and crossed designs and the rater effect on open-ended items are the main reasons for its use in this study.
GT allows to making relative and absolute decisions for the measurement object. The variance sources of the measurement object are considered as relative and absolute sources. G and Phi coefficient is used for relative and absolute evaluation, respectively (Brennan, 2001). G coefficient regarded as the ordering of the measurement object and other measurement objects in line with each other. In this sense, it is similar to CTT’s reliability statistics. However, Phi coefficient is more robust than G coefficient, and it is calculated by considering all of the error variances (Güler, 2009).
Reliability in GT is examined with two different phases called Generalizability (G) and Decision (D) study. In G study, it is dealt with generalizations starting from the universe from allowable observations to the whole universe, so it is aimed to provide information on the sources of variance in the sample as much as possible. In D study, scenarios are formed in line with a specific purpose by using the information obtained in G study and it is aimed to make some decisions about these scenarios (Brennan, 2001; Güler et al., 2012).
Another issue that should be known in GT, is the design of facets (crossed or nested). The crossed design means that all of the conditions of a facet are associated with all of the conditions of the other facet. The nested design is the one that a condition of a facet is paired with some conditions of the other facet. The presentation of these designs is different well: the crossed and nested design are represented by “x” and “:,” respectively (Shavelson & Webb, 1991).
In literature, there are many studies that the reliability of the scores of the test composing of open-ended items are estimated by GT, and the performance of these is compared with CTT (correlation coefficient, agreement statistic, etc.) and IRT based methods (Atilgan, 2019; Bouwer et al., 2015; Cor & Peeters, 2015; Donnon & Paolucci, 2008; Zhao & Huang, 2020). Moreover, there are several studies that the parameters of testlets are obtained by using GT (Chien, 2008; Kaya Uyanık & Gelbal, 2018; Lee & Frisbie, 1999; Lee & Park, 2012; Tsai et al., 2012). As stated in the aforementioned studies, although many studies examining the testlet and rater effect are handled in various models in the framework of measurement theories, there was little, if any, the studies that investigate the testlet effect and estimate the parameters of the open-ended testlets with real data, by GT. Therefore, the motivation of the current study is to analyze the testlet effect in the whole above-discussed framework. This study has two values that should make an important contribution to the educational measurement and testing field. The first is that, unlike most studies, it uses real data instead of simulation data to examine the rater and -in particular- the testlet effect. The other one draws special attention to how the reliability of scores is changed/affected by ignoring the testlet effect and including the rater effect based on an example in a non-high-stakes achievement test for higher education.
Methods
Participants
The current study was conducted on 380 university students studying teacher training programs at Sakarya University. All of the students received the lesson of Measurement and Evaluation in Education from the same lecturer in the fall term of 2018. Demographic information of the students who participate in the study is given Table 1.
Demographic Characteristics of Participants.

When Table 1 is examined, it is observed that 80.5% of the participants are females and 19.5% males. The data were obtained from the students of four different departments. These departments are Science Education (17.3%), Pre-school Education (31.8%), Guidance and Psychological Counseling (37.6%), and Turkish Language Education (13.3%).
Instrument and Procedures
This study data was collected with an achievement test (totally four items) structured as two open-ended within two testlets. This test was developed by writers to measure higher-order thinking ability and include a unit of the course, Measurement and Evaluation in Education. This unit is suitable for preparing items that allow applying the acquired knowledge to real context, analyzing, and evaluating the problem, and offering creative solutions. The details of test development phases are as follows;
Two lecturers, who are specialists on the field of measurement and evaluation, write many items in form of testlets. It was assumed that these items, which measure higher-order thinking skills, may have some error sources and these sources were eliminated as much as possible to include another error source in the scores.
These items were reviewed for clarity, the suitability of content, and after the necessary improvements were made, it was decided to include these two testlet in the test.
The test form comprised of two testlets was applied with pilot administration.
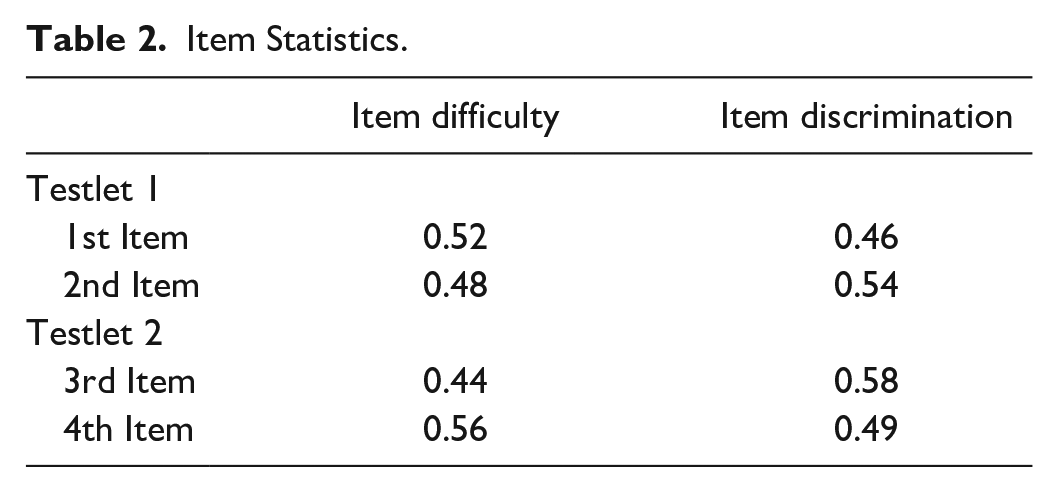
After this, item difficulty and item discrimination values were calculated for each item in the testlets. The discrimination index computed was D-index. These values are given in Table 2.
When Table 2 was examined, it was seen that the four items had moderate difficulty and their discrimination is above 0.30. Depending on these findings, it was decided to include all of the items in the achievement test.
The final test formed of four items was obtained.
Item Statistics.
The final test was administrated to 380 students whose demographic characteristics were given above. Then, the three raters polytomously scored the responses of all students to four open-ended items with an analytical rubric. These raters are experts in the subject, Measurement and Evaluation in Education, and lectured this course for at least two semesters. This rubric used was designed by three psychometricians to score each item in the testlet between 0 and 10. It is used in the same way in both pilot and final administration.
Data Analysis
The data obtained from the study were analyzed within the framework of generalizability theory. The data consists of the scores given by three raters of the responses of 380 students to two open-ended items in two testlets. Since each rater scored all items, the data are also suitable for the crossed design. Also, there is no missing value in the data matrix. With generalizability theory, pxrxi, crossed random design, which ignored testlet effect, was formed and pxrx (i:t), nested random design, which considered testlet effect, was formed. The two designs formed were compared for main and common effects, variance values, and test reliability. Furthermore, prospective scenarios were made by performing Decision (D) studies. As a result of the applications, EDUG program (Swiss Society for Research in Education Working Group, 2006) was used to make all the generalizability theory analyses that include the calculation of the reliability of scores with G and Φ (Phi) coefficients and in prediction of variance values for main and common effects based on generalizability theory. It is a user-friendly program developed by Jean Cardinet in 1996 for performing generalizability theory analyzes by allowing the use of raw scores or sums of squares (Cardinet et al., 2010)
Results
Findings for Crossed Random Design (pxrxi)
The results obtained from pxrxi crossed random design are given in Table 3.
Estimated Variance Values by G Study on pxrxi Crossed Random Design and Percentage of Estimated Variances Accounted for Total Variance.

When the predicted variance and rates of variances accounted for the total variance as a result of pxrxi crossed random design G study are examined, the variance component (7.44) predicted for the main effect of person (p) explains 66% of the total variance. In generalizability studies, main effect of person is evaluated as universe score variance and states difference between persons in terms of the trait measured (Brennan, 2001; Güler et al., 2012; Kaya Uyanık & Güler, 2016; Shavelson & Webb, 1991). The fact that the rate of the predicted variance for students in the total variance is great is a wanted status. This is an indicator that some differences may appear between persons at the dimension obtained with measurement (Brennan, 2001; Kaya Uyanık & Güler, 2016). According to the result obtained in this study, it can be said that measurement process performed with open-ended items can greatly reveal the difference between persons. The variance component predicted for rater main effect (0.29) explains 2.6% of the total variance. This value is the lowest third value. Rater main effect is resulted from the inconsistency between the scorings of the raters. Thus, the fact that this effect is low is a wanted status. The variance component (0.0019) predicted from G study for item (i) main effect explains 0.01% of the total variance. Item main effect displays the differentiation grade of each measurement unit (item) difficulty level in the open-ended items. In line with the result obtained, it can be interpreted that the difficulty levels of the items applied to the students are very close to each other.
Person x rater (pr) common effect (1.55) explains 13.7% of the total variance and this value is the highest second value. The interaction between person and rater states that the raters have some inconsistencies about generosity-rigidity in scoring for some persons. Although the raters generally give consistent results, there are some differences between scorings in some students. Person x item (pi) common effect (1.07) shows 9.5% of the total variance and it is the highest third variance. This displays that the relative situations of some students differ from one item to the other. Similarly, it can be said that to answer the open-ended items correctly differs from one student to another. Rater x item (ri) common effect states 0.1% of the total variance. This value is the lowest second variance. It can be interpreted that there is no difference between the raters according to items for this result. The explanation rate of the variance component (0.94) of person x rater x item (residual) common effect for the total variance is 8.3%. The fact that the residual variance is high, is an indicator that person, rater, item interaction, immeasurable variability sources and/or random errors are great. When the values obtained are examined, it is observed that the random error rate is low for this study.
Variance values calculated over the data used in G study are employed for the decision to be made in D study. D study allows to respectively predict G and Phi coefficients for relative and absolute decisions by decreasing and increasing facet conditions in G universe. At the same time, if G and Phi coefficients are calculated over the facets including condition at the same number with facet conditions in G study, reliability values of the data in G study are obtained as well. In Table 4, G and Phi coefficient values calculated by decreasing and increasing rater number and holding item facet still in D study, and G and Phi coefficient values calculated by decreasing and increasing item number and holding rater facet still.
Results of D-Study for pxrxi Crossed Random Design.

Note. The number of items and raters for the current study’s condition are presented in bold.
In Table 4, G and Phi coefficients of the present status of the study are displayed in a bold. In the study, there are four items in total in the achievement test formed of the open-ended items, and these items are scored by three raters. In this case, G coefficient is 0.895 and Phi coefficient is 0.885. It can be said that the measurement instrument used is reliable. When the scenarios are examined, it is observed that as rater number increases, reliability value increases as well when item number is held still and rater number is changed. Similarly, when rater number is held still and item number is increased, reliability value increases as item number increases. The highest reliability value was obtained from the scenario that the item number was four and the rater number was six.
Findings for Nested Random Design pxrx (i:t)
The results obtained in the nested random design pxrx (i:t) are given in Table 5.
Estimated Variance Values by G Study on pxrx (i:t) Nested Random Design and Percentage of Estimated Variances Accounted for Total Variance.

As a result of pxrx(i:t) nested random design G study given in Table 5, the predicted variance and total variance explanation rates are examined, variance component predicted for person (p) main effect (7.58) explains 65% of the total variance. As it is previously revealed, in generalizability studies, the fact that the rate of the predicted variance for person main effect in the total variance is high, is a wanted case. This displays that differences between persons can be revealed at the dimension obtained with measurement (Brennan, 2001; Kaya Uyanık & Güler, 2016). According to the result obtained in this study, it can be said that the measurement process performed with the open-ended items can greatly show the difference between persons. In addition, when the variance value obtained in consideration of testlet effect is higher than the one obtained when the variance value is disregarded. Accordingly, it can be stated that the testlet effect can disclose person differences very much. The variance component predicted for rater main effect (0.28) explains 2.4% of the total variance. The fact that this effect is low, can be interpreted that the inconsistency between scorings of the raters in measurement instruments with testlet. The variance component predicted from G study performed for testlet (t) main effect (0.0027) reveals 0.001% of the total variance. The main effect of the testlet refers to the measure of the change in the difficulty of the testlet. It can be seen from Table 5, this effect can be interpreted as exceedingly small since their difficulty levels very close to each other.
Item: testlet (i:t) common effect (0.0001) explains % 0.001 of the total variance. This value shows the differentiation of the nested items in the testlet and according to the values obtained, this differentiation is not observed. Person x rater (pr) common effect (1.45) discloses 12.4% of the total variance and this value is the highest second one. The interaction between person and rater states that the raters have some inconsistencies about generosity-rigidity in scoring for some persons. Although the raters generally give consistent results, there are some differences between scorings in some students. Person x testlet (pt) common effect (0.44) shows 0.001% of the total variance. This displays that the relative situations of some students do not differ from one item to the other. Rater x testlet (rt) common effect (0.01) explains 0.1% of the total variance. It can be interpreted that there is no difference according to testlets between the raters for this result.
The total of the four common effects in pr (i:t) design that the raters score all of the students and each student answers each testlet and the items are nested in different testlets, is called residual effect. The explanation rate of the common effect variance component for the total variance is 20.4%. The fact that the residual variance is high, is an indicator that person, rater, testlet, item interaction, immeasurable variability sources and/or random errors are high. When the values obtained are examined, it is observed that there are random errors for the study performed.
For p xr x (i:t) design, decision studies were performed that different scenarios were made, and G and Phi coefficients were obtained. The scenario studies are as follows;
Rater number (3) and item number in testlets (2) were held still and the testlet number were increased and decreased.
Rater number (3) and testlet number (2) were held still and the item number was increased in the testlets.
Testlet number (2) and item number (2) were held still and the rater number was increased and decreased.
In Table 6, there are G and Phi coefficients obtained from the scenarios given above.
Results of D-Study for pxrx(i:t) Nested Random Design.
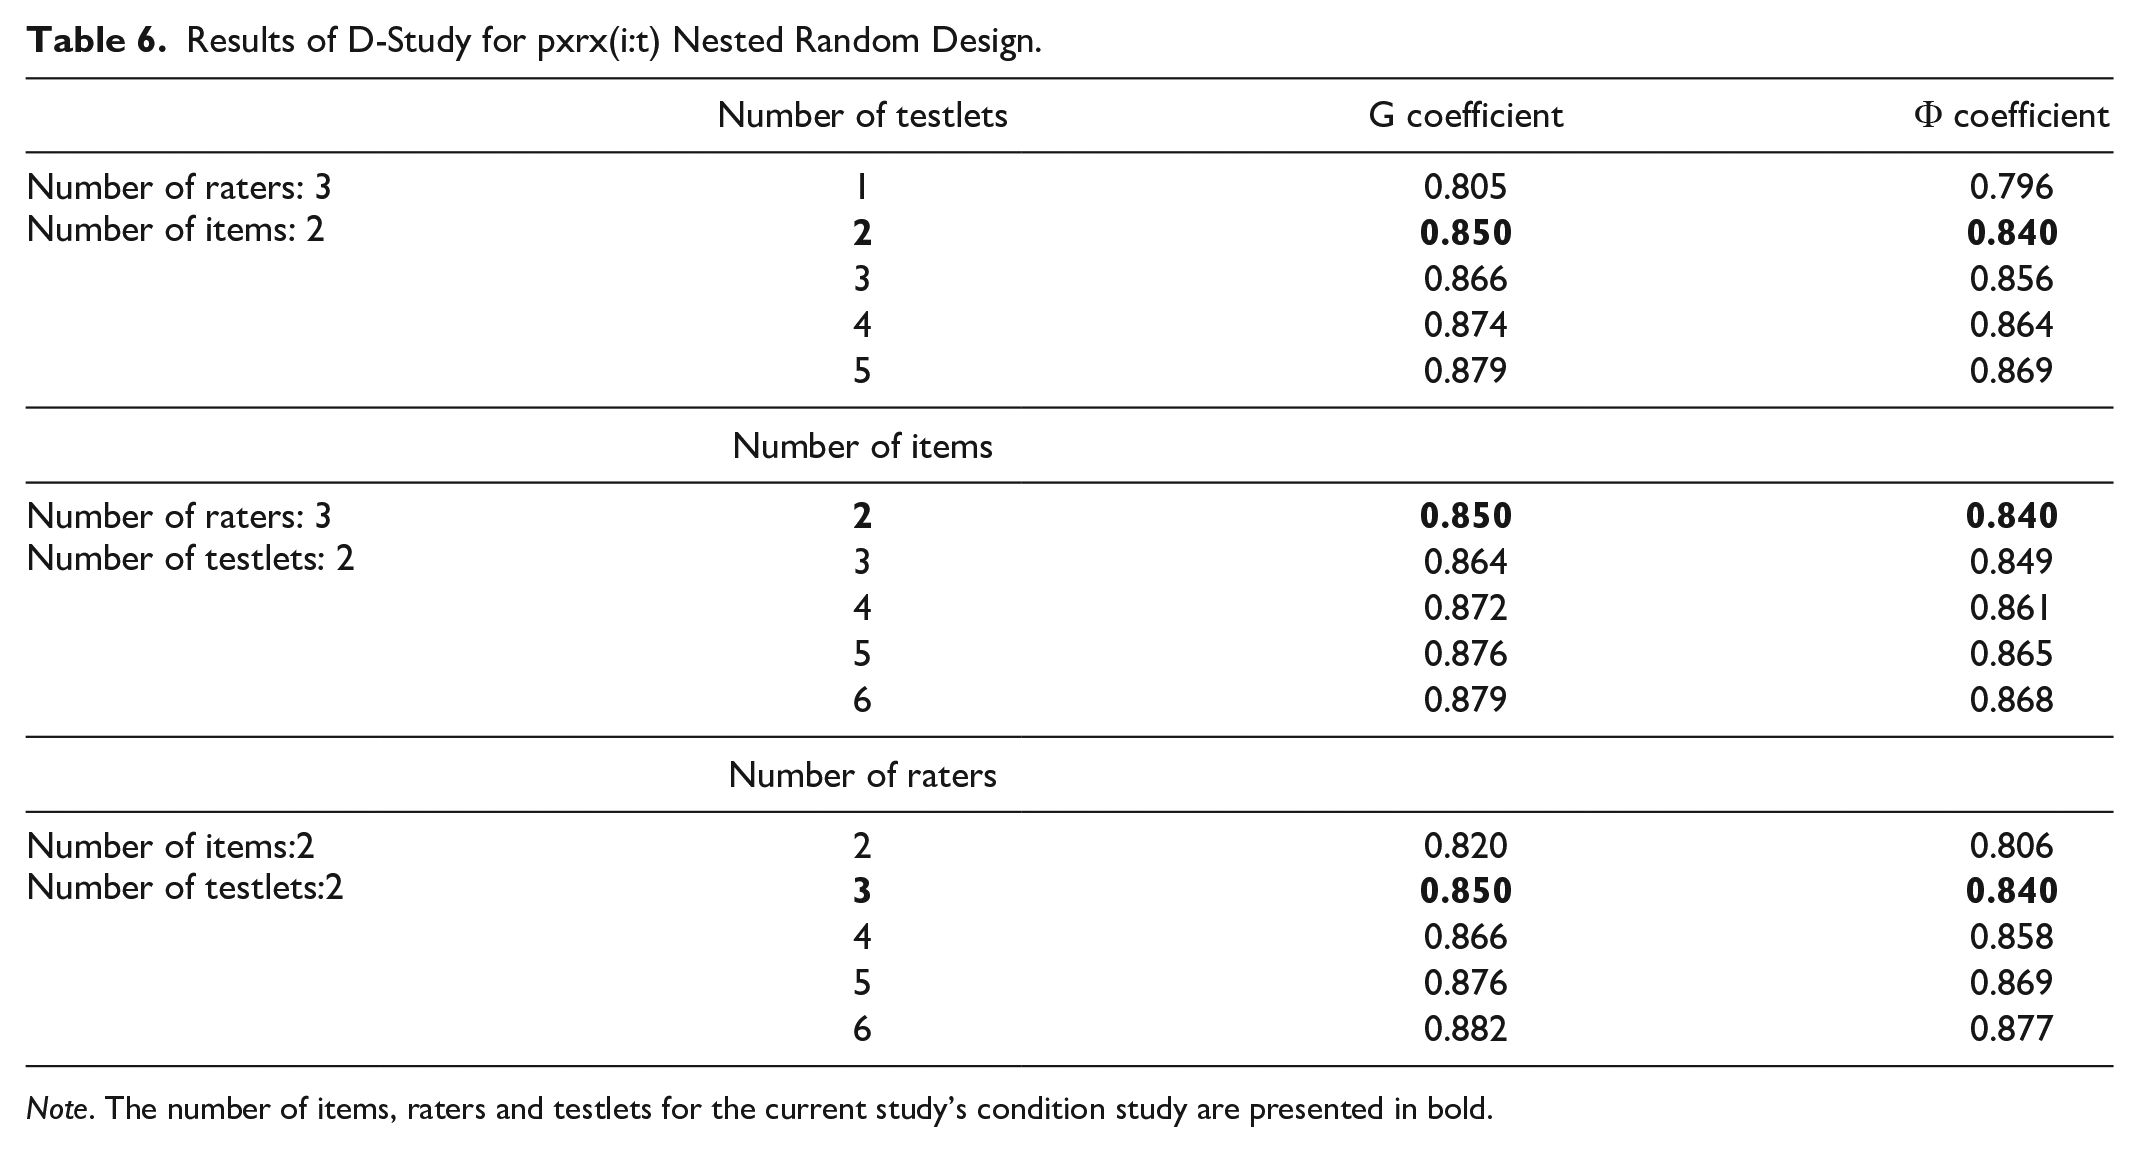
Note. The number of items, raters and testlets for the current study’s condition study are presented in bold.
In Table 6, G and Phi coefficients about the present status of the study are displayed in bold. In p xr x (i:t) nested random design, there are four items in total in the achievement test comprised of the open-ended items and these items are nested in 2 testlets, all of the testlets are scored by three raters. In this case, G coefficient is 0.850 and Phi coefficient is 0.840. It can be said that the measurement instrument including testlet is reliable. When the scenarios made are examined, it is observed that when the rater and item number is held still and the testlet number is changed, reliability value increases as the testlet number increases. Similarly, when the rater and testlet number is held still and the item number is increased, reliability value increases when the item number increases. When the item number and testlet number is held still and the rater number changes, reliability increases as the rater number increases. The highest reliability value was obtained from the scenario in which the testlet number was two, the item number was two and the rater number was six (0.882).
When the data set used in the study is compared to the reliability coefficients obtained, it is seen that G (0.895) obtained with p x r x i design and Phi (0.885) coefficients are higher than G obtained with p x r x (i:t) design (0.850) and Phi (0.840) coefficients. This shows that the reliability calculated by ignoring testlet in measurement instruments with testlets will be higher than the real reliability value, therefore, it is required to consider the testlet effect in the calculations of reliability.
Discussion and Conclusion
In this study, it is aimed to examine the reliability coefficients of the open-ended questions in testlets. In line with this aim, two designs were formed in which the testlet effect was ignored and not ignored, and the differences between them were examined through Generalizability theory. With this theory, pxrxi crossed random design, which disregard the testlet effect, and pxrx (i:t) nested random design, which considered the testlet effect, were formed. The two designs formed were compared in terms of variance values and the reliability of the test for main and common effects. Furthermore, progressive scenarios were created by making Decision (D) studies.
When the two designs were examined for variance sources, it was seen that the largest source of variance was the person. This clearly shows that the achievement test is sufficient in measuring the abilities. Considering the use of open-ended items in the study, this result indicates that such items are an effective option to assess the abilities and achievements. Coincidentally the effectiveness of open-ended questions in revealing how the information is formed in the students and their success in measuring high-order skills is often emphasized in the literature (Haladyna, 1997; Lee et al., 2011; McMillan, 2017).
Similarly, another important source of variance for both of the designs is the common effect of rater and person. The interaction between person and rater indicates that the severity/leniency of raters in scoring for some people is inconsistent. In this case, it was concluded that the raters scored some students unstable. This result revealed the possible disadvantage in rating open-ended items. These results support previous research examining the rater effect on constructed response items (Cor & Peeters, 2015; Leckie & Baird, 2011; Temizkan & Sallabaş, 2011; Toffoli et al., 2016). The results of Temizkan and Sallabaş (2011) study support this finding, and they explained that when scoring open-ended items, features that are not actually measured can interfere with scoring. In the studies that especially other item types and open-ended item are compared, there are results to support this finding (Beller & Gafni, 2000; Birgili, 2014; Hancock, 1994; Rauch & Ve Hartig, 2010). As stated in the Background section, the reasons for this are the increased use of the middle rates in scoring and the judgments regarding the whole test. To minimize these errors of rater, the practices such as training possible scorers or scoring via computer interface are recommended (Swartz et al., 1999; Wolfe & McVay, 2010; Wolfe et al., 2010).
While in the crossed design, in which the testlet effect is disregarded, the residual variances 8.3%, in the nested design, in which the testlet effect is considered, this variance value is 20.4%. The fact that the residual variance is high, displays that the non-measurable variability sources and/or random errors are high. When the values obtained are examined, random error is low if the testlet effect is ignored and random error is high if it is considered. This is supported by reliability coefficients. The reliability coefficients obtained for three facet crossed design are (G = 0.895; Phi = 0.885) and the reliability coefficients obtained for four facet nested design are (G = 0.850; Phi = 0.840). In the model in which the testlet effect is not considered, the random error of the scores is underestimated, so the reliability is calculated higher than it should be. This finding broadly supports the previous studies in this area examining the effect between testlet and reliability. (Hendrickson, 2001; Lee, 2000; Lee & Park, 2012; Teker & Dogan, 2015). As reported in the Background section, Lee and Park (2012) similarly found that item-based methods have greater overestimation than item nested testlet methods in both IRT and GT. They explained one of the reasons for this situation as the dependency relationships among the items within the testlet rises, the size of the overestimation for the reliability of the scores increases in item-based methods.
In the study, Decision studies were performed for pxrx (i:t) nested design in which the testlet effect was considered. As a result of the study, it was observed that the reliability increased as the testlet number and item number increased. Accordingly, it is recommended that in the open-ended tests including the testlets, many more testlets and items should be used. These results are in agreement with the findings of Kaya Uyanık and Gelbal’s (2018) study which showed that the reliability of score increased depending on the number of items. In addition, they suggested that the number of items in testlet and testlets should be as high as possible.
When the findings of the study are carefully examined, it is observed that the highest reliability value is obtained from the scenario (0.882) that the testlet number is two, the item number is two and the rater number is six. In this case, it can be asserted that the most significant element that affects the reliability for the open-ended questions is the rater. In this sense, it is highly recommended to use many raters in scoring the open-ended questions. However, the increase in the number of raters does not mean that the rater effect on the scores has been completely eliminated. Toffoli et al. (2016) study showed that despite scoring by 42 raters, rater scores differ significantly.
Finally, in this study, it is clearly presented that the testlet effect cannot be ignored in the reliability estimates of the scores for the test composed testlets. Hence, this result concerns it concerns stakeholders who prepare and use these tests. As Paap et al. (2015) point out, if item authors and test developers plan to minimize this effect when using testlets, it would be useful to carefully evaluate the properties of the common stimulus in this testlet. In addition, the dependencies of the items in the testlet can be considered during the item writing and test design stages. Since the Decision (D) study conducted in this study shows that the increase in the number of items and testlets rises the reliability, this situation can be taken into consideration while developing a test. If item sets consisting of open-ended items are used, the practices (such as rater training) that will eliminate the rater effect in scoring should be administrated. Beyond these, models that conceive the testlet effect should be employed for the estimation based on these items. Although it is a straightforward method, the use of item-based methods should be avoided. The current study has some limitations. First, in this study, two testlets consisting of four items in total were applied. The number of items within testlet (since nested design is used) and testlets was limited. Second, the achievement test used in this study content only one unit. Therefore, it is a limitation that the items consist of similar theme. Last, most importantly, the gender ratio of the participants in the study is unbalanced. The gender effect may be a concern for impacting results in this study. Therefore, future researches using a measurement tool that is a more comprehensive achievement test consisting of more items and testlets, and having balanced demographic characteristics of the participants may be designed.
Footnotes
Declaration of Conflicting Interests
The author(s) declared no potential conflicts of interest with respect to the research, authorship, and/or publication of this article.
Funding
The author(s) received no financial support for the research, authorship, and/or publication of this article.