
Abstract
We examine how corporate social responsibility affects financial performance in the Korean market by examining a new set of data, the ESG score. Using panel regression models, we show that the ESG score is negatively related with a widely used measures of financial performance, ROA and Tobin’s Q, unlike extant studies arguing for the positive relationships. Among the three pillars of ESG performance, the social and governance scores robustly show negative relationships with ROA but the environmental score does not. The consideration of unique Korean governance structure, chaebol, does not change our findings. Our findings generally support the traditional view of corporations but argue against the stakeholder theory.
Introduction
Corporations have recently been encouraged to invest more resources to make their decisions more socially responsible. A corporation’s engagement in corporate social responsibility (CSR) becomes a growing interest. Some CEOs have recognized this concern and have devoted their resources to promote CSR. Other CEOs have argued that investment for CSR activity does not maximize the shareholder value of their corporations. Such a controversy has led a number of researchers to examine the relationship between CSR and financial performance by using a variety of samples and empirical methodologies.
However, a definite relationship between CSR and financial performance has not been fully uncovered, even though a number of prior studies have tried to do so. For example, Peloza (2009) showed that more than 30% of published articles reported a negative or inconclusive relationship, while a majority of studies (68%) found a positive one. These mixed results suggest that the examination of the CSR-profitability relationship relies substantially on the selection of data and the adoption of empirical strategies.
Despite a number of studies on CSR-profitability relationship, there is a limited number of researches in developing market including Korea. In this paper, we deliberately choose the Korean market since the market is ideal to test firm heterogeneity in the aspect of CSR and firm profitability. In particular, a unique set of family-owned business conglomerates, chaebols, dominate a national economy and wields influences over the market, while co-exist with other firms. The chaebols have grown in terms of size and market power, thanks to the long support of government; however, they have come under wide criticism because of their political scandal, which led to the increasing needs of their reformation. In this atmosphere, the practice of CSR has become major agenda of chaebols, which we would further discuss in analysis.
We examine this CSR-profitability relationship in the Korean financial market by employing a new set of data and by adopting a panel regression approach. To be specific, we employ a panel regression methodology to control for unobserved firm heterogeneity which may result from correlation between observed and unobserved firm-specific variables. Previous studies on CSR-profitability suggest that the inconsistency in their results may be due to their adaptation of different methodologies. For example, the studies which used linear regression (Garcia et al., 2017; Mulyadi & Anwar, 2012; Ningsih et al., 2022), find that the relationship between CSR and firm performance is either negatively related, not significant or even different across the measurement of firm value. We believe that a panel regression methodology could minimize the inconsistency found in those previous studies which could be due to endogeneity problem.
In particular, we use the ESG scores published by the Korean Corporate Governance Service, which cover a more comprehensive set of listed Korean corporations compared to the widely used KEJI index. This use of ESG scores provides new benefits as well; it allows us to easily categorize CSR performances into environmental (E), social (S) and governance (G) scores as well as to measure the overall CSR performance of a corporation. From the perspective of econometric model, our panel regression approach controls for firm-level fixed effects; the extant CSR-performance literature has largely ignored the significance of firm fixed effects, while a variety of recent studies in CSR activity take account of its effect.
To be specific, we employ a sample of publicly listed Korean corporations from 2011 to 2020. We obtain firm-level financial statements from the FNguide database and adopt the ESG scores published by the Korean Corporate Governance Service. The overall ESG score is considered as our main CSR measure, while the environmental, social, and corporate governance scores are separately analyzed as well. Firm-level financial performances are measured by return on assets (ROA), return on equity (ROE) and Tobin’s Q. A panel regression model with firm fixed effect is used as our benchmark econometric model. By uniquely looking at the relationship between CSR measures, and accounting, market-based measurement of each financial performance, we believe that this would partly resolve “cause and effect” between our key variables. Further, this analysis would reveal whether CSR performance of Korean firms is in accordance with specific financial performance by examining the three major financial performance measures.
Our main findings are as follows. First of all, we find a robustly negative relationship between CSR and financial performance in the Korean corporations, when the total ESG score is used to proxy CSR. This total ESG score robustly shows a negative relation with the ROA and Tobin’s Q variable after controlling for other firm-level covariates. This result remains stable to the consideration of potentially non-linear relationship between firm size and financial performance.
Next, we find that the components of social and governance performance drive such negative relationship between CSR performance and the ROA variable. In fact, all of the three pillars of CSR performance variables turn out to have significantly negative relationships with the ROA and ROE measures. However, if we include all three variables altogether in the empirical models, the social and governance performances are negatively related to the ROA variable but the environmental performance is not. Furthermore, the relationship between CSR performances and ROE becomes statistically insignificant after the inclusion of all three variables in the model.
Third, we argue that the unique Korean governance structure, a special type of family-owned conglomerate, chaebol does not influence our results significantly. Because the adoption of CSR is widely expected to have strong relationship with governance structure, the affiliations to chaebol may have significant effect on the relationship between CSR and financial performances. However, our findings remain unchanged whether we limit the sample of examination to chaebol affiliates or not. (Results are available on request.)
Our results contribute to the literature in a number of aspects. Most of all, we provide new empirical evidence arguing for a negative relationship between CSR and financial performance, when ROA is employed as financial performance measure. This finding is well aligned with the traditional view of corporation (Friedman, 1962, 2007) that socially responsible activities tend to raise operational costs and thus decrease corporate profitability. However, our finding is not aligned with the stakeholder theory of corporations emphasizing the positive relationship between a firm’s social contribution and profitability; our estimation results limitedly support the stakeholder theory.
Our work adds new dimensions to the literature that has examined the CSR-profitability relationships in the Korean financial market. Most of all, in terms of CSR proxy variable construction, we adopt the ESG score rather than the KEJI index that has been widely used in the literature. The KEJI index covers only a very limited sample of corporations in the Korean financial market (200 firms) and is suspected to include an operating performance component in the index construction (Cho & Park, 2015). The use of ESG score overcomes such shortcomings from using the KEJI index.
Furthermore, this negative CSR-ROA relationship shown in our estimation differs markedly from prior evidence in the Korean market. Most existing studies have argued a positive CSR-profitability relationship (e.g., J.-I. Jang & Choi, 2010; Kim & Wee, 2011) by using the KEJI index. In the extant studies, a negative relationship is very restrictively observed when a specific component of the KEJI index (e.g., the employee satisfaction index) is examined or a particular profitability measure is adopted, such as Tobin’s Q (Na & Hong, 2011). In contrast, we robustly confirm negative relationships between CSR and ROA in our panel regression models.
Finally, our findings contradict recent studies highlighting the implications of chaebol structure on CSR policies. For example, Yoon et al. (2018) argue that the valuation effect of ESG performance is stronger especially in terms of governance area. Yoon et al. (2021) also argue that the negative relationship between ESG performance and the tendency of tax avoidance occurs only within the group of chaebol-affiliates. Unlike this set of studies, we find no clear distinction of the results across chaebol and non-chaebol affiliates, which robustly confirm the negative relationship between CSR and ROA. Our result is also robust to the firm samples based on their asset size (Results are available on request.)
This work proceeds as follows. In Section “Literature and Context,” we review the literature. Section “Data and Methodology” contains the description of data and empirical models. Section “Data Analysis” provides our empirical results and Section “Discussion and Implications” illustrates the empirical results for chaebol affiliates. and provides implications.
Literature and Context
Theory
There have been ongoing debates about how CSR is related to corporate financial performance. On the one hand, the stakeholder theory predicts that CSR is positively related to financial performance (Freeman, 1984). By engaging in socially responsible behaviors such as saving energy or enhancing labor rights, a corporation can benefit from increased labor productivity, a broader consumer base, and a growing corporate reputation. Such benefits are naturally captured by a corporation’s financial performance as well. On the other hand, the traditional view provides opposing implications (e.g., Friedman, 1962, 2007). This traditional view emphasizes that corporate investment in socially responsible activities tends to increase operational costs. Such additional costs are in conflict with a corporation’s goal of profit maximization, which expects a negative effect of CSR on financial performance
There is also a number of management theories which explain the relationship between CSR and firm profitability. For example, agency theory assumes that firm managers act on self-interest and opportunistic behavior, rather than the welfare of stakeholders (Jensen & Meckling, 1976). According to the theory, principal, who is either owner or stakeholders, delegate authority to firm manages, but the delegation would only create information asymmetry which would eventually make conflicts between the principal and agent. In this respect, if a firm manager only adheres to the maximization of the value of firms, which link to his/her managerial reputation in short run, this could create conflict with the stakeholders, as they may prioritize CSR activities which is a long-term strategy for the sustainability of the firm.
A signal theory argues that firm’s voluntary disclosure of “unobservable attributes” which may directly relate to the firm value, may provide signals to stakeholders through communications and actions (Spence, 1973). In this theoretical aspect, the practice and report of CSR activities may be viewed as enhancing firm transparency and reputation (Othman et al., 2011) Lastly, an institutional theory suggests that a firm’s practice of CSR is “within a wider field of economic governance characterized by different modes, including the market, state regulation and beyond,” rather than a “voluntary (firm) action (Brammer et al., 2012).” In this theory, the systematic needs for firms to adopt and promote CSR practices would “subordinate” firm managers to the interests of stakeholders.
Empirical Evidence
There have been ongoing debates about how CSR is related to corporate financial performance. On the one hand, the stakeholder theory predicts that CSR is positively related to financial performance (Freeman, 1984). By engaging in socially responsible behaviors such as saving energy or enhancing labor rights, a corporation can benefit from increased labor productivity, a broader consumer base, and a growing corporate reputation. Such benefits are naturally captured by a corporation’s financial performance as well.
On the other hand, the traditional view provides opposing implications (e.g., Friedman, 1962, 2007). This traditional view emphasizes that corporate investment in socially responsible activities tends to increase operational costs. Such additional costs are in conflict with a corporation’s goal of profit maximization, which expects a negative effect of CSR on financial performance.
While there are two major strands of empirical literature to test the aforementioned theories, neither provides conclusive results about the relationship between CSR and financial performance. The first strand of literature focuses on the short-run financial impact of CSR, analyzed by event study methodologies. This literature has examined the short-run abnormal returns from a corporation’s engagement in socially responsible/irresponsible acts. For instance, Posnikoff (1997) documented a positive correlation, but Wright and Ferris (1997) found a negative one. Teoh et al. (1999) reported no consistent relationship between CSR and corporate performance.
The second strand of literature has mainly examined how corporate social responsibility measures are associated with long-term accounting measures of financial performance. For example, Aupperle et al. (1985) showed no statistically significant relationship between CSR measures and financial performance. In contrast, Waddock and Graves (1997) confirmed a positive correlation between an index of CSR and performances measures based on accounting profits, for example, ROA. In addition, McGuire et al. (1988) and Waddock and Graves (1997) argued that CSR affects financial performance more significantly in subsequent periods. DasGupta (2021) finds a positive influence of financial performance shortfall on firm’s ESG performance, but when these firms are constrained by high levels of ESG controversies, they would be less likely to engage in higher ESG practices. Employing all three pillars of ESG along with overall ESG score by using unique sample of “100 best corporate citizens” in the United States declared by 3BL Media between 2009 and 2018, Qureshi et al. (2021) examine the ESG performance and financial performance, measured by ROE and ROA. They confirm the relationship of ESG score and financial performance for ROE only.
On the other hand, many recent studies focus on the association between CSR and financial performance in different industries. For example, analyzing samples of 219 firms from 32 countries in 2020, Kludacz-Alessandri and Cygańska (2021), conclude that the statistically significant relationship between financial performance and the implementation of CSR strategy for firms under energy industry is found. To be specific, ROA and EBIT are significantly higher in firms carrying out CSR strategy. Dalwai and Salehi (2021) analyzed 380 firm-year observations which are under non-financial sector, listed on the Muscat Securities Market in Oman between 2015 and 2019. Their results demonstrate a negative relationship between firms’ management strategy and ROE, implying that the implementation of defender-type strategy increases firm’s financial performance. Further, Boukattaya and Omri (2021) observed a sample of non-financial listed-firms on SBF 120 in France from 2011 to 2016. Their results prove that CSR and corporate social irresponsibility cause opposite effects on the firms’ financial performance. As well, Feng et al. (2017) find that the association between the overall CSR activities and firm performance is heterogeneous across U.S. industries between 1991 and 2011, implying that CSR has significant positive implications for firms from most industries.
Moreover, a large number of researches point out the role of firm-factors in the relationship between ESG and financial performance. Rossi et al. (2021) note that specific firm-factors such as board characteristics, partially moderate the relationship between CSR practices and financial performance for European ESG firms. Additionally, they point out that that CSR practices influence the firm’s financial performance positively. As well, Nekhili et al. (2020) note that the way employees are represented on the board of directors also moderates the corporate ESG–financial performance relationship differently.
Further, some researches mention audit role as important factor between firm’s CSR and financial performance. Moradi et al. (2022) examined different intelligence types’ influence on auditor’s organizational performance (OP) through the mediatory role of social capital in Iraq. Observing 198 auditors in Iraq’s audit firms, they find statistically significant positive relationship between different types of intelligence, including spiritual intelligence (SI), emotional intelligence (EI) and organizational intelligence (OI), and audit firms’ OP. However, they find that social capital is found not to mediate the relation between spiritual, emotional, organizational intelligence and OP. Dakhli (2022) observed a panel dataset of 200 French listed-firms between 2007 and 2018, and prove that the improving effect of CSR on corporate financial performance, as measured in ROA, ROE and Tobin’s Q, is pronounced for firms which are audited by Big 4 auditors.
More than that, some prior studies emphasize the role of governance on firm’s performance. For example, Salehi and Alkhyyoon (2022) analyzed listed firms on Tehran and Iraq Stock Exchanges between 2011 and 2017, which are composed of 121 Iranian firms and 37 Iraqi firms. They find a significant relationship between managerial entrenchment, social responsibility disclosure, firm’s social responsibility growth, risk-taking and shareholders’ activity for Iranian firms. On the other hand, for Iraqi firms, a significant relation is found between managerial entrenchment, social responsibility disclosure, firm’s social responsibility growth but the relation between firm risk-taking and shareholders’ activity was not certain. Dalwai et al. (2021) further note that governance mechanisms such as dispersed ownership and audit committee size, result in better readability of annual reports of Oman firms in financial sector. Salehi et al. (2021) studied firms from 2010 to 2016 and find that family firms and the state shareholders have no significant impact on agency costs. However, they further note that financial leverage matching with their models leads to the decline of agency costs. Analyzing listed-firms on the Iran-Iraq Stock Exchange between 2012 and 2017, Faysal et al. (2020a) demonstrate a positive role for board size and CEO tenure in reducing cost of equity. After analyzing listed-firms in the Iraq-Iran Stock Exchange between 2012 and 2017, Faysal et al. (2020b) further note that a significant positive relationship between institutional ownership and the cost of equity for Iranian and Iraqi firms.
Furthermore, our study is also related to the literature focusing on the implications of chaebol structure on CSR policies. The chaebols, unique family-owned conglomerates in the nation, has played a critical role in leading economic growth under the support of government. Historically, however, their firm value has been mainly estimated on profitability, especially after the 1997 Asian Financial Crisis. This special conglomerate structure has been treated specially in the literature because this group of firms are under the stricter regulations and a vast range of media attentions. For example, Yoon et al. (2018) examine how CSR performance, measured by the ESG score affects the value of firms across the sample of chaebol and non-chaebol affiliates. In fact, they find a stronger valuation effect of CSR performance for chaebol. Yoon et al. (2021) investigate how the CSR performance is related to the tendency of tax avoidance in these two groups of samples. They argue that the firms with good CSR performance have higher tax transparency only for chaebol affiliates.
Lastly, a number of previous researches highlight the role of intangible factors such as firm’s reputation and intelligence capital. Fourati and Dammak (2021) studied the mediating role of firm’s reputation (CR) in the relationship between CSR and firm’s financial performance. After investigating a sample of 3,274 listed-firms during 2009 and 2016 in 25 countries from Europe, Asia, Africa, and South and North America, they find that CSR has a positive influence on firm’s financial performance; on the other hand, firm’s reputation is found to mediate the relationship between firm’s CSR and financial performance. Mahmoud et al. (2020) used a sample of 132 listed firms on the Tehran stock exchange between 2013 and 2016, and found that while a board’s independence, financial expertise and the size of audit committee negatively relate to the communicative capital, the relationship between audit committee independence and communicative capital is found to be positive at statistically significant level.
Korean Evidence
This study is most closely related to prior studies that examined the relationship between CSR and financial performance in the Korean financial market. These studies mainly adopted the KEJI index to represent the level of CSR activities for Korean corporations. A majority of studies, such as J.-I. Jang and Choi (2010), and Kim and Wee (2011), reported a positive relationship between CSR measures and financial performance. Na and Hong (2011) showed a negative relationship between environmental protection measures and Tobin’s Q value, while they showed a positive relationship between the employee satisfaction index of KEJI and Tobin’s Q measure. J.-S. Choi et al. (2010) provided inconclusive results for the relationship between the KEJI index and accounting performance measures.
Note that the potential problems of adopting the KEJI index as a proxy for CSR activity have been widely recognized in the literature, especially in the context of its relation to financial performance. Most of all, the quantitative KEJI index is disclosed for only 200 corporations per year, mostly large firms, which potentially leads to sample-selection biases. Furthermore, with regard to the relationship between the KEJI index and corporate profitability, the KEJI index previously included the component of economic development contribution, which assigns a higher score to firms with higher earnings. In fact, Cho and Park (2015) found that the positive relationship between the KEJI index and profitability weakens if they control for the economic development score.
In contrast, similar study which employed the ESG scores from the Korean Corporate Governance Service (KCGS), an ESG-evaluating institution in Korea, better confirm the relationship between CSR activity and financial performance. For example, Yoon et al. (2018) argue that CSR practices positively and significantly affect a firm’s market, in line with previous studies on developed countries, implying that its impact on share prices may differ according to firm characteristics. Further, Lee et al. (2018) argue that total ESG score negatively relates to ROE but shows no statistically significant relationship with ROA and Tobin’s Q value. Lastly, using the ESG score from KCGS, Hwang et al. (2021) report the positive relationship between ESG and financial performance even during the COVID-19 pandemic. They argue that in the first quarter of 2020, when the impact of the pandemic occurred, firms’ earnings dropped significantly; however, they find that the higher the performance of ESG activities, the smaller the decline in earnings
As discussed earlier, previous researches imply that the relationship between CSR and financial performance is not quite consistent. It could be due to the fact that the introduction and implementation of ESG in Korean firms is still at development stage, so that their commitment to ESG performance could be regarded as “uncertain signal” to the outside stakeholder and investors (Lee & Cho, 2021; Yoon et al., 2018). This fact suggests that the Korean firms’ endeavor to commit to ESG performance would be interpreted as “cost” so that their firm value would be negatively influenced, which would be in line with traditional view on firms.
To summarize, although some studies on the Korean market present quite meaningful relationship (e.g., positive/negative) between CSR and financial performance (Lee et al., 2018; Yoon et al., 2018), a majority of them seem to suffer from limited data availability (e.g., KEJI index) and relatively short period of available ESG scores of Korean firms, when compared with studies at international level. For instance, the observation period of Lee et al. (2018) is only 5 years, which is from 2011 to 2016.
On contrast, previous studies on international (U.S.) level, such as Qureshi et al. (2021) and Feng et al. (2017), confirm a consistent (positive) relationship between overall CSR and firm performance measures, which could be due to the relatively long observable data period (e.g., 10–20 years). In this respect, we believe that our adaptation of ESG scores of KCGS, in which the dataset is larger (e.g., 750 corporations) and longer (e.g., 10 years) in align with studies on international level, would greatly enhance the quality of analysis, which would be discussed in detail.
Data and Methodology
Data Source
We employ the ESG score from 2011 to 2020 published by the Korean Corporate Governance Service, which is established in 2002 as non-profit agency by a variety of organizations such as Korea Exchange, Korea Financial Investment Association, Korea Listed Companies Association and KOSDAQ Listed Companies Association. The set of KCGS data contains the environmental score (E-score), social score (S-score), and governance score (G-score), as well as the total ESG score. These scores are the results of the agency’s annual evaluation in an effort to measure the management sustainability of listed firms in Korea. The ESG data of KCGS is differentiated from those of KEJI in that the former evaluates “all” the KOSPI-listed (e.g., more than 750) and selected KOSDAQ firms in Korea, while the latter uses selected listed-firms which are less than 350 as of 2020. As aforementioned, we believe that our study with KCGS data would improve on prior studies with KEJI data, thanks to a wide coverage of yearly firm data set.
Because the dataset provides the total ESG score and its constituents separately, we employ this set of raw scores directly in our estimation. We obtain financial statement variables from the Quantiwise software of FNguide, which is a financial information provider in Korea. The corresponding financial statement variables are constructed from 2011 to 2020.
Methodology
This work adopts a panel regression model with firm-fixed effects as a major tool in evaluating the CSR-performance relationship. Recent papers examining the relationship between CSR and other corporate policies have emphasized the significant role of firm fixed effect in directing the empirical results. For example, Cui et al. (2018) included the firm fixed effect term in their analysis for the relationship between CSR and information asymmetry. To reflect such recent developments in the literature, we include the firm fixed-effect term in our baseline econometric model. We believe that the use of panel regression models controls for substantially heterogenous CSR practices across corporations.
To precisely evaluate the economic relationship between CSR and profitability, we need to first consider potential omitted bias problems in our empirical model. Margolis and Walsh (2003) documented that there are three common types of control variables to mitigate such omitted bias problems – size, industry categorization and market risks. McWilliams and Siegel (2000) highlighted the importance of R&D expenditure advertising expenses in deciding firm-level profitability. Callan and Thomas (2009) pointed out that a potential non-linearity of these control variables may affect a firm’s profitability.
Accordingly, we adopt the following empirical models in estimating the relationship between CSR and financial performance. In line with McGuire et al. (1988) and Waddock and Graves (1997), we estimate the effect of CSR on the financial performance of the next fiscal year. The first econometric model only considers the linear relationships:
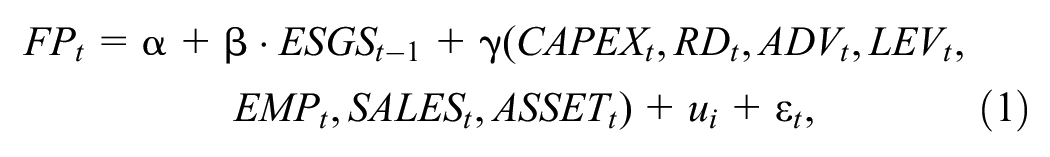
where
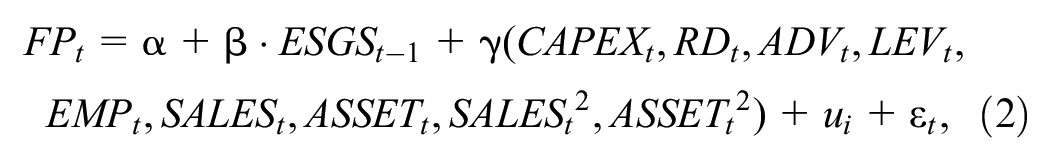
where
We illustrate our empirical models in detail.
The control variable constructions are similar to those of Callan and Thomas (2009). To account for the effect of firm size, we include three firm characteristic variables: SALES is the total sales divided by total assets at time t; ASSET is the firm’s logarithm of total book asset value at time t; EMP is the logarithm of firm’s total number of employees. We also include a set of variables reflecting the firm’s investment activity, which is a key factor in determining its productivity; CAPEX is the firm’s capital expenditure over sales at t; RD is the firm’s R&D expenditure dividend by its sales at t; ADV is the firm’s advertising expense over its sales at t. The leverage ratio at t is related to its financial risk. The rationale behind the inclusion of control variables are as follows. The number of employees and the size of total assets proxy the lifecycle of a corporation; a large size indicates a matured firm, which generally indicates a higher profitability. A large CAPEX and R&D activity suggest a firm as growth firms which focuses more on investment rather than current profitability. A high level of leverage might indicate the financial stress of a corporation, which reduces profitability. The sales-asset ratio is a turnover ratio which closely related to industry level profitability. Table 1 summarizes the definition of variables employed in our empirical estimations.
Definitions of Variables.
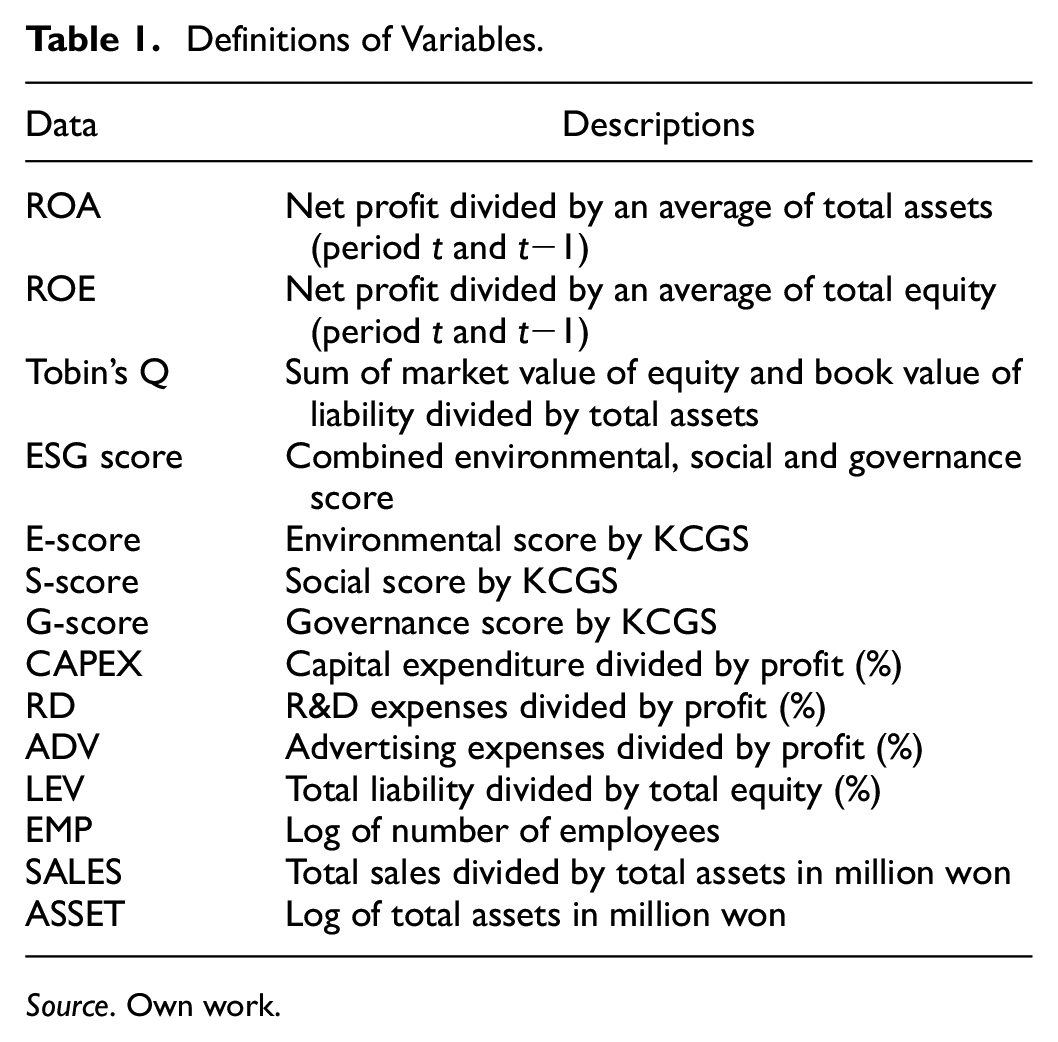
Source. Own work.
Data Analysis
Descriptive Statistics
Before estimating our baseline model, we first summarize our variables of interest. Table 2 reports the mean, 1st quartile, median, 3rd quartile, and standard deviation of each variable distribution. ESG scores, profitability measures (ROA, ROE, and Tobin’s Q), investment-related variables (CAPEX, RD, and ADV), risk measure (LEV), and size measures (SALES, ASSET, EMP) are examined.
Summary Statistics.

Source. Own work.
Table 2 shows that each of the E/S/G scores contributes almost equally to the total ESG score, on average. The mean of each score ranges from 26.52 to 28.75. Interestingly, the coefficients of ROA and ROE are 1.88 and −0.36, showing opposite sign.
In Table 3, we calculate the correlation coefficients for our variables of interest. The pairwise correlation coefficients are calculated for the ESG scores, profitability measures (ROA, ROE and Tobin’s Q), investments variables (CAPEX, RD, and ADV), risk measure (LEV), and size measures (EMP, SALES, ASSET).
Correlation Coefficients.
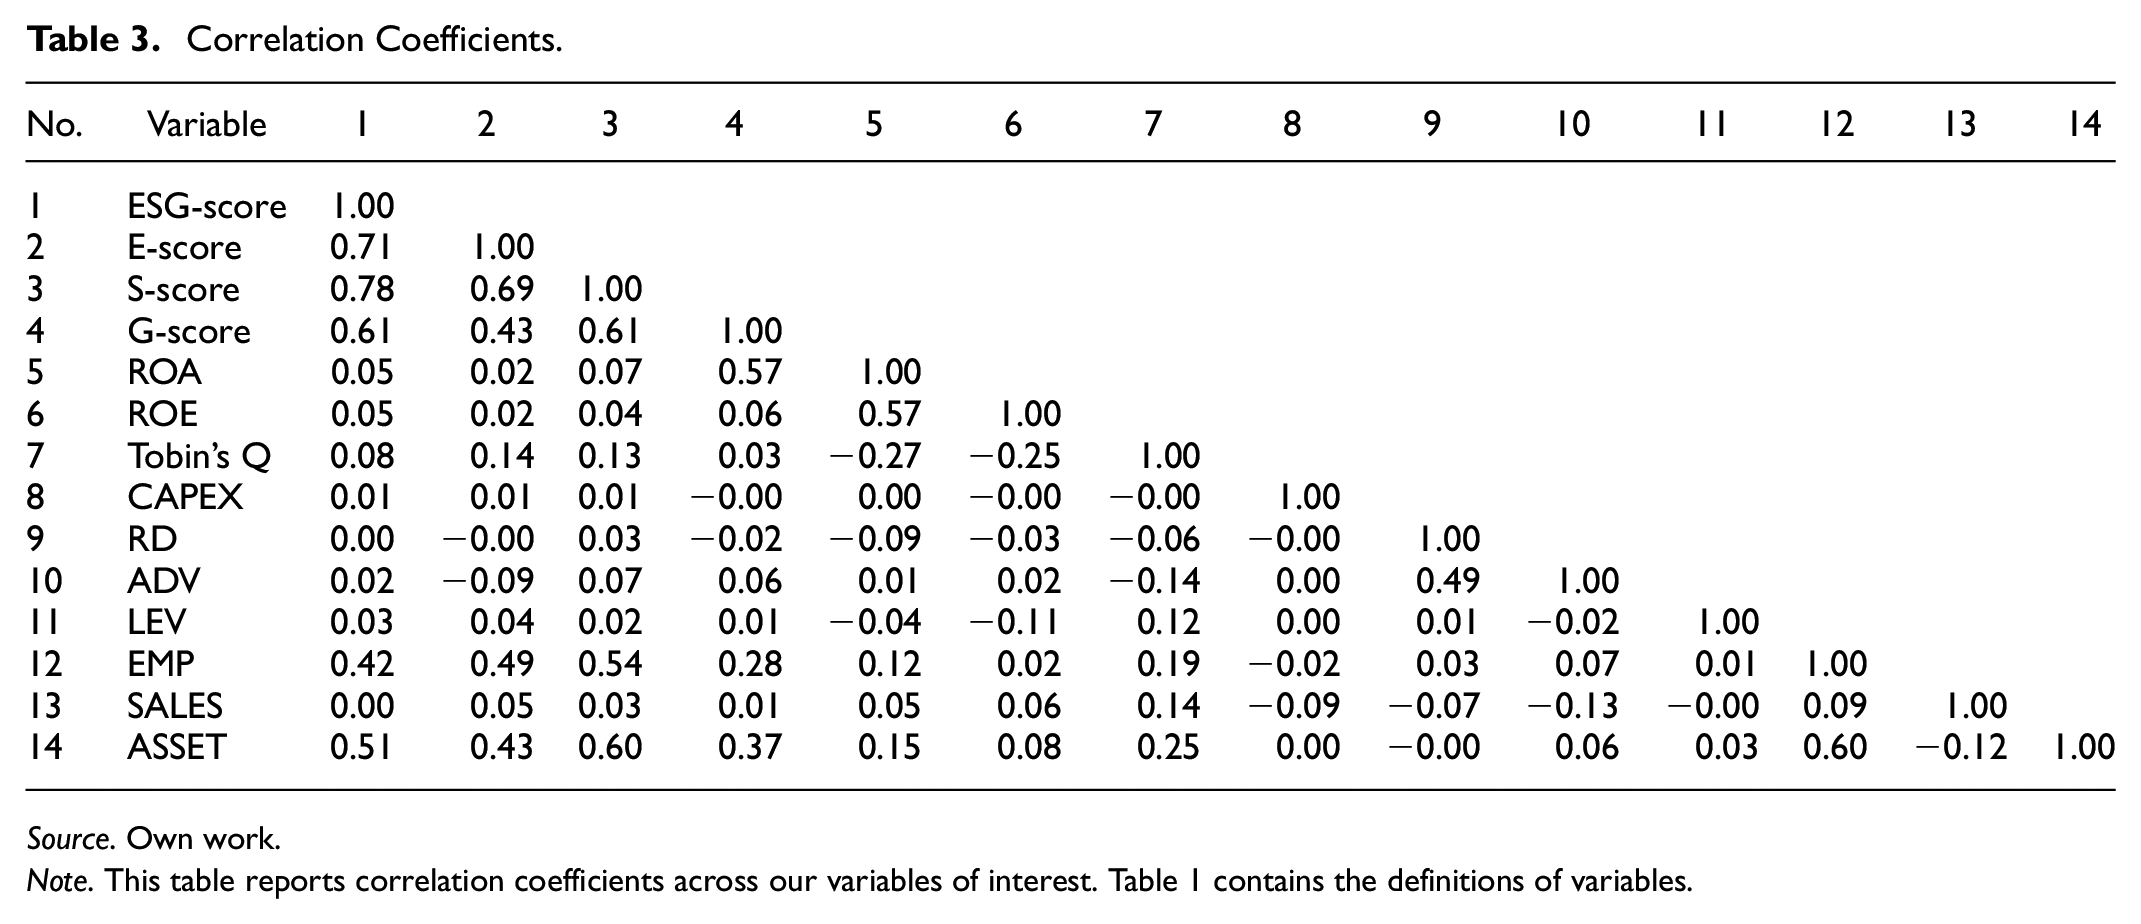
Source. Own work.
Note. This table reports correlation coefficients across our variables of interest. Table 1 contains the definitions of variables.
Table 3 provides a number of noticeable results. First, the table shows weak correlations or even a negative correlation between the ESG score and financial performance measures. For instance, ROA and ROE show slightly positive correlation coefficients with the ESG score but the coefficients are 0.05. Tobin’s Q value’s correlation with the ESG score is still quite small at 0.08. Next, there exists a relatively weak correlation between the G-score and the ESG score variations compared to the other social responsibility scores. The total ESG score has the pairwise correlation coefficient of 0.61 with the G-score, which is far smaller than that of E-score and S-score. Finally, Tobin’s Q value is negatively correlated with ROE and ROA. The Tobin’s Q variable has correlation coefficients with ROA and ROE of −0.27 and −0.25, respectively. Such a positive/negative correlation probably reflects qualitative differences in these three types of financial performance measures. While ROA and ROE basically capture a firm’s accounting profitability based on its reported net income, Tobin’s Q is closely associated with the market value/replacement value of a firm.
Following previous researches on ESG and financial performances in developing countries (Marić et al., 2021; Rettab et al., 2009), we now present a linear trend of our main variables, individual ESG and whole ESG score, as in Figure 1 below. As aforementioned, our sample period runs from 2011 to 2020. During the period, the ESG score shows gradual increase, implying that the ESG performance of Korean firms improves in general. However, individual ESG score shows quite distinguishable pattern. They increase until the middle of our sample period and then decline toward the end of period. At the end, each ESG score rises. We interpret that the Korean firms’ introduction and implementation of ESG practice is still at early stage, so that the individual and whole ESG score shows quite fluctuating pattern throughout the sample period. This implies that in our sample period, Korean firms have experienced “period of adjustment” for adopting and practicing ESG in their business, which could be reflected in our analysis results.

Yearly trend of E/S/G/ESG scores.
CSR and Financial Performance
In Table 4, we adopt our first empirical model without the quadratic terms to estimate the relationship between CSR and financial performance. We adopt the total ESG score as our baseline social responsibility measure and include the firm-level covariates described in the first empirical model. The same econometric model is estimated with/without firm fixed effects. The first two columns use ROA as the dependent variable. The next (last) two columns use ROE (Tobin’s Q) as the dependent variable. The table reports the estimated coefficients and corresponding t-statistics (in parenthesis). The standard errors are clustered by each firm. The number of observations and adjusted R2 value are reported as well. For calculation convenience, we divided each ESG and individual ESG score by 100 when we conducted regression on Tobin’s Q from Tables 4 to 11, in order to align it with other financial variables in terms of decimal points.
ESG Score and Financial Performance.

Source. Own work.
Note. This table reports the regression and firm fixed effect regression results for the entire sample with the ESG score as the social responsibility measure. The first two columns use ROA as the dependent variable. The next (last) two columns use ROE (Tobin’s Q) as the dependent variable. The estimated coefficients and t-statistics (in parenthesis) are reported. Table 1 contains the definitions of variables.
The symbols ***, *, and * represent statistical significance at 1%, 5%, and 10%, respectively.
Table 4 provides a number of interesting results. Most of all, the estimation results point to poor financial performance for firms with higher ESG scores. If we take firm fixed effects into account, the coefficients of ROA and Tobin’s Q on the ESG scores are partially negative and statistically significant at the 1% level. For instance, the coefficient is −0.49 and −0.81 for the examination of ROA and Tobin’s Q. The negative coefficient imply that better social responsibility is accompanied with a poor financial performance, irrespective of financial performance measure choices.
Table 4 also shows that there is a discrepancy in the estimation results with/without firm fixed effects. To be specific, the statistical significance of coefficients on the ESG score changes in the examination of ROA, depending on whether we include the firm fixed-effect terms or not. The coefficient is statistically insignificant and negative without the fixed effects (−0.30), but it gains significance when turns out (−0.49) with the firm fixed effect terms. This result
Table 4 provides empirical evidence arguing for the traditional view of corporations (Friedman, 1962, 2007), as evident in ROA and Tobin’s Q in particular. Because investments in socially responsible activities raise costs for a firm, probably in a persistent way, more socially responsible firms tend to show poor performances. This result is also consistent with international evidence stressing a negative relationship between CSR and financial performance, such as Wright and Ferris (1997). On the other hand, the positive correlation coefficient of ROE is aligned with the stakeholder theory of firms (Freeman, 1984), which expects a positive CSR-performance relationship. However, its coefficient is statistically insignificant, which is not strongly supportive to the theory.
The results of ROA and Tobin’s Q in Table 4 are not well aligned with prior empirical evidence in the Korean financial market. The representative examples are J.-I. Jang and Choi (2010) and Kim and Wee (2011). We may consider two possible explanations for this contrasting finding. Most of all, s majority of prior studies adopted the KEJI index as the proxy variable for corporate social responsibility. The KEJI index only covers a small sample of large firms, which may cause significant sample selection bias. The index is also known to overestimate the positive correlation between CSR and financial performance (Cho & Park, 2015). Second, these studies may not properly control for the firm-fixed effect in their analysis. The use of fixed-effect model may drive an opposite result, as shown in the last two columns of Table 4.
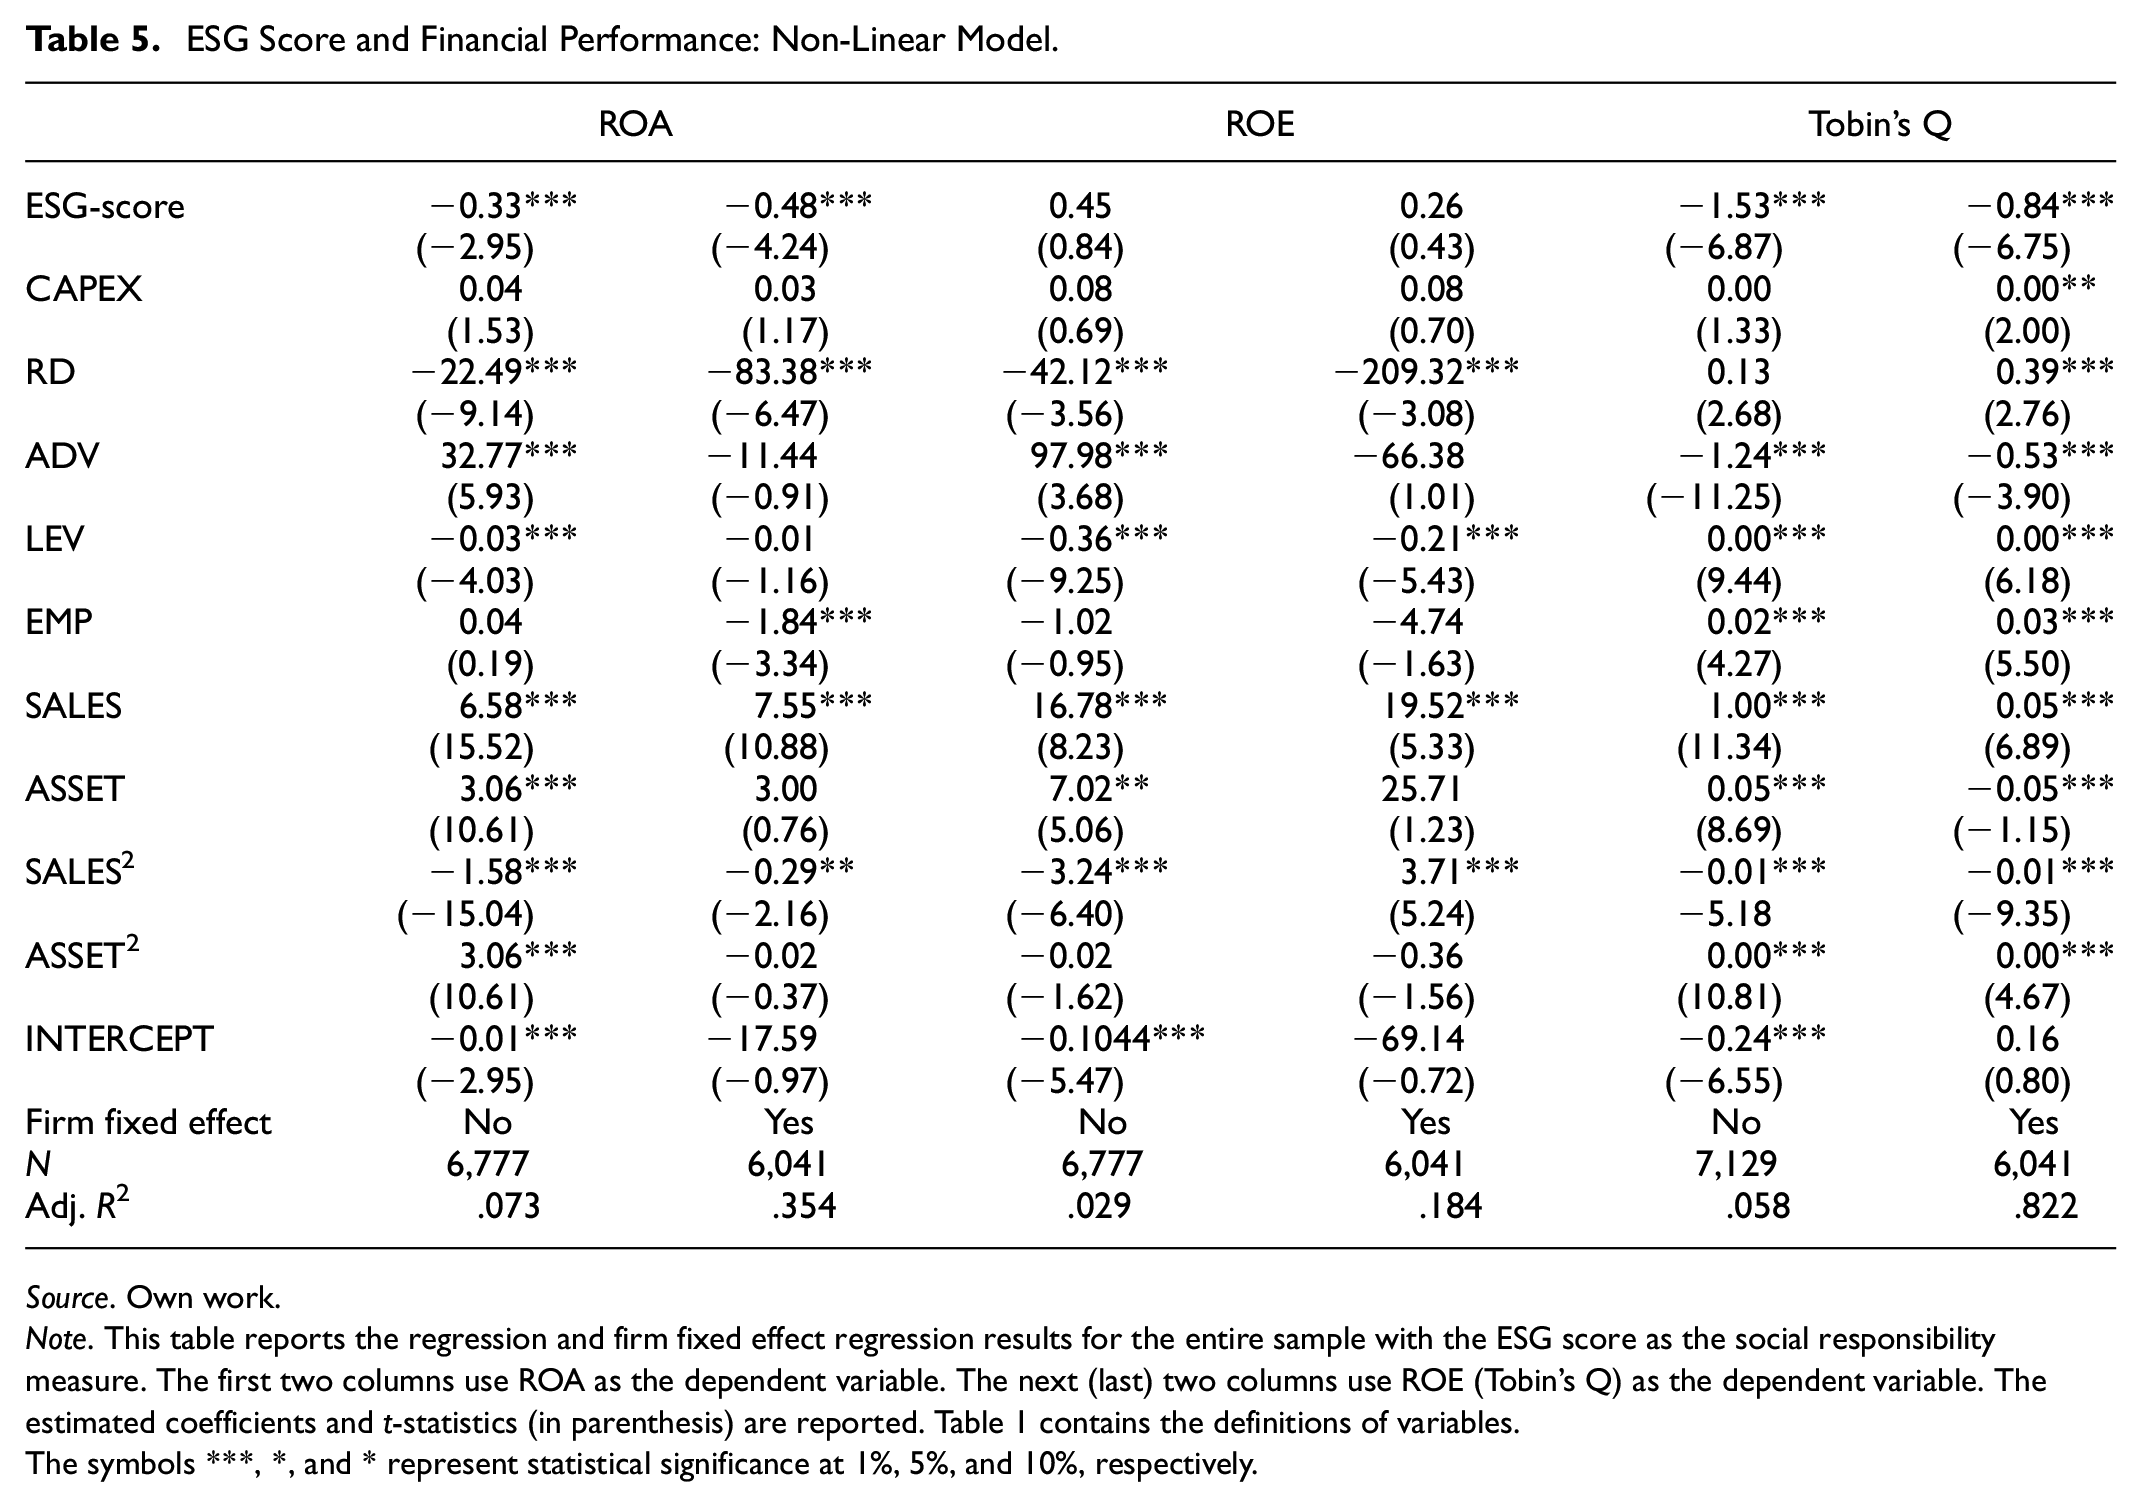
Table 5 examines the CSR-performance relationship again by considering the potential role of non-linearity, as in Callan and Thomas (2009). In Table 5, we include the quadratic terms of a firm’s sales and asset size measures, in addition to the firm characteristic variables used in Table 4. The first two columns employ ROA as the dependent variable. The next (last) two columns adopt ROE (Tobin’s Q) as the dependent variable. The table reports the estimated coefficients and corresponding t-statistics (in parenthesis). The standard errors are clustered by each firm. The number of observations and adjusted R2 value are reported as well.
ESG Score and Financial Performance: Non-Linear Model.
Source. Own work.
Note. This table reports the regression and firm fixed effect regression results for the entire sample with the ESG score as the social responsibility measure. The first two columns use ROA as the dependent variable. The next (last) two columns use ROE (Tobin’s Q) as the dependent variable. The estimated coefficients and t-statistics (in parenthesis) are reported. Table 1 contains the definitions of variables.
The symbols ***, *, and * represent statistical significance at 1%, 5%, and 10%, respectively.
Table 5 robustly confirms the results in Table 4. Even though we control for the potential bias from non-linear relationship, a firm’s ESG score on ROA and Tobin’s Q shows a negative relationship with its financial performance. This result supports the traditional view of corporations with regard to CSR, which predicts a negative association between CSR and financial performance. Moreover, when we adopt ROE as our financial performance measure, the coefficient on the ESG score is positive at statistically insignificant level, both in the presence and absence of firm fixed effect term.
Now we turn to examine how each component of the ESG score affects a firm’s financial performance. As illustrated above, the KCGS provides an environmental score (E-score), social score (S-score) and governance score (G-score) separately, as well as the total ESG score. This detailed categorization offers an opportunity for us to examine how a specific form of a corporation’s CSR affects its financial performance.
Table 6 examines how a corporation’s environmental score is related to its financial performance. The three financial performance measures, ROA, ROE and Tobin’s Q are adopted again. For each measure of financial performance, we estimate two empirical models which exclude/include the quadratic terms. The table reports the estimated coefficients and corresponding t-statistics (in parenthesis). All models take account of firm-fixed effects and the standard errors are clustered by each firm. The number of observations and adjusted R2 value are reported as well.
Environmental Score and Financial Performance.

Source. Own work.
Note. This table reports the regression and firm fixed effect regression results for the entire sample with the E-score as the social responsibility measure. The first two columns use ROA as the dependent variable. The next (last) two columns use ROE (Tobin’s Q) as the dependent variable. The estimated coefficients and t-statistics (in parenthesis) are reported. Table 1 contains the definitions of variables.
The symbols ***, *, and * represent statistical significance at 1%, 5%, and 10%, respectively.
Table 6 presents a couple of interesting results. First, the table shows that there exists a significantly negative relationship between E-score and ROA/ROE. For instance, the coefficient on E-score is −0.03 in the first column, which is statistically significant at the 1% level. This negative relationship is robustly observed if we change the financial performance measure to ROE or if we include non-linearity terms in our regression. However, Table 6 verifies that the E-score shows positive relationship with the variation of Tobin’s Q. The coefficient on the E-score is almost equal to zero and shows statistical significance in the Tobin’s Q regression, in the quadratic terms.
This finding implies that a firm’s environmental activity has a considerable impact on its (future) cash-flow generation, but a positive impact on its replacement value. The variation of ROA or ROE relies critically on a firm’s (future) cash-flow generation if all other corporate policies remain stable. If it may take a significant amount of time to implement environment related projects or if a firm’s engagement in environmental activity may increase operating costs in a persistent way, this negative relationship between E-score and future cash flow could be rationally explained. In spite of such a decrease in profitability, the firm’s overall replacement value or market value is limitedly affected by its environmental activity. Note that such a significant effect is still well aligned with the stakeholder theory of firms in the CSR-performance relationship.
Next, Table 7 examines how a corporation’s social score is associated with a firm’s financial performance. Consistent with Table 6, we consider the three financial performance measures defined above, ROA, ROE and Tobin’s Q. For each measure of financial performance, we employ two empirical models which exclude/include the quadratic terms. The firm-fixed effects are controlled for all estimations. The table reports the estimated coefficients and corresponding t-statistics (in parenthesis). The standard errors are clustered by each firm. The number of observations and adjusted R2 value are reported as well.
Social Score and Financial Performance.

Source. Own work.
Note. This table reports the regression and firm fixed effect regression results for the entire sample with the S-score as the social responsibility measure. The first two columns use ROA as the dependent variable. The next (last) two columns use ROE (Tobin’s Q) as the dependent variable. The estimated coefficients and t-statistics (in parenthesis) are reported. Table 1 contains the definitions of variables.
The symbols ***, *, and * represent statistical significance at 1%, 5%, and 10%, respectively.
The results in Table 7 are quite similar to those in Table 6. Most of all, Table 7 argues that there exists a significantly negative relationship between S-score and ROA/ROE. The effect of S-score on ROA/ROE turns out similar to that of E-score. In the first empirical model with ROA, for example, the coefficient on S-score is −0.05, which is same to the corresponding coefficient on E-score. This negative relationship is robust to the adoption of ROE as our financial performance measure or to the consideration of the quadratic terms as additional control variables. However, Table 7 still verifies that the S-score is partially associated with Tobin’s Q values. The coefficient on the S-score without quadratic terms, is slightly positive but not statistically significant. The findings related to ROA and ROE are in line with the traditional view of corporate theory (Friedman, 1962, 2007). In contrast, the results for Tobin’s Q partially favors the stakeholder theory of firms, as in Table 6.
Such similarity in the results of Tables 6 and 7 is not a surprising one if we consider the significant correlation between the environmental and social scores reported in Table 3. The pairwise correlation coefficient between these two scores is 0.69, which implies strong positive co-movements between these two scores. Economically, this large positive correlation indicates that a firm tends to engage in social and environmental activities simultaneously; these two types of CSR activities might not be separately pursued/conducted within a corporation.
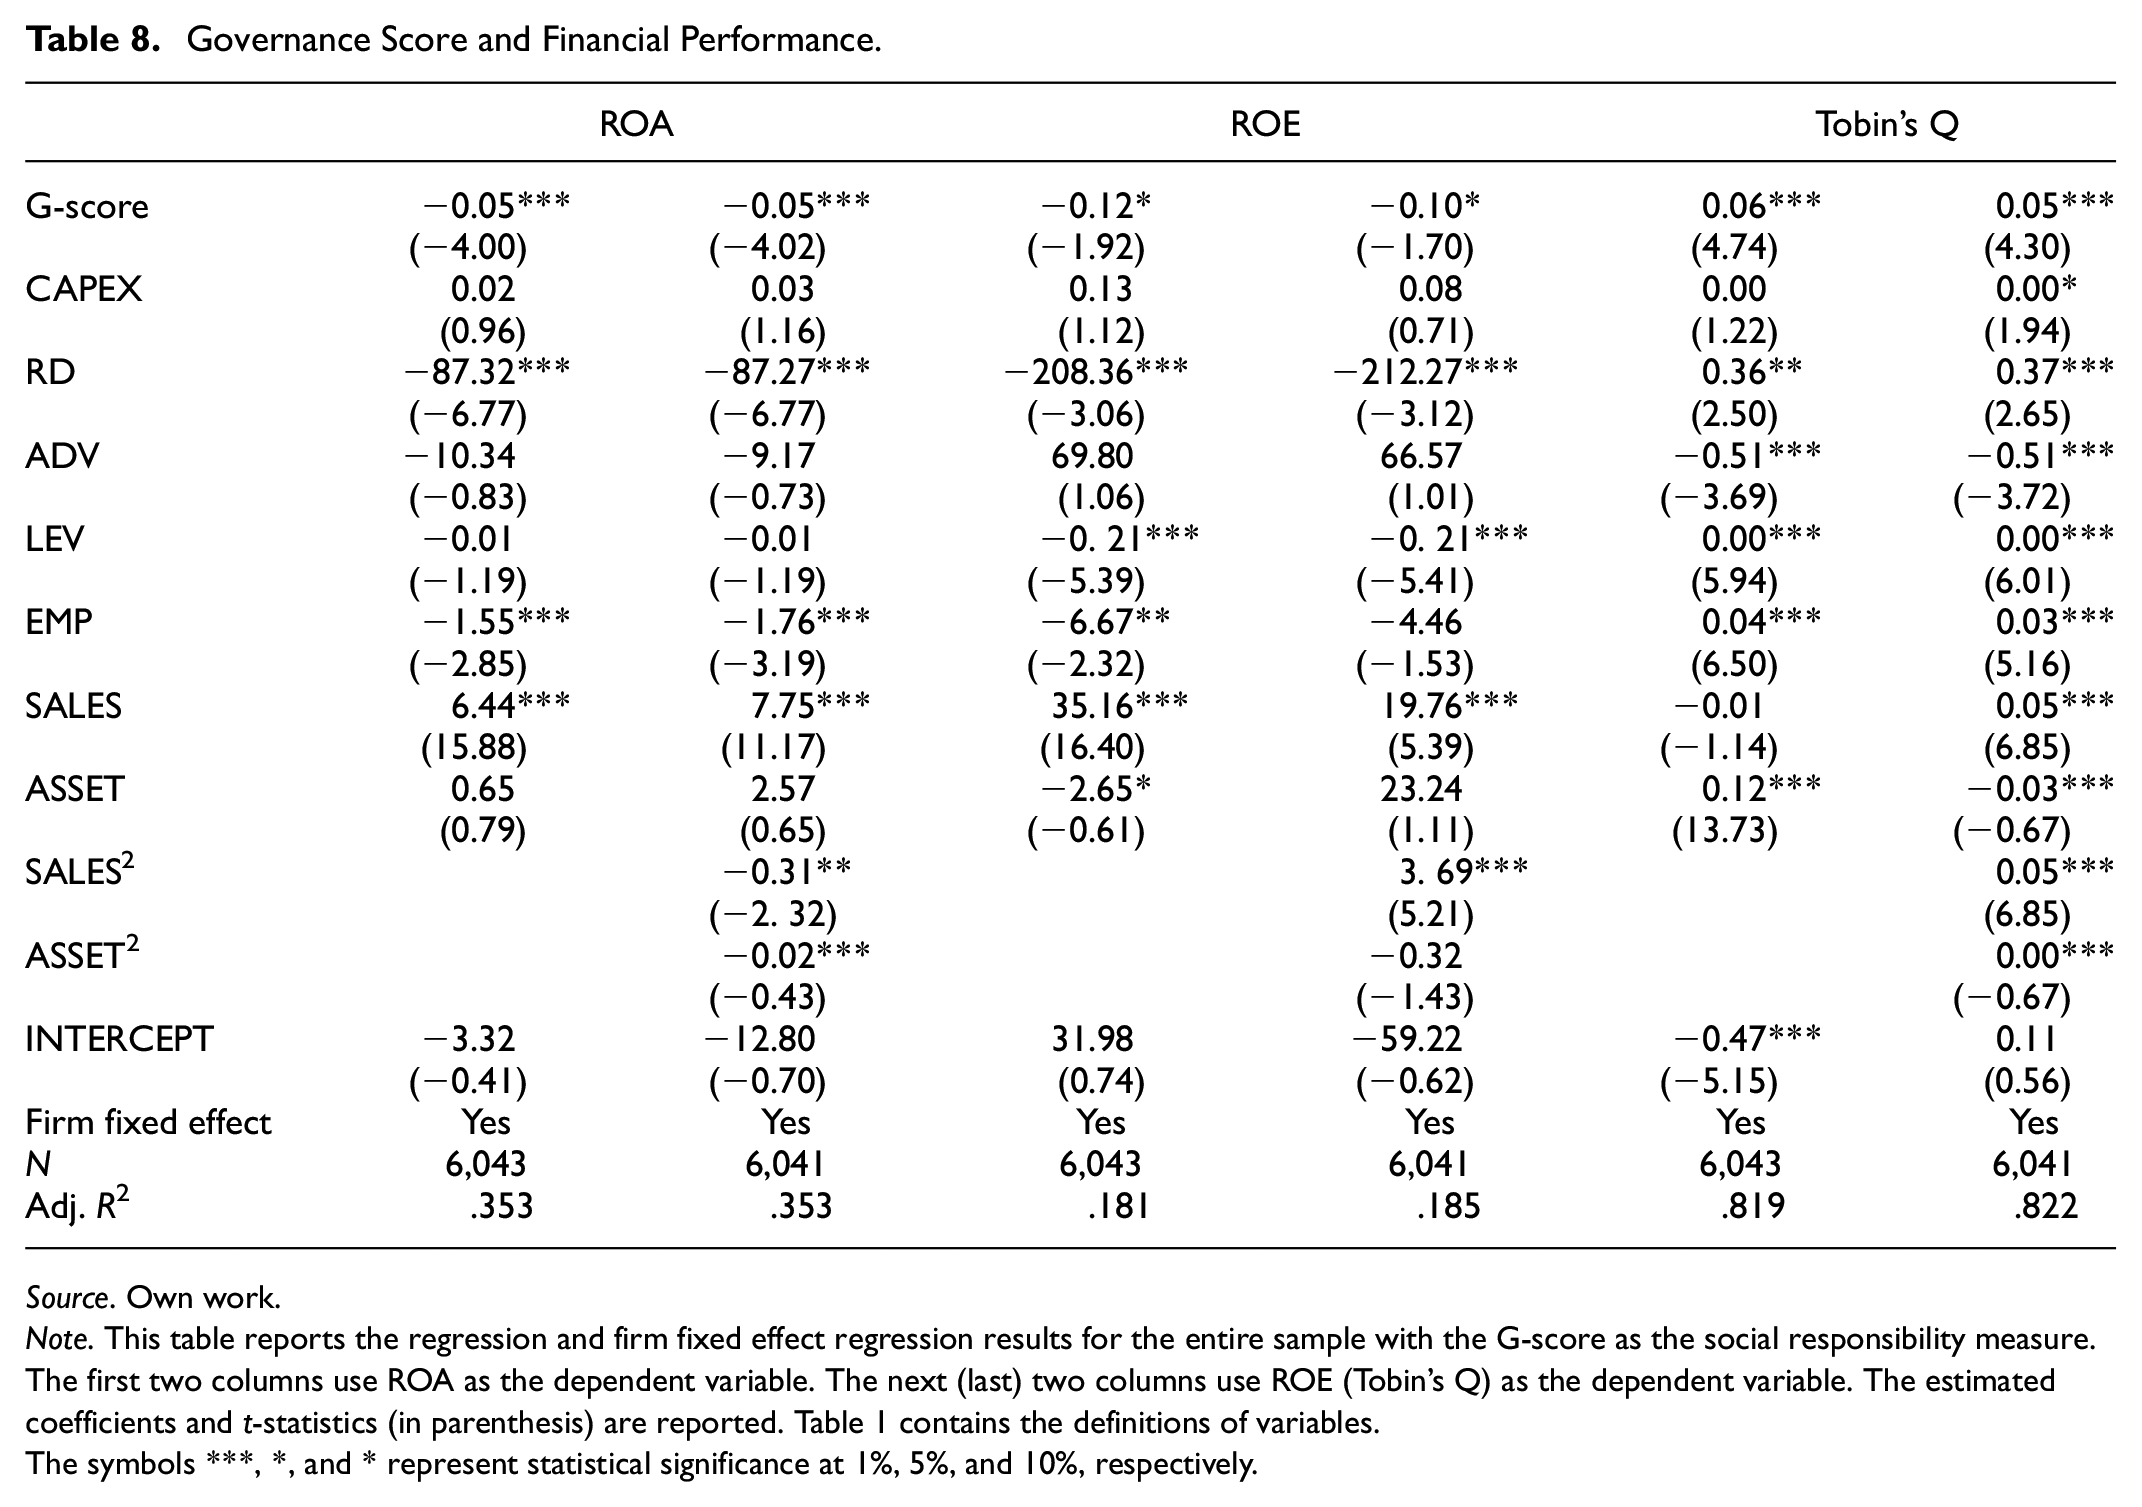
Table 8 examines the effect of corporate governance scores on financial performance. In line with Tables 6 and 7, we adopt ROA, ROE and Tobin’s Q to proxy a corporation’s financial performance. For each performance measure, we employ two empirical models which exclude/include the quadratic terms. The firm fixed-effects are considered for all empirical models. The table documents the estimated coefficients and corresponding t-statistics (in parenthesis). The standard errors are clustered by each firm. The number of observations and adjusted R2 value are reported as well.
Governance Score and Financial Performance.
Source. Own work.
Note. This table reports the regression and firm fixed effect regression results for the entire sample with the G-score as the social responsibility measure. The first two columns use ROA as the dependent variable. The next (last) two columns use ROE (Tobin’s Q) as the dependent variable. The estimated coefficients and t-statistics (in parenthesis) are reported. Table 1 contains the definitions of variables.
The symbols ***, *, and * represent statistical significance at 1%, 5%, and 10%, respectively.
Table 8 shows that the governance score affects a firm’s financial performance in different ways. The governance score is negatively related to ROA and ROE value but shows strong positive relationship with Tobin’s Q measures. To be specific, the coefficients on the G-score are statistically significant in all of empirical models. Yet, the coefficients become significantly negative in the first two empirical models that employ ROA and ROE value as the dependent variable. These negative coefficients argue for the traditional view of corporate theory (Friedman, 1962, 2007). These statistically negative coefficients for ROA and ROE argue against the stakeholder theory of a firm, as in Tables 6 and 7.
This finding is interesting because it implies that a firm’s improvement in governance structure may decrease the accounting value of the corporation. This negative impact on the value of firm is not consistent with the agency view of corporate theory as well; the agency view predicts that the mitigation of shareholder-manager conflicts leads to favorable valuation effects for shareholders; a better governance structure is widely accepted to mitigate the shareholder-manager conflicts. This finding suggests that such improvements of governance structures probably involve tangible/intangible costs, which may decrease the value of a corporation.
The above findings in the analysis of each ESG component can be summarized as follows. The results based on the total ESG score indicate that a firm’s engagement in CSR negatively affects its financial performance for first two measures of financial performance, ROA and ROE, but not Tobin’s Q. To be specific, a firm’s environmental and social scores are negatively related to the firm’s cash flow measure of financial performance, ROA and ROE. Such negative relationships support the traditional view of corporate theory (Friedman, 1962, 2007). In contrast, a firm’s governance score is positively related to Tobin’s Q value, implying that the improvement of governance leads to the increase of replacement/market value of firms. This is in consistence with the traditional view on corporation.
We now turn to examine what types of CSR factors more significantly influence a firm’s financial performance. For this purpose, we include all of the three scores, E-score, S-score, and G-score, in our empirical model. Table 9 examines how these three factors are related to the measures of financial performance. In line with our previous estimations, we adopt ROA, ROE and Tobin’s Q as financial performance measures. For each performance measure, we employ two empirical models with/without quadratic terms. The firm fixed effects are included in all of the estimations. The table reports the estimated coefficients and corresponding t-statistics (in parenthesis). The standard errors are clustered by each firm. The number of observations and adjusted R2 value are documented as well.
E/S/G Scores and Financial Performance.

Source. Own work.
Note. This table reports the regression and firm fixed effect regression results for the entire sample with the E/S/G-scores as the social responsibility measure. The first two columns use ROA as the dependent variable. The next (last) two columns use ROE (Tobin’s Q) as the dependent variable. The estimated coefficients and t-statistics (in parenthesis) are reported. Table 1 contains the definitions of variables.
The symbols ***, *, and * represent statistical significance at 1%, 5%, and 10%, respectively.
Table 9 provides a couple of interesting results as well. First, a firm’s S-score and G-score affect ROA negatively and more significantly. However, the coefficients on these two scores become statistically insignificant in the examination of ROE. Second, the G-score is still positively related to the Tobin’s Q variable both in quadratic and non-quadratic terms, even when we include all three CSR attributes in our empirical model. Consistent with Tables 6 and 7, G-score with and without quadratic form have significant positive relationship with the Tobin’s Q variable. These two findings still suggest that each factor of the ESG score affects the three measures in a different way in line with Tables 6 to 8.
To sum up, our analysis shows a robustly negative relationship between CSR performance and the ROA variable. Especially the roles of social and governance aspects are significant in driving such negative relationships. However, we did not find strong evidence for the ROE. While the total ESG score show a negative relationship with Tobin’s Q, each individual score does not strongly confirm this relationship; only G score shows positive relationship with Tobin’s Q. In terms of ROE, we find no clear relationship with CSR performance and financial performance across almost all specifications.
This difference might be closely related to the construction of financial performance measures. Unlike the ROE or Tobin’s Q variables reflecting the market value of corporation, the ROA variable exclusively relies on the set of accounting information such as the book asset values and operating profits. Therefore, the ROA variable may easily capture the cost component related to a firm’s CSR activities. However, if a corporation’s CSR activity enhances the value of firms as well, the negative relationship observed in the ROA-CSR specification might become less significant; CSR may increase the operating cost of firms but may also raise the value of corporation as well.
Discussion and Implications
In general, our estimation results by adopting ESG scores as CSR proxy variables do not support the stakeholder theory of corporation, which predicts a positive relationship between CSR and financial performance. Unlike the prediction of this theory, the estimated coefficients are significantly negative, especially in terms of ROA and Tobin’s Q measure. We find no strongly supporting evidence for the theory in the examination of ROE. These findings are generally consistent to the traditional view of corporations (Friedman, 1962, 2007). In Table 4 and 5, the total ESG score is negatively associated with two of the financial performance measures examined here, ROA and Tobin’s Q, when the potential role of non-linearity is considered. While the significance of coefficient on Tobin’s Q is not stable across other estimations (e.g., chaebols), these negatively significant coefficients in the benchmark specifications are in line with the traditional view of corporation focusing on cost-increasing role of investments in socially responsible activities.
Our findings generally suggest that in the Korean financial market, the practice of CSR is viewed as cost, rather than benefit by shareholders. Our analysis, which spans 10-year period, shows that the CSR performance, as measured in high ESG score, could cause negative effect on financial performance, which implies that shareholders and the market would regard the firm’s effort for CSR as (non)financial burden, rather than guaranteed return in foreseeable period. Not surprisingly, the negative relationship between CSR and financial measure is increasingly found in recent researches, in which a variety of the measure of ESG, (non)accounting measure and types of firms are used (Ahn et al., 2023; Lee & Cho, 2021; Lee et al., 2018). Particularly, this relationship could be due to the interests of management level which tends to be in align with the short-term interests of shareholders. For example, H. Jang and Kim (2001) note that “the best interest of the company” corresponds only to the interest of shareholders “at least legally,” and does not necessarily consider a broader category of stakeholders. D. Choi et al. (2019) further argue that in the Korean market is dominated by chaebols, which are prone to short-term oriented behavior at the expense of outside shareholders and stakeholders. In this respect, additional CSR activities could be regards the increase of (non)financial cost in the perspectives of firm managers and investors.
Our results have important implications for future studies as well. Most of all, the choice of financial measure plays a substantial role in shaping our estimation results. When we separately analyzed the E/S/G scores, we found that the ROA and ROE are affected differently from the Tobin’s Q. Similar tendency is also observed for ESG scores. For instance, if we use the individual ESG score together and investigate its relation to any financial measure, we may conclude that the evidence for e-score analysis supports neither the stakeholder theory nor the traditional view, as presented in Table 9.
It is also noteworthy that if we employ non-account measure, such as stock return, the results of the relationship between CSR and financial performance, are quite contrasting. Although our analysis in accounting measures (ROA/ROE/Tobin’s Q) generally support the traditional view of corporation which implies a negative relationship between CSR and financial performance, the new analysis for non-account measure (e.g., stock return) supports stakeholder theory by implying a positive relationship between CSR and financial performance, which directly opposes our previous analysis. (Results are available on request.) In consideration of these, future studies need to careful attention to the construction of measure in detail in the investigation of CSR-financial performance relationship, as the empirical results may imply opposing views depending on the use of financial measures.
Our results are significant as well from the perspective of theory development. While there are the aforementioned two contrasting views in the determination of CSR-performance relationship, it is largely unexamined how a specific component of CSR may affect financial performance measures in different ways. Yet, a wide range of studies pointed out a specific category of CSR activity may affect the financial performance distinctively in couple with our findings (e.g., Na & Hong, 2011).
The relationship between CSR and financial performance is still a controversial issue in the extant literature. This paper aims to investigate the CSR-performance relationship in the Korean financial market by using a new set of data and a new econometric approach. To be specific, we employ the ESG score published by the Korean Corporate Governance Service to measure a firm’s CSR activity. This ESG score covers a larger set of sample firms and is relatively free from potential upward bias in the CSR-performance estimation compared to the KEJI index, having been widely used in the literature. Furthermore, we also employ a panel regression model with firm fixed effects as our benchmark econometric model, which has been widely used in recent CSR studies (e.g., Cui et al., 2018).
Our empirical examination provides a number of interesting results. Most importantly, we found negative relationships between the ESG score and financial performance measures. This finding is particularly robust for the use of ROA and Tobin’s Q variable. We also found that each component of the ESG score affects a firm’s financial performance differently. Especially, a firm’s social and governance responsibilities affect its ROA substantially but its environment performance does not. The consideration of chaebol subsample does not alter the main results unlike the previous studies.
Our findings contribute to the literature in a number of aspects. Most of all, we provide a new piece of empirical evidence arguing for the traditional view of corporations (Friedman, 1962, 2007), which expects a negative CSR-performance relationship. In particular, we find robustly negative relationships between CSR and financial performance, when the total ESG score is examined as the independent variable. However, the coefficients on the ESG scores are not consistent with the stakeholder theory of firms, whether we employ the total ESG score or the E/S/G score separately. Next, our findings present new evidence arguing against prior studies in the Korean financial market. Furthermore, our findings directly confirm the possibility that each component of social responsibility affects a corporation’s financial performance in a different way. This finding requires future studies to have a detailed analysis for the combinations of CSR and financial performance measures. Finally, the consideration of special governance structure, chaebol, does not change the negative relationship in contrast to the recent studies highlighting special roles of chaebol in CSR policies.
The limitations for our research are as following. First, while we found strong evidence that each type of socially responsible activity affects a firm’s cash flow or market valuation/replacement value differently, we have not developed a specific theory to explain the relationship. For example, it would be desirable to study the relationship between CSR and financial performance in investment approach; in this case, new measures of the financial performance, such as ROIC (Return on Invested Capital) and ROI (Return on Investment), would be desirable to be considered. Second, although we adopted a panel regression approach along with firm-fixed effect, in order to control for unobserved firm heterogeneity and endogeneity for a variety of firm types such as chaebols and large- and small firms, other types of methodology, such as instrumental variables (IV), Heckman 2-stage estimation could also have been plausible choices to address endogeneity and selection bias, as suggested by previous researches (D. Choi et al., 2019; Garcia-Castro et al., 2010). Third, a variety of financial measures, such as accounting earnings and market return, could have been employed in order to better observe the effect of CSR practice depending on financial performance measures. This would provide improved implications for the relationship between CSR and financial performance, as the topic could be discussed in different perspectives. Moreover, if various financial measures are adopted, the relationship between CSR and financial performance for Korean firms could be debated in more international context. These issues are beyond the scope of this paper and is left for future research.
Supplemental Material
sj-docx-1-sgo-10.1177_21582440241255196 – Supplemental material for Corporate Social Responsibility and Financial Performance: New Evidence from the Korean Market
Supplemental material, sj-docx-1-sgo-10.1177_21582440241255196 for Corporate Social Responsibility and Financial Performance: New Evidence from the Korean Market by Bohyun Yoon, Jeong Hwan Lee and Jin Hyung Cho in SAGE Open
Footnotes
Data Availability Statement included at the end of the article
Declaration of Conflicting Interests
The author(s) declared no potential conflicts of interest with respect to the research, authorship, and/or publication of this article.
Funding
The author(s) received no financial support for the research, authorship, and/or publication of this article.
Supplementary Material
Supplemental material for this article is available online.
Data Availability Statement
Data is available on request to the corresponding author.
References
Supplementary Material
Please find the following supplemental material available below.
For Open Access articles published under a Creative Commons License, all supplemental material carries the same license as the article it is associated with.
For non-Open Access articles published, all supplemental material carries a non-exclusive license, and permission requests for re-use of supplemental material or any part of supplemental material shall be sent directly to the copyright owner as specified in the copyright notice associated with the article.