
Abstract
The smoking rate in Thailand has been steadily decreasing for decades alongside the government’s tobacco control policies. However, evidence of whether the decrease to date has occurred equally across all population groups is scarce. Therefore, this study aimed to examine the changes in the socioeconomic patterns of smoking among male adults in Thailand from 2001 to 2021. This study employed a pooled cross-sectional design with 296,011 male adults aged 15 years or older from the Health and Welfare Survey 2001 (n = 74,003), 2003 (n = 14,940), 2006 (n = 25,088), 2009 (n = 26,370), 2013 (n = 26,919), 2015 (n = 52,904), and 2021 (n = 75,787). Descriptive analysis and binary logistic regression were used. The results indicated that the smoking rate decreased by approximately 25% from 46.81% in 2001 to 35.01% in 2021. This decrease was significantly greater in high- and low-level socioeconomic groups than in mid-level groups. Specifically, high- and low-income, high- and low-educated, older, married and divorced, employed, and urban and rural people exhibited larger decreases in smoking rates than middle-income, middle-educated, middle-aged and younger, single, unemployed, and Bangkok metropolitan people, respectively. Additionally, the smoking rates of low-income groups decreased as cigarette retail prices increased, whereas those of high-income groups decreased regardless of tobacco control policies. The government’s price policy and health awareness may have significantly influenced the decrease in smoking rates of the low- and high-level socioeconomic groups, respectively. Therefore, the government should continue its price policy and public relations practices to further decrease smoking rates.
Introduction
Globally, smoking is a major cause of premature morbidity and mortality (GBD 2015 Tobacco Collaborators, 2017). According to the World Health Organization (WHO, 2022), smoking causes over 8 million deaths annually. The GBD 2015 Risk Factors Collaborators (2016) estimated that smoking resulted in 148.6 million disability-adjusted life years (DALYs) annually, which was ranked second among the 10 largest contributors to global DALYs in 2015. Moreover, smoking has been identified as a risk factor for fatal and non-fatal diseases, such as lung or other cancers, cardiovascular diseases, and chronic respiratory diseases (Drope et al., 2018).
In Thailand, smoking is the first risk factor for premature mortality and disability, especially for people with cancers, cardiovascular disease, and chronic pulmonary obstructive disease (Aungkulanon et al., 2019). The Burden of Disease Research Program Thailand (2018) estimated that tobacco smoking caused 55,000 deaths annually, which was approximately 11% of total deaths in 2014. In addition, smoking was found to be the largest contributor to the country’s total number of DALYs from 2009 to 2019 (Institute for Health Metrics and Evaluation, 2023).
The government responded to this issue by implementing tobacco control policies. Specifically, Thailand ratified the WHO Framework Convention on Tobacco Control in 2004 and has since actively implemented tobacco control policies. These policies generally include cigarette tax increases; designation of smoke-free zones; cigarette warning labels; and bans on advertisements, promotions, and sponsorships of tobacco products (Patanavanich & Glantz, 2020). Consequently, the overall smoking rate decreased from 22.98% in 2004 to 19.1% in 2017 (Pitayarangsarit & Pankrajang, 2018).
However, evidence of whether this decrease occurred equally across all population groups in Thailand is scarce. Multiple cross-sectional studies performed in Thailand indicated that the smoking rate tended to be higher among low-level socioeconomic groups than among mid- and high-level socioeconomic groups (Aekplakorn et al., 2008; Hammond et al., 2008; Jitnarin et al., 2011; WHO Regional Office for South-East Asia, 2011). Nevertheless, few longitudinal studies investigated how this cross-sectional tendency changed over time in Thailand.
To the best of our knowledge, only two longitudinal studies examined the aforementioned issue (Pitayarangsarit & Pankrajang, 2018; Sangthong et al., 2012). These studies showed that the smoking rate decreased, especially among high- and low-level socioeconomic groups. As a result, the gap in smoking rates across socioeconomic groups decreased. However, the smoking rate remained high among low-level socioeconomic groups. Specifically, the low-income, low-educated, low-wage labor, and rural groups exhibited persistently higher smoking rates than the other groups. This cross-sectional pattern was also observed in the previously mentioned cross-sectional studies.
In Thailand, most smokers are men. For instance, in 2017, 37.7% of all men in Thailand were smokers, whereas 1.7% of the females were smokers (Pitayarangsarit & Pankrajang, 2018). Moreover, the socioeconomic patterns of smoking were found to differ across sexes in Thailand (Aekplakorn et al., 2008; Jitnarin et al., 2011). However, these previously performed longitudinal studies did not analyze males and females separately. Therefore, the results of these studies may have either been overestimated or underestimated. This issue was also observed in most of the previously mentioned cross-sectional studies. In addition, the previous longitudinal studies showed trends in smoking rates using only descriptive statistics. Thus, a study using a causal methodology is needed to examine the differences in trends across socioeconomic groups and whether such differences are significant.
Therefore, this study aimed to examine the changes in the socioeconomic patterns of smoking among male adults in Thailand from 2001 to 2021. This study had two specific objectives. The first objective was to explore the smoking rate and its trend by socioeconomic group among male adults after the government implemented tobacco control policies to evaluate how these policies affected smoking behavior. The second objective was to examine the cross-sectional socioeconomic pattern of smoking and how this pattern changed over time among male adults to evaluate whether the gap in the smoking rate across socioeconomic groups was alleviated.
Methods
Design and Data
This study employed a pooled cross-sectional design with data from the Health and Welfare Surveys (HWSs) of 2001, 2003, 2006, 2009, 2013, 2015, and 2021. The HWS, which is a biannual survey conducted by the National Statistical Office of Thailand, comprises a nationally representative sample of the entire population of Thailand and its comprehensive demographic, socioeconomic, and health-related information (Meemon & Paek, 2020). Before this study was conducted, more years of HWS data, such as HWS 20017 and 2019 data, were obtained from the National Statistical Office. However, because these data did not contain information on smoking behavior, they were excluded from the study.
In this study, male individuals aged 15 years or older were defined as adult males (WHO, 2021). Male adults were extracted from all the HWS data and combined into a pooled cross-section. After eliminating 2% to 3% erroneous or missing values, the pooled cross-sectional data used in this study included a total of 296,011 male adults, of which 74,003, 14,940, 25,088, 26,370, 26,919, 52,904, and 75,787 fell under HWS 2001, 2003, 2006, 2009, 2013, 2015, and 2021 data, respectively.
Measurement
Smoking status (dependent variable) was measured as a binary variable: yes (those who currently smoked) or no (those who had never smoked or quit smoking). Six demographic and socioeconomic factors were used as independent variables: income, age, marital status, education, employment, and place of residence.
Income was measured as individual income quartiles ranging from Q1 to Q4, with higher quartiles indicating higher income. To measure the income quartile, we used the equivalent income, which is income standardized for a single-person household. The equivalent income was calculated by summing individual incomes in each household and dividing the result by the square root of the total number of members in the household (Organization for Economic Co-operation and Development, 2009). In 2021, the income threshold for Q1 was 5,196 baht, equivalent to approximately 152 USD when the baht-USD exchange rate of 1 baht = 0.029 USD was applied. The income thresholds for Q2, Q3, and Q4 were 9,000, 15,000, and 24,748 baht, equivalent to approximately 264, 440, and 726 USD, respectively.
The age categories considered were 15–24, 25–34, 35–44, 45–54, 55–64, and 65 years or older. Employment was measured as a binary variable: yes or no. Marital status, education, and place of residence were measured as categorical variables on three levels. Marital status was categorized as single, married, or divorced. The “divorced” category included divorced, widowed, and separated people. Education was categorized as low (primary school or below), middle (secondary school), and high (college or above). Place of residence was categorized as the Bangkok metropolitan, urban, and rural areas. Thailand comprises 77 provinces. The “the Bangkok metropolitan area” category included the Bangkok Capital City and the five adjacent provinces of Nakhon Pathom, Pathum Thani, Nonthaburi, Samut Prakan, and Samut Sakhon. Except for the Bangkok metropolitan area, municipal and non-municipal areas were defined as urban and rural areas, respectively (Lambregts et al., 2015). Appendix 1 presents the descriptive statistics of the study sample and variables.
Statistical Analysis
Descriptive statistical analysis was performed to accomplish the first objective of this study. We used the percentage change to examine the decrease in smoking rate between 2001 and 2021. This percentage change was calculated by subtracting the smoking rate in 2001 from the smoking rate in 2021 and then dividing the subtracted score by the smoking rate in 2001. Additionally, chi-squared and Cochran-Armitage trend tests were conducted to compare the differences in the smoking rate across levels of each independent variable and the differences in the smoking rate across the years, respectively (Park et al., 2019).
In addition, because the dependent variable (smoking status) was a binary variable, a binary logistic regression (BLR) analysis was conducted to accomplish the second objective of this study (Hosmer & Lemeshow, 2000; Meemon et al., 2022). Specifically, because this study revealed two large decreases in the overall smoking rate from 2001 to 2021 in the descriptive statistical analysis (Figure 1), we grouped the years in the pooled cross-sectional data into three periods by creating time dummy variables: Period 1 (2001–2003), Period 2 (2006–2015), and Period 3 (2021). Period 1 was set as the base period for comparison.

Trends of smoking rates among male adults aged 15 or older, 2001 to 2021.
Three separate BLR analyses were performed for each period to examine the cross-sectional socioeconomic patterns of smoking. Then, by including the interaction term between the time dummy variables (Periods 2 and 3) and the independent variables, a BLR analysis (indicated as pooled BLR in Table 2 and Appendix 2) was conducted to examine changes in the socioeconomic pattern of smoking over time.
Before the BLR models were developed, two preliminary analyses were performed to examine potential multicollinearity problems among the independent variables. These analyses included a correlation analysis and a cross-comparison between the crude and adjusted odds ratios. For the correlation analysis, Spearman’s correlation analysis and Cramer’s V were used to examine the correlation between ordinal variables and between nominal variables, respectively. Correlation coefficients ranging from .04 to .58 indicated no extremely large correlations among the independent variables (Zhang et al., 2009). However, the cross-comparison showed a large directional switch between the crude and adjusted odds ratios for most of the independent variables, indicating considerable multicollinearity among the independent variables (Ling et al., 2020). Thus, this study used a simple BLR analysis to individually assess the independent variables.
Statistical significance was set at p < .05. For BLR analyses, the odds ratio and 95% confidence interval were used to determine the directional association and its statistical significance, respectively. All statistical analyses were conducted using IBM SPSS Statistics version 20.
Results
Tobacco Control Policy from 2001 to 2021
Thailand implemented a comprehensive tobacco-control policy after the WHO Framework Convention on Tobacco Control was ratified in 2004. The policy generally includes a price policy (i.e., a tax increase) and a non-price policy describing, for instance, the designation of smoke-free zones, cigarette warning labels, and bans on advertisements, promotions, and sponsorships for tobacco products (Patanavanich & Glantz, 2020). Figure 1 illustrates the main policy changes made during the study period of 2001 to 2021.
Regarding the price policy, six cigarette tax increases were implemented from 2001 to 2021. In 2001, the excise tax rate on ex-factory prices increased from 71.5% to 75%. It subsequently increased to 79% in 2005, 80% in 2007, 85% in 2009, 87% in 2012, and 90% in 2016. Regarding non-price policies, text-based and pictorial warning labels were implemented in 2005 and 2007, respectively. Smoke-free zones were introduced for indoor air-conditioned spaces in 2006 and extended to all indoor public and working spaces as well as outdoor public areas in 2010 (Patanavanich & Glantz, 2020; Yong et al., 2013).
Descriptive Statistical Analysis
Figure 1 and Table 1 present the results of the descriptive statistical analysis. As shown in Figure 1, the overall smoking rate decreased by approximately 25% from 46.81% in 2001 to 35.01% in 2021. Specifically, the smoking rate decreased by approximately 17% from 2001 to 2006, remained unchanged from 2006 to 2015, and again decreased by approximately 8% between 2015 and 2021. An 8% decrease from 2015 to 2021 was obtained by subtracting the average of the 2006–2015 smoking rates from the 2021 smoking rate, and then dividing the subtracted score by the average.
Trends of Smoking Rate by Independent Variable, 2001 to 2021.

Note. N/A = not available; p for Trend = p-value of the Cochran-Armitage trend test.
Interestingly, although the three taxes increased, and most non-price policies were introduced from 2006 to 2015, the smoking rate remained relatively unchanged during this period. This is probably because tax increases (i.e., increases in ex-factory prices) affected minor increases in actual cigarette retail prices, which may have caused compensatory behavior among smokers (i.e., switching from high-priced to low-priced cigarette brands) instead of reducing their smoking behavior (Husain et al., 2017; Patanavanich & Glantz, 2020; White & Ross, 2015).
Table 1 shows that the smoking rate decreased significantly among all socioeconomic groups except for the middle-level education group. Moreover, the decrease was larger among people with a high or low socioeconomic status than among those with a moderate socioeconomic status.
Regarding income, the decrease in smoking rate between 2001 and 2021 (percent change 2001–2021 in Table 1) was larger among people in Q1 (−32.23%) and Q4 (−31.24%) than among those in Q2 (−20.58%) and Q3 (−17.68%). Regarding education, high- (−37.30%) and low-educated people (−29.40%) presented larger decreases in smoking rates than middle-educated people (−4.50%). In addition, older, married, and rural people exhibited larger decreases in smoking rates than younger and middle-aged people, divorced and single people, and people living in urban area and the Bangkok metropolitan area, respectively. In terms of employment, the decrease in smoking rate was similar between employed (−22.69%) and unemployed people (−23.30%).
In particular, regarding income, although the decreases in smoking rates among the highest- and lowest-income groups were similar, their patterns differed. For people in Q1, the smoking rate decreased as retail cigarette prices increased, following the pattern shown in Figure 1. This pattern was also observed for Q2. Meanwhile, in Q4, the smoking rate decreased regardless of tax increases or the introduction of non-price policies. The smoking rate of people in Q4 decreased by approximately 29% from 38.64% in 2001 to 27.26% in 2006. Subsequently, it remained relatively constant. A similar pattern was observed for Q3.
Despite the decrease in the smoking rate, the cross-sectional pattern of smoking did not change from 2001 to 2021. During this period, low-income, low-educated, middle-aged, married and divorced, employed, and rural individuals had persistently higher smoking rates than their counterparts.
However, a difference was found regarding age, as the oldest group (aged 65 years or older) exhibited the largest decrease in smoking rate, whereas the youngest group (aged 15–24 years) exhibited the smallest decrease. The smoking rate was higher in the oldest group than in the youngest group from 2001 to 2009; however, the pattern was reversed or similar afterward.
Binary Logistic Regression Analysis
Table 2 presents the results of the BLR analysis. For the pooled BLR analysis, only the results of the interaction effect between the time dummy variables and the independent variables were provided. Appendix 2 presents the complete results of the pooled BLR analysis. In the pooled BLR Period 3 (versus Period 1) model analyzing the change in the socioeconomic pattern of smoking between Periods 1 and 3, the decrease in smoking rate was significantly higher among people with high or low socioeconomic status than among those with middle socioeconomic status.
Results of Binary and Pooled Binary Logistic Regression Analyses.
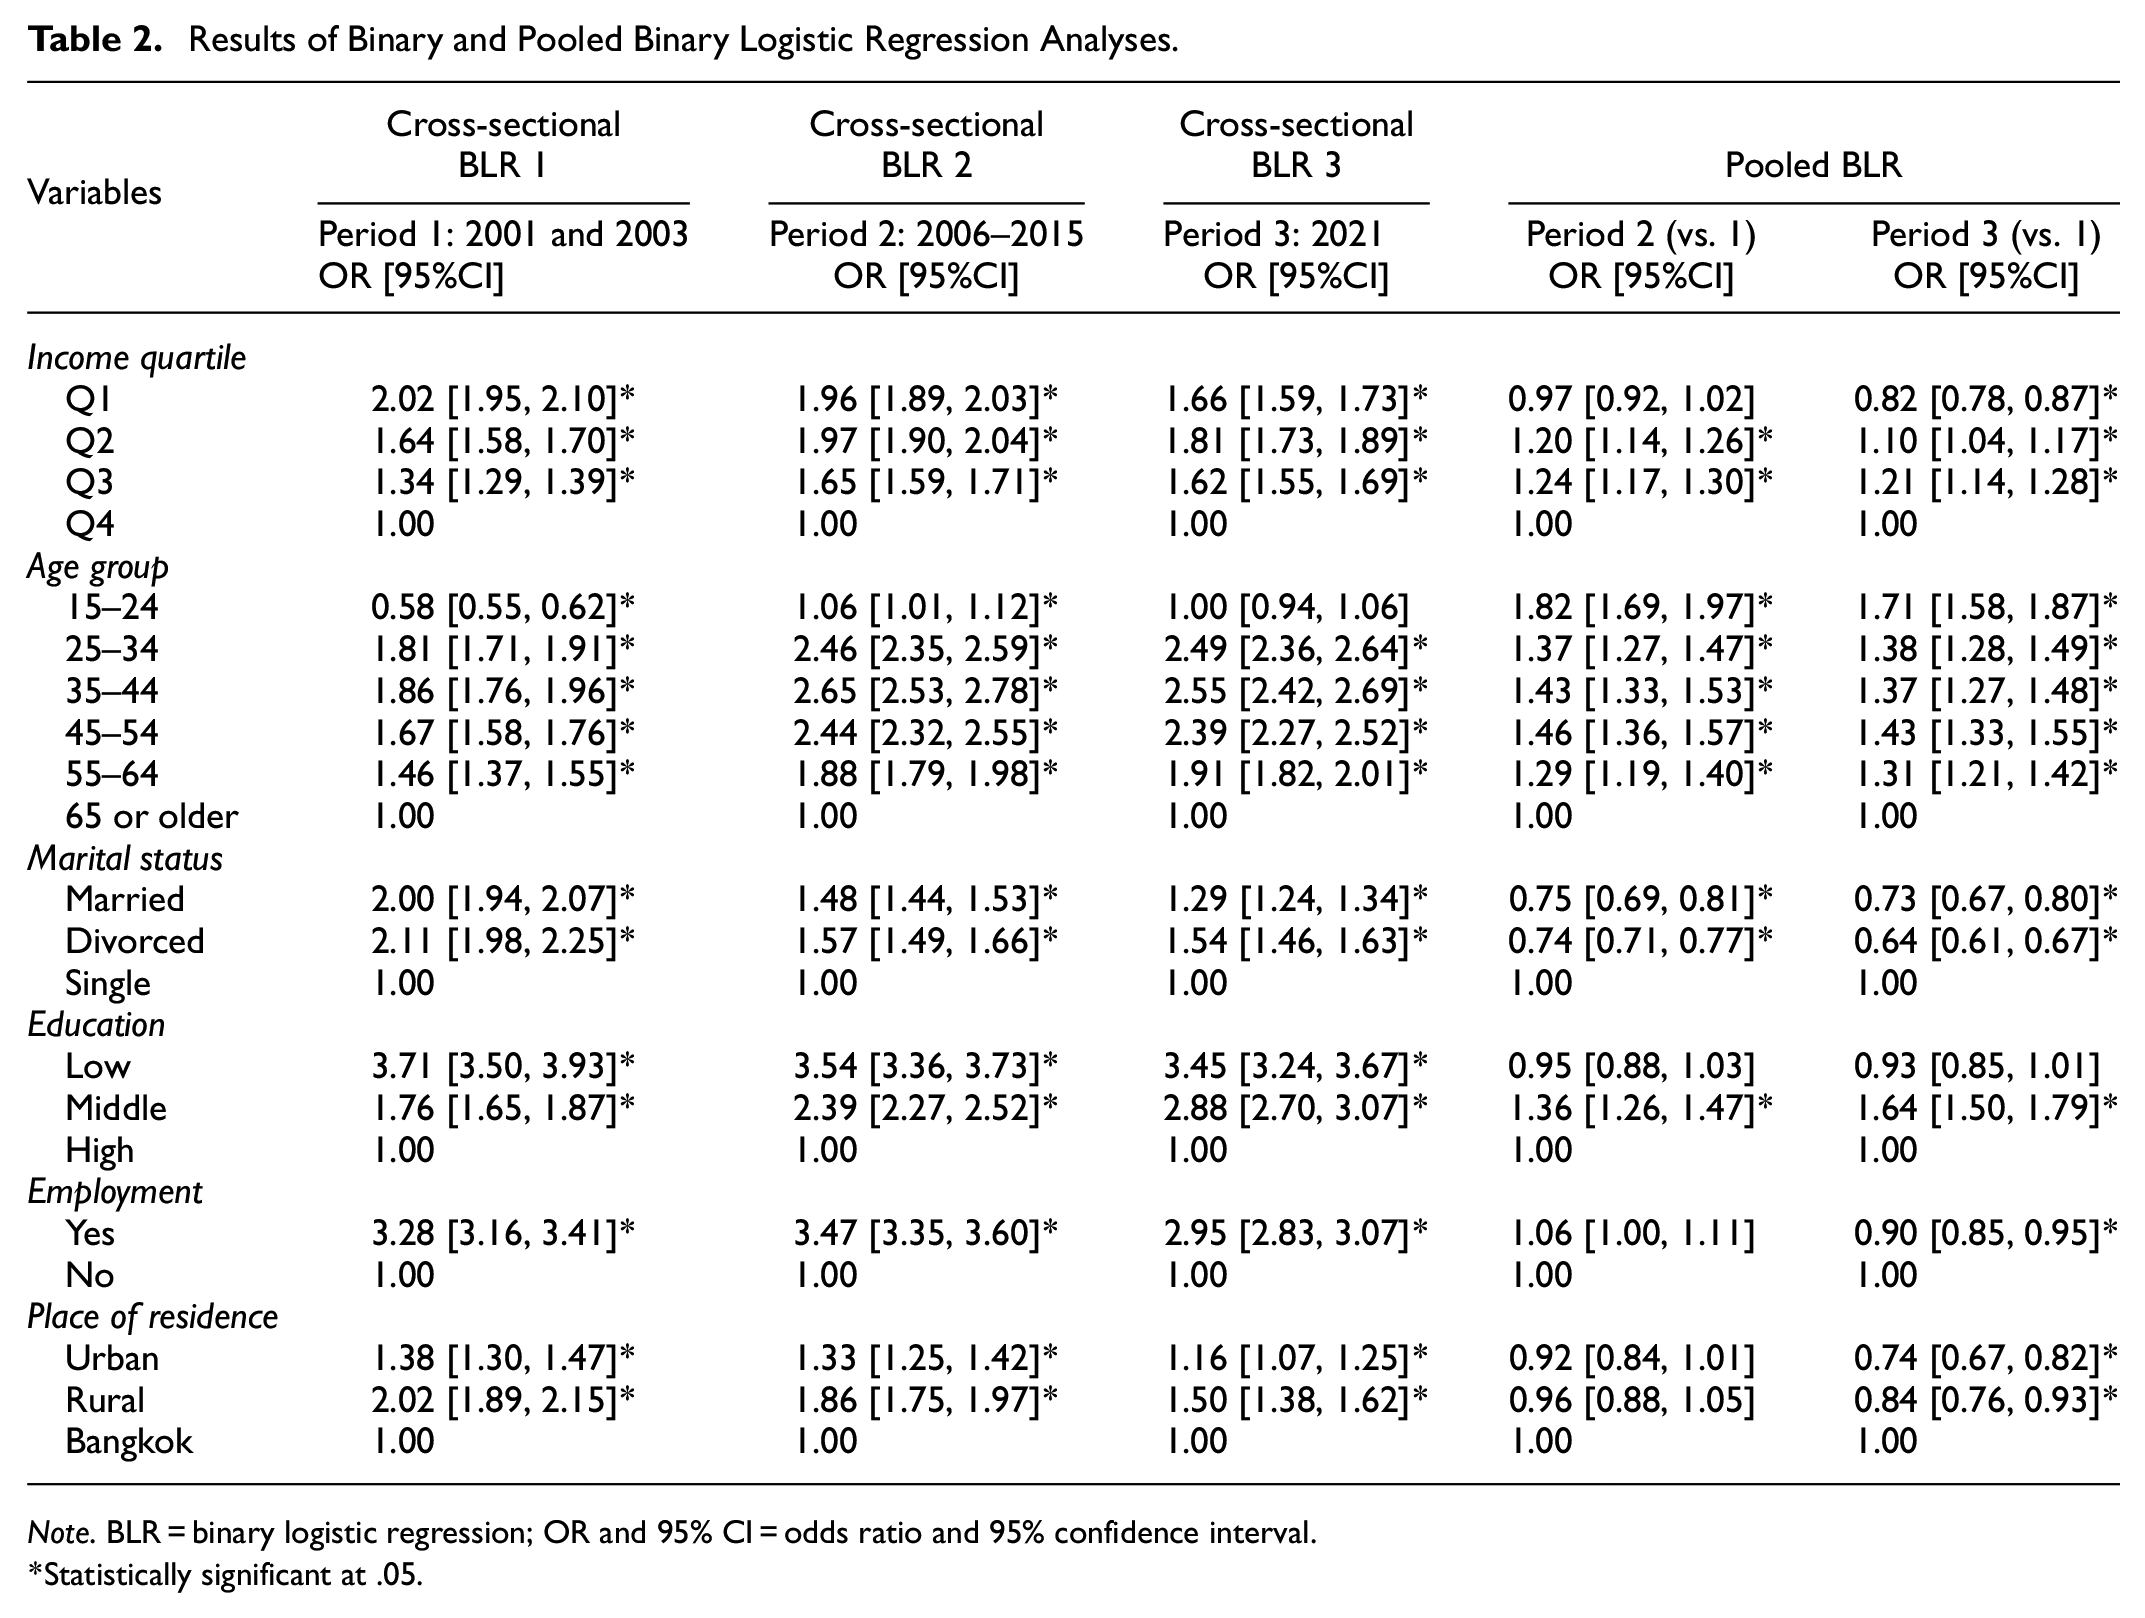
Note. BLR = binary logistic regression; OR and 95% CI = odds ratio and 95% confidence interval.
Statistically significant at .05.
Specifically, the decrease in smoking rate was the largest among people in the lowest income quartile Q1, followed by those in the highest quartile Q4, and those in the middle quartiles Q2 and Q3. The odds ratio of 0.82 in Q1 means that the decrease in the smoking rate among people in this quartile between Periods 1 and 3 was approximately 22% larger than the decrease observed in people in Q4. The odds ratios of 1.10 and 1.21 in Q2 and Q3 indicate that people in these quartiles had 10% and 21% smaller decreases in smoking rates, respectively, than those in Q4.
The decrease in smoking rate was approximately 64% higher among high- and low-educated individuals than among middle-educated individuals, whereas high- and low-educated individuals did not significantly differ. People in rural and urban areas had 35% and 19% larger decreases in smoking rates, respectively, than those in the Bangkok metropolitan area. The oldest group (aged 65 years or older) exhibited a 71% greater decrease in smoking rate than the youngest group (aged 15–24 years). Moreover, compared to single people, married and divorced people presented 37% and 56% greater decreases in smoking rates, respectively. Finally, employed people showed an 11% greater decrease in smoking rate than unemployed people.
Despite the decrease in smoking rate between Periods 1 and 3, the cross-sectional smoking pattern remained unchanged. The cross-sectional BLR 1–3 models showed that low-income, low-educated, and rural people were more likely to smoke than middle- and high-income people, middle- and high-educated people, and people living in urban area and the Bangkok metropolitan area, respectively. Additionally, middle-aged, married and divorced, and employed individuals were more likely to smoke than younger and older, single, and unemployed individuals, respectively.
Specifically, in 2021, people in Q1, Q2, and Q3 were 1.66, 1.81, and 1.62 times more likely to smoke, respectively, than those in Q4. The middle-aged groups (aged 25–65 years) were, on average, 2.34 times more likely to smoke than the oldest group (aged 65 years or older). Married and divorced individuals were 1.29 and 1.54 times more likely to smoke, respectively, than single individuals. Low- and middle-educated people were 3.45 and 2.88 more likely to smoke, respectively, than high-educated people. Employed people were 2.95 times more likely to smoke than unemployed people. Finally, people in urban and rural areas were 1.16 and 1.50 times more likely to smoke, respectively, than those in the Bangkok metropolitan area.
A noteworthy difference was observed with respect to the age. Specifically, the youngest group (aged 15–24 years) smoked significantly less than the oldest group (aged 65 years or older) in Period 1 (BLR model 1), but the smoking tendencies of these two groups were not significantly different in Period 3 (BLR model 3). This is because the oldest group exhibited the largest decrease in smoking rate from 2001 to 2021, whereas the youngest group exhibited the smallest decrease during this period, as indicated in the descriptive statistical analysis.
Discussion
This study, using pooled cross-sectional data of 296,011 Thai male adults aged 15 years or older from the HWS, investigated the changes in the socioeconomic pattern of smoking from 2001 to 2021. This study had two specific objectives. The first objective was to explore the smoking rate and its trend by socioeconomic group among male adults after the government implemented tobacco control policies to evaluate how these policies affected smoking behavior. The second objective was to examine the cross-sectional socioeconomic pattern of smoking and how this pattern changed over time among male adults to evaluate whether the gap in the smoking rate across socioeconomic groups was alleviated.
The results showed that the smoking rate decreased by approximately 25% from 46.81% in 2001 to 35.01% in 2021. Decreases occurred in almost all socioeconomic groups and were significantly larger in the high- and low-level socioeconomic groups than in the mid-level socioeconomic groups. Specifically, high- and low-income, high- and low-educated, older, married and divorced, employed, and urban and rural people exhibited larger decreases in smoking rates than middle-income, middle-educated, middle-aged and younger, single, unemployed, and Bangkok metropolitan people, respectively. Additionally, the smoking rates among low-income groups tended to decrease as cigarette retail prices increased, whereas those among high-income groups decreased, regardless of the tobacco control policies. Although these larger decreases reduced the gap in smoking rates across socioeconomic groups, the cross-sectional smoking patterns remained unchanged from 2001 to 2021. During this period, low-income, low-education, middle-aged, married and divorced, employed, and rural individuals had persistently higher smoking rates than their counterparts.
The government’s price policy may have significantly influenced the large decrease in smoking rates among the low-level socioeconomic group, which corroborates many previous studies in other countries that identified a greater price elasticity of cigarette demand among such individuals (Chaloupka et al., 2012; Cizmovic et al., 2022; Colman & Remler, 2008). For instance, for Krongthip, a popular cigarette brand in Thailand, the retail price for a 20-cigarette pack is 90 baht, equivalent to approximately 2.6 USD (Patanavanich & Glantz, 2020). Considering that the average price of a meal at a small restaurant is 40 to 50 baht (equivalent to approximately 1.2 to 1.5 USD), the 90-baht price may have imposed a substantial financial burden on smokers and served as a barrier for potential smokers. We also performed a post hoc analysis and found that the older, divorced, low-educated, and rural groups had persistently low income levels from 2001 to 2021. Thus, the decreased smoking rate among these groups may have been primarily due to price policy.
Health awareness may have been a primary reason for the large decrease in smoking rates among the high-level socioeconomic group. No studies directly examined the sequential relationship among socioeconomic factors, health awareness, and smoking behavior. However, many studies conducted in Thailand and other countries indicated that higher socioeconomic smokers (who are likely to be interested in their health and well-being) and older smokers (who probably have significant health concerns regarding smoking) were more likely to attempt to stop smoking than other people (Hymowitz et al., 1997; Li et al., 2010; Nargis et al., 2019; WHO Regional Office for South-East Asia, 2011). Such studies also showed that high-income, highly educated, old, male, married, and employed smokers made significantly more attempts to quit smoking than other smokers, which is consistent with the results of the present study.
Thus, the government should continue to strengthen its price policy as well as public campaigns and education programs to promote health awareness, thereby further decreasing smoking rates. Regarding the price policy, this study showed that the smoking rate remained relatively unchanged from 2006 to 2015, even though three tax increases were introduced during this period. This is probably because the tax increases caused minor increases in actual cigarette retail prices, which may have caused compensatory behavior among smokers (i.e., switching from high-priced to low-priced cigarette brands) instead of reducing their smoking behavior (Husain et al., 2017; Patanavanich & Glantz, 2020; White & Ross, 2015). Therefore, retail cigarette price changes should be monitored as price policies change.
Regarding public campaigns and education programs, the current public relations practices, which are usually implemented by displaying anti-smoking posters in public areas, should be improved by utilizing more diverse channels, such as mass media and the Internet, and increasing the frequency of exposure, as channel diversity and exposure frequency were found to significantly increase anti-smoking awareness and attitude in Thailand (Levy et al., 2008; Phetphum et al., 2023; Vichit-Vadakan et al., 2004).
Moreover, smoking prevention education has been included in the school curriculum (Ministry of Education, 2008). However, such direct face-to-face education programs are scarcely available to community members and should be taken into consideration by the government. For instance, smoking prevention education, which is offered to current smokers participating in smoking cessation programs in healthcare facilities, can be provided outside healthcare settings and extended to community people, including potential smokers. This requires close cooperation between local administrative and health authorities.
In addition, the relatively large decrease in the smoking rate among the high- and low-level socioeconomic groups led to improvements in socioeconomic inequality in smoking from 2001 to 2021. That is, the overall gap in the smoking rate across socioeconomic groups reduced, even though the smoking rate remained persistently higher in the low-level socioeconomic group than in the other groups.
However, age did not alleviate this inequality. The smoking rate did not decrease as much in the youngest group (aged 15–24 years) as in the other age groups. This result is inconsistent with many studies conducted in other countries indicating that price policies significantly affected the smoking rate among young people (Cizmovic et al., 2022; Nikaj & Chaloupka, 2014; Sweis & Chaloupka, 2014). However, this result is consistent with a previous study conducted in Thailand, which indicated that friends were the primary source of cigarettes among young people (Hammond et al., 2008).
This indicates that enforcement of the regulation of tobacco sales restrictions for people under the age of 20 years may have been ineffective. Although the cigarette retailer must verify the identification card of the buyer if the buyer’s age is doubtful by regulation, this rule may not have been implemented properly. In addition, the sale of tobacco products via the Internet is prohibited in Thailand (Bureau of Tobacco Control, 2017). However, internet vendors selling illicit cigarettes, such as electronic cigarettes and smuggled cigarettes, which are cheaper than Thai cigarettes, are becoming increasingly available (Chankaew et al., 2022; The National Thailand, 2023). This may have increased cigarette accessibility among younger youths. Therefore, the government should strictly enforce these regulations by inspecting and monitoring cigarette retail shops and internet vendors. Simultaneously, the accessibility and purchasing behavior of cigarettes among younger youths should be regularly examined and monitored.
Moreover, smoking prevention education is included in the school curriculum. However, a previous study found that approximately 30% of high school students never received smoking prevention education at school (Phetphum et al., 2023). This suggests that the government should assess whether the smoking prevention education program in schools is properly implemented and whether it can accomplish its goal of promoting anti-smoking knowledge and attitudes.
The results of the present study are consistent with the findings of previous studies in Thailand, in which the smoking rate decreased, especially among people with high or low socioeconomic status (Pitayarangsarit & Pankrajang, 2018; Sangthong et al., 2012). Moreover, this study’s use of a causal methodology with only male adults, who made up the majority of smokers in Thailand, was able to offer a more precise estimation of the differences in these decreases across socioeconomic groups.
The results of this study are partly consistent with those of previous longitudinal studies conducted in other countries (Agaku et al., 2020; Amalia et al., 2019; Chang et al., 2019; Giskes et al., 2005; Nargis et al., 2015; Tanaka et al., 2021). Specifically, while the present study showed especially large decreases in the smoking rate among high- and low-level socioeconomic groups, the previous longitudinal studies in other countries showed large decreases in smoking only among high-level socioeconomic groups. This partial consistency is likely due to the relatively high affordability of cigarettes, as indicated by studies conducted in Bangladesh and Indonesia (Amalia et al., 2019; Nargis et al., 2015). However, the analytical methods used in this study differed from those used in previous studies conducted in other countries. Thus, differences in results should be evaluated systematically.
This study had several limitations that should be addressed in future studies. First, as the HWS data were not panel data, this study employed a pooled cross-sectional design by combining independent cross-sectional HWS data. Thus, it remains unclear whether the decrease in the smoking rate resulted from an increase in smoking cessation or an increase in the number of never-smokers. Second, the simple categorization of smoking status (yes or no) used in this study should be improved by considering the type and amount of smoking, as these factors were found to vary widely across socioeconomic groups in Thailand (Aekplakorn et al., 2008; Benjakul et al., 2013; Hammond et al., 2008; Husain et al., 2017; Jitnarin et al., 2011; White & Ross, 2015; WHO Regional Office for South-East Asia, 2011). Third, our preliminary cross-comparison between crude and adjusted odds ratios indicated confounding effects among the independent variables. Accordingly, future studies should consider various potential interactions across socioeconomic groups (e.g., older-single versus younger-single people and high-income versus low-income older people) to obtain more precise socioeconomic patterns of smoking.
Fourth, women’s smoking behavior and its changes, which were not covered in this study, need to be explored in future studies. Some longitudinal studies in other countries, particularly those conducted in certain European countries (Giskes et al., 2005) and Turkey (Hassoy et al., 2021), indicated that the gap in smoking rates across socioeconomic groups widened inversely among women. Specifically, they showed that the smoking rate among women with a high socioeconomic status tended to increase, whereas that among those with a low socioeconomic status tended to decrease or remain unchanged over time. In addition, a previous cross-sectional study conducted in Thailand showed that women’s smoking behavior differed from that of men, particularly in terms of place of residence and occupational status (Jitnarin et al., 2011). Therefore, a study examining smoking behavior and its changes among women is needed to provide a more comprehensive understanding of the changes in socioeconomic patterns of smoking in Thailand. Finally, the validity of our interpretation and discussion of the results, particularly regarding price policies and health awareness, should be investigated in future empirical studies.
Conclusion
This study, using pooled cross-sectional data of 296,011 Thai male adults aged 15 years or older from the HWS, examined the changes in the socioeconomic pattern of smoking from 2001 to 2021. The study results indicated that the smoking rate decreased by approximately 25% from 46.81% in 2001 to 35.01% in 2021. Decreases occurred in almost all socioeconomic groups and were significantly larger in the high- and low-level socioeconomic groups than in the mid-level group. Additionally, the smoking rates of low-income groups tended to decrease as cigarette retail prices increased, whereas those of high-income groups decreased regardless of tobacco control policies. The government’s price policy may have significantly influenced the large decrease in the smoking rate among the low-level socioeconomic group. Health awareness may have been a primary reason for the large decrease in smoking rates among the high-level socioeconomic group. Therefore, the government should continue its pricing policy and public relations practices to further decrease smoking rates.
Footnotes
Appendix
Full Results of the Pooled Binary Logistic Regression Analysis.

| Variables | Main effect | Time interaction effect | Time interaction effect |
|---|---|---|---|
| Period 2 (vs. 1) | Period 3 (vs. 1) | ||
| OR [95% CI] | OR [95% CI] | OR [95% CI] | |
| Income quartile | |||
| Q1 | 2.12 [2.04, 2.20]* | 0.97 [0.92, 1.02] | 0.82 [0.78, 0.87]* |
| Q2 | 1.72 [1.66, 1.79]* | 1.20 [1.14, 1.26]* | 1.10 [1.04, 1.17]* |
| Q3 | 1.40 [1.35, 1.46]* | 1.24 [1.17, 1.30]* | 1.21 [1.14, 1.28]* |
| Q4 | 1.00 | 1.00 | 1.00 |
| Age group | |||
| 15–24 | 0.55 [0.52, 0.58]* | 1.82 [1.69, 1.97]* | 1.71 [1.58, 1.87]* |
| 25–34 | 1.72 [1.62, 1.81]* | 1.37 [1.27, 1.47]* | 1.38 [1.28, 1.49]* |
| 35–44 | 1.76 [1.67, 1.86]* | 1.43 [1.33, 1.53]* | 1.37 [1.27, 1.48]* |
| 45–54 | 1.58 [1.50, 1.67]* | 1.46 [1.36, 1.57]* | 1.43 [1.33, 1.55]* |
| 55–64 | 1.39 [1.30, 1.47]* | 1.29 [1.19, 1.40]* | 1.31 [1.21, 1.42]* |
| 65 or older | 1.00 | 1.00 | 1.00 |
| Marital status | |||
| Married | 1.90 [1.84, 1.96]* | 0.75 [0.69, 0.81]* | 0.73* [0.67, 0.80]* |
| Divorced | 2.00 [1.88, 2.14]* | 0.74 [0.71, 0.77]* | 0.64* [0.61, 0.67]* |
| Single | 1.00 | 1.00 | 1.00 |
| Education | |||
| Low | 3.90 [3.68, 4.13]* | 0.95 [0.88, 1.03] | 0.93 [0.85, 1.01] |
| Middle | 1.84 [1.74, 1.96]* | 1.36 [1.26, 1.47]* | 1.64 [1.50, 1.79]* |
| High | 1.00 | 1.00 | 1.00 |
| Employment | |||
| Yes | 3.12 [3.00, 3.24]* | 1.06 [1.00, 1.11] | 0.90 [0.85, 0.95]* |
| No | 1.00 | 1.00 | 1.00 |
| Place of residence | |||
| Urban | 1.45 [1.36, 1.54]* | 0.92 [0.84, 1.01] | 0.74 [0.67, 0.82]* |
| Rural | 2.12 [1.99, 2.25]* | 0.96 [0.88, 1.05] | 0.84 [0.76, 0.93]* |
| Bangkok | 1.00 | 1.00 | 1.00 |
| Time dummy variable | |||
| Period 2: 2006–2015 | 0.65 [0.63, 0.68]* | ||
| Period 3: 2021 | 0.60 [0.57, 0.62]* | ||
| Period 1: 2001 and 2003 | 1.00 | ||
Note. OR and 95% CI = odds ratio and CI, 95% confidence interval.
Statistically significant at .05.
Declaration of Conflicting Interests
The author(s) declared no potential conflicts of interest with respect to the research, authorship, and/or publication of this article.
Funding
The author(s) received no financial support for the research, authorship, and/or publication of this article.
Data Availability Statement
The data that support the results of the current study are available from the National Statistical Office of Thailand but restrictions apply to the availability of these data, which were used under license for the current study, and so are not publicly available. Data are however available from the authors upon reasonable request and with permission of the National Statistical Office of Thailand.
References

