
Abstract
The article reviews the concept of vulnerability and develops a framework for vulnerability to education inequality (VEI). It further reviews the concept of education inequality and develops a framework for the cumulative measuring instruments of inequality of education. The schooling vulnerability processes are developed to understand the migration of susceptible children in susceptible compartment to tragedy compartment and later migrate to resilience compartment. For statistical testing, the article develops tangible hypotheses arising from the VEI framework. These theoretical hypotheses could serve as valuable guidelines for predicting the degree of susceptibility that triggers the prevalence of inequality of education among the school-age children. The findings show that the VEI framework contains various stimuli, arranged in cubicles, attributable to within-education (WE), socioeconomic status (SES), and school physical environmental (SPE) stimulus. Consequently, a VEI structural model (VEISM) is proposed, representing a structural equation framework that captures the latent and manifest indicators of the VEI cubicles. Because intervention was built into the VEI framework, the mediation and moderation effects are captured in the VEISM for examination. Nevertheless, further research should be concentrated on macroeconomic indicators, for example, sociopolitical instability, war and economic upturn risks that could trigger a school-age child been vulnerable to education inequality. Finally, susceptibility → tragedy → resilience discovered in the article, with epidemiological properties, requiring a further mathematical and epidemiological modeling.
Keywords
Introduction
The concern over the last century was on the potential impact of schooling on earning ability (Akgüç, 2011). For example, Mincer (1974) laid emphasis on the individual earnings that depend on the total years spent in education and the quadratic function of the years of potential experience in the labor market. Fortunately, for around two decades now, studies have shown concern over educational risks as a cause of school dropout that bring deleterious impact on developing countries (Lehr et al., 2004; Manlove, 1998; Rumberger, 2001; Woodward & Fergusson, 2000). Consequently, research on the harmful impact of early dropout of school-age children have gained currency recently (United Nations Educational, Scientific and Cultural Organization [UNESCO], 2015). The early dropout of millions of children, which causes education inequality, is a major source of poverty. Despite concerns expressed, little have been done to check child dropout, which explains why school-age children in the developing countries are substantially susceptible to educational deprivation.
Furthermore, since the acknowledgment of human capital in endogenous growth models (Lucas, 1988; Romer & Sasaki, 1984), 1 there has been a steep rise in academic works focusing on human capital as a critical pillar of economic development, which has driven developing countries to invest in skills and human capital development (Damon et al., 2016). Either directly or indirectly this has helped reduce out-of-school children (adolescent and youth) from 377.5 million in 2000 to 263 million in 2016 as dropouts became an important component of youth enrolled in technical and vocational institutes. However, one out five children globally were still victims of out-of-school in 2016 (UNESCO Institute of Statistics [UIS], 2018), though the disproportionate gender ratio improved significantly in 2000–2016. For example, the gender analysis for primary schooling age was 58.3 million and 42.5 million in 2000 but reduced to 34.3 million and 29.1 million representing out-of-school for female and male, respectively, in 2016. Similarly, the upper secondary schooling age for female and male in 2000 was 92.7 million and 84.4 million but reduced to 67.4 million and 71.1 million in 2016.
Importantly, social vulnerability facing school-age children has hardly received research attention. Where such studies exist they are mainly associated with dropouts caused by exam failures, and disciplinary actions (Cuellar & Markowitz, 2015; Hemphill et al., 2014; Woodward & Fergusson, 2000). It was not until recently that social vulnerability was introduced into education analytics (Tietjen & Zdrojewski, 2010). Although school aged children were addressed in overall dropout rates, there was little attempt to identify the causes, and hence, child susceptibility to education inequality. Also, neither did past studies conceptualize social susceptibility adequately nor did they examine social resilience. Rather, attention was on aspects representing areas critical to the “understanding the status of the education sector” (Tietjen & Zdrojewski, 2010, p. 2). Besides, the dominant conceptual model on education vulnerability did “not help to predict the probability that a particular child at the time of schooling will become a victim of” education inequality (Begun, 1993, p. 29). Their focus was to help policymakers identify the risk areas mentioned as pillars and to understand areas where attention should be placed. In other words, the study addressed broad education sector vulnerabilities without a profound focus on children, which obviously raises questions on how educational vulnerability and inequality should be examined. In doing so, it would be critical to identify the covariate indicators for measuring education inequality, as well as the indicators of vulnerability that cause education inequality.
Thus, the objective of this article is to conceptualize the predictors of social vulnerability that could cause education inequality among school-age children. Specifically, this article aims to (1) review the concept of social vulnerability and explain how it is associated with education inequality; (2) develop a measurement framework for education inequality; and (3) propose a conceptual framework to study the impact of social vulnerability on education inequality. The rest of the article is divided into five sections.
The Review
This section presents the review on general issues of educational risks and inequality, defines vulnerability and how vulnerability affects inequality of education. The section concludes with the understanding of equality versus inequality of education.
Overview
Several economic education experts have long concluded that education has intrinsic value to economic growth, earnings, and living standard (Barro, 2013; Card & Krueger, 1992; Krueger & Lindahl, 2001; Psacharopoulos, 1985). They have identified the schooling risks to capture a school-age child falling out-of-school system (Finn, 1989; Reynolds, 1991). For example, Reynolds (1991) emphasized poverty and low-income families as the schooling risks while Finn (1989) emphasized on lack of school participation. Thus, the trend of education inequality arising from out-of-school children has been focused mainly on the schooling risks (Barrington & Hendricks, 1989; Lehr et al., 2004; Manlove, 1998; Rumberger, 2001; Woodward & Fergusson, 2000). Also, earlier studies devoted their effort in analyzing student vulnerability in connection to chronic health issues, particularly HIV/AIDS, and education disadvantage (Dullabh & Sykes, 2012; Jukes et al., 2008). What these economic education experts have not covered is the simple truth about measuring the school-age vulnerability to education inequality (VEI). As mentioned, they have not been most confident to link the schooling risks affecting school-age children with susceptibility. The most recent work was on education sector vulnerability where the study was sector bias instead of school-age child focused (Galleto & Bureros, 2017; Tietjen & Zdrojewski, 2010) and student vulnerability which focus on student research (Dullabh & Sykes, 2012). Although risk is interchangeably used with vulnerability, vulnerability deals with human condition or process (Pelling et al., 2004). The vulnerability study helps to suspect the group likely to be a victim of an extreme event. Identifying the susceptibility of a school-age child demands understanding the measurement variables of VEI.
Furthermore, education is a public good (Anomaly, 2018) to which all children should have equal access at all educational levels (Lehr et al., 2004). However, the story of equal access is not the same across countries as inequality permeates the educational system arising from pulled and pushed educational risks disrupting equal distribution (Barro & Lee, 2010). In the context of educational development, prevention is required to rescue the susceptible children from the back door of unequal access to the center of human development (Hicks, 1997; Rao et al., 2017; United Nations Development Programme [UNDP], 1990). The prevention mission would assist the children to gain freedom through education (Ibourk & Amaghouss, 2012; Psacharopoulos & Arriagada, 1986; Sen, 1999; United Nations Development Programme, Human Development Report [UNDP-HDR], 2017). In this vein, attention was paid to enrolment and attainment in previous studies (Agrawal, 2014; Maas & Criel, 1982; Thomas et al., 2001). Likewise, educational enrolment was included in the model of Inequality-Adjusted Human Development Index (I-HDI) (Hicks, 1997), depicting that human development correlates with the provision of enrolment to all children. The position was that the growth of education does not depend on “educational expenditure but also accompanied by significant increments in enrolment at each level of education” (Bakar, 2006, p. 46). Noticing this development, education for all (EFA) wield its efforts toward integrating everyone into educational development process (Psacharopoulos & Arriagada, 1986; United Nations Educational, Scientific and Cultural Organization, Education For All [UNESCO-EFA], 2015).
However, in the developing countries, these global efforts to give equal access are always “confronting the stubborn challenge of persistent inequality” (Rao et al., 2017, p. 1). High educational inequalities suggest that many registered students did not complete their educational processes to the highest grade. For example, as in UNESCO (2015), Roser and Ortiz-Ospina (2018) described out-of-school children as “children of official primary school age who are not in primary or secondary education” (p. 1). Thus, dropout is an education inequality indicator and a problem which permeates developing countries’ economies. For example, in the sub-Saharan African (SSA) countries with highest statistics, 48% of children of out-of-school come from the poorest quintile of income distribution and 34% from the rural; while only 10% in the upper quintile of income distribution and 16% from the urban (UNESCO, 2018). It implies that this group has little chance of benefiting from the gains of education (Rouse & Fantuzzo, 2009). With this development, studies on out-of-school were conducted to evaluate why some children were out-of-school, which triggerred inequality of education (Barrington & Hendricks, 1989; Lehr et al., 2004; Manlove, 1998; Rumberger, 2001).
As such, arguments were built around school age pregnancy (Manlove, 1998), nonparticipation in school activities (Finn, 1989; Jakobsen et al., 2012), poor achievement, and poor attendance (Barrington & Hendricks, 1989). Evidence showed that out-of-school correlates with poverty regarding the individual victims (Lehr et al., 2004) and society (Woodward & Fergusson, 2000). Economically, the payoff in the differences in educational attainment includes lower income, unemployment, and poverty (Lewis, 1966; McIntosh et al., 2008; Rouse & Fantuzzo, 2009). With this overview, the next subsection discusses vulnerability and its link with children falling into education inequality pit (EIP). Hence, subsection “Vulnerability Versus VEI” addresses the Objective 1. “Education Inequality” and “Identifying Measurement Variables for VEI” sections address Objectives 2 and 3, respectively.
Vulnerability Versus VEI
It should be noted that literature on VEI is narrowed. Although there are few works on education vulnerability, the studies focused on identification of educational risks (Tietjen & Zdrojewski, 2010) and vulnerability in respect to education policy (Galleto & Bureros, 2017).
Vulnerability is a concept that is difficult to draw a universal definition (Birkmann, 2006), because of its application to different disciplines (Makoka & Kaplan, 2005). For example, in hazard studies of vulnerability, Brooks (2003) argued that earlier studies perceived vulnerability in two ways. It was viewed either as the quantity of damage caused (Jones et al., 2004) or “a state that exists within a system before it encounters a hazard event” (Allen, 2003, p. 3). These two conditions were summarized as biophysical and social vulnerabilities (Allen, 2003; Brooks, 2003; Jones et al., 2004). The biophysical vulnerability has the characteristic of “a function of hazard, exposure and sensitivity” (Allen, 2003, p. 4). Thus, sensitivity is the extent to which an event affected the system, either negatively or positively (Brooks, 2003; Intergovernmental Panel on Climate Change [IPCC], 2001), whereas the social vulnerability possesses the features of inequality, poverty, food deprivation, marginalization, housing quality, and access to insurance in measuring an event (Adger & Kelly, 1999; Blaikie et al., 1994; Brooks, 2003). However, at a point, Brooks disagreed with the understanding of social vulnerability as a function of hazards. Instead, it should be hazard specific event.
What is biophysical and social vulnerabilities? Perception of the concepts changes overtime. For example, from biophysical argument, vulnerability is “the extent to which a system is vulnerable to adverse effects of climate change and to what extent it is (un)able to adapt to such impacts” (Birkmann, 2006, p. 12). In Brooks, biophysical vulnerability “is a function of the frequency and severity (or probability of occurrence) of a given type of hazard” (Brooks, 2003, p. 4). However, Cutter et al. (2000) added that vulnerability is not an issue of biophysical alone. Rather, the construction of biophysical vulnerability interplays with social and cultural indicators. As such, there was “an ignorance of the anthropological literature on human-environment relations” (Cutter et al., 2000, p. 715). Furthermore, Cutter et al. (2000) defined vulnerability as “the potential for loss of property or life from environmental hazards.” Thus, the definition focused on social vulnerability (Cutter et al., 2000). The social vulnerability was redefined in later work as “partially the product of social inequalities—those social factors that influence or shape the susceptibility of various groups to harm and that also govern their ability to respond” (Cutter et al., 2003, p. 243). Specifically, Birkmann (2006) linked social vulnerability to the expectation of man, the survival. He defined it as a situation that “deals with the susceptibility of humans and the conditions necessary for their survival and adaptation” (Birkmann, 2006, p. 12). Here, the survival inclusion is attached to human conditions. The human conditions are best defined by Pelling et al. (2004) as “a process resulting from physical, social, economic and environmental factors, which determine the likelihood and scale of damage from the impact of a given hazard” (p. 12). Still, the social vulnerability was broadly defined as the one that “encompasses all those properties of a system independent of the hazard(s) to which it is exposed, that mediate the outcome of a hazard event” (Pelling et al., 2004, p. 5). Likewise, in Blaikie et al. (1994), social vulnerability defines how social groups are susceptible to probable losses from risk events, launch resistance, and resilience toward various risk events (Cutter et al., 2000). Similarly, social vulnerability was seen as “a broader and long-term reduction of vulnerability would also require the and reflection of how we construe our relationship with nature” (Birkmann, 2006, p. 47). Here, the interaction of the human activities with nature helps to understand that hazards or certain events do not always happen by chance. The social nature of vulnerability summarizes the inequalities in wealth, income, education, and so on, that constitute hazard for human existence.
At this juncture, what is vulnerability? First, Bogardi (2006) defined vulnerability “as the predisposition to be hurt should an event beyond a certain (though again ill-defined) threshold of magnitude occurs and have impact on the society, its economic assets, the ecosystem, or its infrastructure” (p. 2). Second, according to IPCC (2001), vulnerability is “the degree to which a system is susceptible to, or unable to cope with, adverse effects of climate change, including climate variability and extremes” (p. 995). Thus, it is deducted that vulnerability has the characteristics of magnitude, character, the rate of exposure, the degree of sensitivity, and the capacity for its adaptation. Also, it has a “loss effect” either on the victims, society, or the infrastructures.
Specifically, about children in school, a school-age children vulnerability occurs when they “lack the capacity to grant consent themselves” (Dullabh & Sykes, 2012, p. 4). These children have “insufficient power, intelligence, education, resources, strength, or other needed attributes to protect their own interests, and are unable to provide free, voluntary, informed consent” (Dullabh & Sykes, 2012, p. 4). Conjecturally, the informed consents are the educational outcomes requires for proceeding to the highest level of education. When the ability is lacking to give best educational outcomes, education inequality ensued in the process, which correlates with future poverty due to schooling vulnerabilities. Also, the power might include the school attendance and participation. In this respect, “special justification is required for” rescuing the vulnerable group from EIP (Dullabh & Sykes, 2012, p. 4).
Hence, there are three levels identified from the preceding arguments on vulnerability. The three levels are regarded as a process in schooling vulnerabilities. The process entails susceptibility, tragedy, and resilience (STR). This process is presented as a framework in Figure 1.

Proposed STR framework for measuring schooling vulnerability.
Figure 1 shows the STR which measures the process of schooling vulnerability. Here, the susceptibility compartment, in other words, vulnerability represents the group that is into a critical condition or have challenges to impending danger either biophysical or social. The second compartment is the tragedy which represents the group that has been trapped with certain educational event while the third compartment is the resilience which represents the capability or the ability of the tragedy group to recover from the tragedy condition. At first stage, the primary occupation is to identify groups and subgroups that are susceptible (Begun, 1993). The stage is a prevention spectrum (e.g., protection from environmental threats,” especially reducing schooling risks; Begun, 1993). At this point, the onlookers (e.g., education and development policymakers, parents, and society) should step forward to rescue the vulnerable group in the process of entering the tragedy group (Goodin, 1985) before encountering education tragedy compartment. As such, vulnerability should be the type “that will be the target of prevention or intervention efforts” (Begun, 1993, p. 29). Failure to take responsibility triggers tragedy to occur (Goodin, 1985).
In education distribution, failure to take responsibility often occurs at the point of all levels of enrolment. At the enrolment point, candidates applying for enrolment are facing two challenges—enrolment (denial or granted) and educational attainment (drop out from any level or complete educational levels). The second stage is a situation where there is a proportion of the enrolled students trapped with education inequality which is often defined by educational attainment (Agrawal, 2014; Psacharopoulos & Arriagada, 1986; Thomas et al., 2001; Yi et al., 2012). This is postprevention stage requiring intervention by the stakeholders (Begun, 1993; Goodin, 1985). Stage 2 is characterized by being in tragedy compartment, the ability of the victims to think of being rescued, and the existing agency interest to rescue (Goodin, 1985). The third stage is the resilience which focuses on the ability or capability of the victim to recover from the extreme educational event that occurred (Galleto & Bureros, 2017). In our study, the extreme event is the dropping into an EIP region of education distribution. Like Begun (1993) and Birkmann (2006) described, the ability of the victim’s recovery depends on the four participants of schooling: (a) the student, (b) the parents, (c) the government (which comprises the school administration and education ministry), and (d) the economic environment. The role each play would assist in the recovery process from EIP even when the victim is ‘not at school age.’
Following the preceding arguments on vulnerability, it could be scientifically deduced that VEI is the extent to which a school-age-child would be susceptible to being trapped by education inequality during the educational grade levels’ transition, 2 un(able) to recover from the EIP and lack the ability/capability to control the future economic environment. Thus, the definition centered on susceptibility, tragedy, recovery, and outcome (Allen, 2003; Brooks, 2003). The outcome spectrum addresses the policy to rescue or reduce schooling vulnerabilities to strengthen education distribution within the economy.
Summarily, definition and processes of vulnerability had been explained from the context of biophysical and social vulnerabilities. There is a linkage between vulnerability and education distribution with the understanding that vulnerability correlates with education loss. Thus, vulnerability undergoes three processes—susceptibility, tragedy, and resilience (STR). Being that ascertained, another outstanding task before us is to understand the concept and measurement of education equality/inequality, and identification of the indicators of VEI. Arguably, the suspicion is that education completion matters if conscious efforts are provided at the point of primary school registration. This suspicion takes us to discuss equality and inequality of education in the next subsection.
Education Inequality
It is necessary to understand education inequality. This would provide enough understanding of how children are susceptible to unequal education during grade-level transitions. In so doing, this subsection presents different perceptions of education inequality.
The perception of inequality of education differs from one country to another and generated a continuous debate across scholars. This is because the inequality is not homogeneous across regions and countries (Boboc et al., 2012). Also, there is an existing philosophy that “education makes possible the social and economic mobility of the poor” (Mesa, 2007, p. 1). The philosophy focuses on the increasing of the quantity of universities to make the distribution of education hitch free to the seventh level. In other words, to achieve equality of education, more higher institutions should be created (Barro & Lee, 2010; Boboc et al., 2012; Bourdieu & Passeron, 1990). However, studies like Koucký et al. (2007) opposed the wisdom and argued that increasing universities does not make education equal because inequality exists in the countries with higher number of universities. Instead, S. R. Lucas (2001) and Ayalon et al. (2008) argued that what makes inequality disappear is accessibility, in other words, enrolment at all levels. For example, position of Lucas was that the “simple extension of universal access to institutions is unlikely to undo the effective power of social resources indexed by common indicators of social background” (S. R. Lucas, 2001, p. 1680). This is because “universality of access may be largely irrelevant to the intensity of class conflict, as the focus of conflict may simply change once access is universal” (Lucas, 2001, p. 1680). Nevertheless, the universality access does not solve the entire issue of inequality in education distribution. Besides the institutional distribution and enrolment (S. R. Lucas, 2001; Maas & Criel, 1982), others examined differences in education based on educational attainment (Thomas et al., 2001), school quality (R. Rao & Jani, 2008), educational finance (Ter Weele, 1976), and dropout (Gamoran, 2015). Regarding inequality using dropout, Gamoran (2015) argued that inequality exists when certain individual or the “disadvantaged families leave school earlier, receive fewer degrees and certificates, and exhibit lower academic skills than their more privileged peers” (p. 1).
The bottom line of those studies was to understand that education distribution would be effective if equality exists in the quality of learning, investment in schooling and to ensure that no one is left behind in the distribution. In that case, education inequality could be measured as a flow using enrolment as an access, as a stock using educational attainment (either discrete or continuous measurement, see Jorda & Alonso, 2016), differences in school quality of learning (achievement), school finance, and dropout. Correspondingly, education inequality could be perceived as social condition where people contain differences in the sharing of enrolment, quality of learning, educational finance, education attained, student motive of continuing schooling to seventh level and institutional distributions (Antoine, n.d.). In sum, it is a social inequality in education distribution across households, regions, and countries. Based on this definition, Figure 2 presents the framework to visualize the covariate variables of educational inequality.
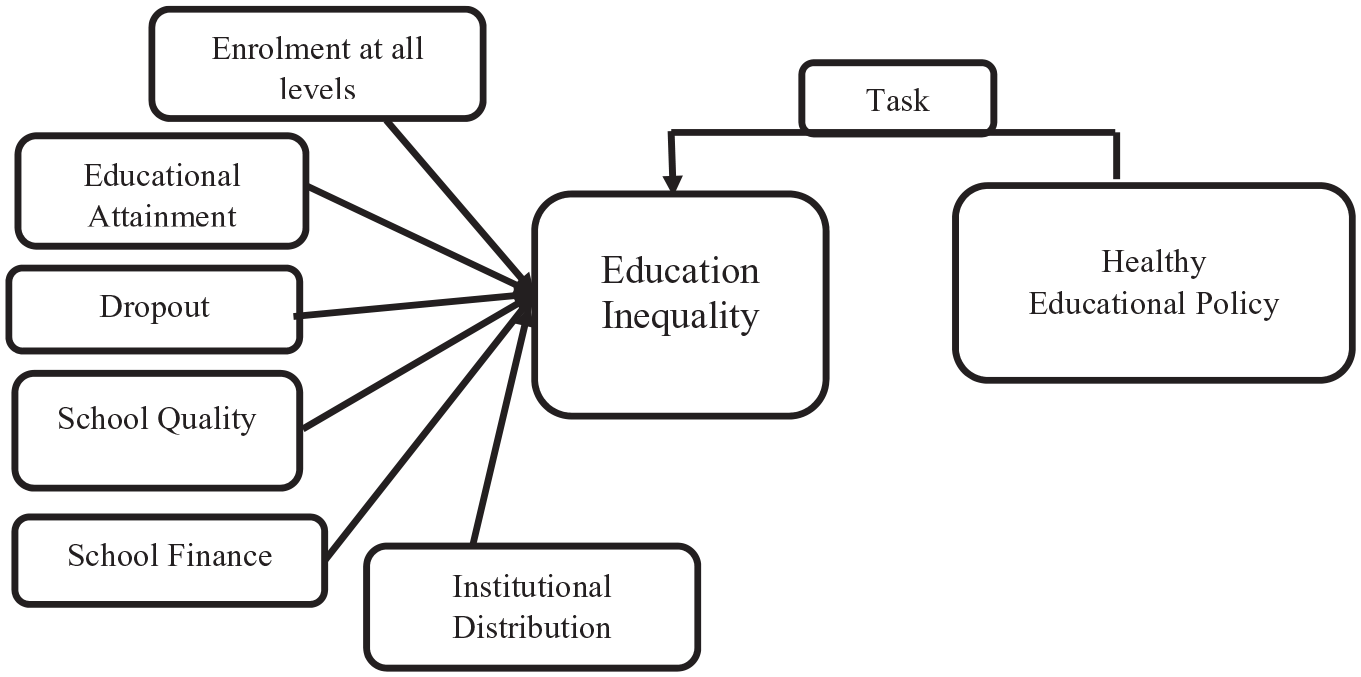
Education inequality measuring instrument and task ahead.
As education inequality cut across countries (Boboc et al., 2012), the framework essentially points attention to a healthy educational policy required to reduce the quantity of inequality of education across inequality covariates. In view of Mesa (2007) position, the task ahead, serving as policymaker’s responsibility, is the proposition that education policy matters where inequality exits among the inequality covariates. In a nutshell, the framework explained how inequalities exist in education distribution, which would attract educational policies to reduce the covariates’ inequalities.
Identifying Measurement Variables for VEI
Following the preceeding arguments of vulnerability and education inequality, the study proceeded to identify the variables to explain VEI in this section.
Noting that the household children are the most vulnerable group to unequal education and poverty (Dullabh & Sykes, 2012), to measure VEI, discourse on natural and social vulnerabilities, as discussed in the previous subsections, were duly explored, particularly indicators that are measurable for prevention, intervention, and recovery were identified (Begun, 1993). In other words, indicators that directly affect student (individual student and family), socioeconomic, physical environment, and government were explored. Government was included because (a) education is a public good (Anomaly, 2018) and (b) government is responsible for the distribution through education policy and setting up agency to prevent event(s) that could trigger education inequality (Mesa, 2007).
Although Tietjen and Zdrojewski (2010) framework were built on three pillars, the study was sector focused. The study tried “to identify those countries in the region whose education systems were more fragile, at risk and in need of assistance” (Tietjen & Zdrojewski, 2010, p. 1). Thus, the main task is to identify the core vulnerability indicators that focus on the child. To that end, the study did not consider it suitable to include the structural-macro risks but used micro lens to understand those factors that could subject a school-age child to susceptibility. As a result, the micro perspectives are grouped into three cubicles, namely, within education (WE), socioeconomic status (SES), and school physical and environmental (SPE) risks.
Cubicle 1: Within-Education Risks
In this cubicle, the study followed Archambault et al. (2009), Rumberger and Larson (1998), Rumberger (1995), and Rumberger (2001) models of school engagement. Thus, school engagement model became a necessity to identify within-education risks and academic performance.
First, previous works alternated engagement with participation (Appleton et al., 2008), involvement (Finn, 1989), and commitment (Janosz et al., 1997). Student engagement has two classifications: academic and social (Rumberger & Larson, 1998). Attitudes of students toward school and academic ability are used to measure the academic engagement, while the social engagement is measured by “class attendance, rule compliance, and active participation in school-related activities and venues” (Archambault et al., 2009, p. 653). However, more authors came to provide a multidimensional approach to student engagement (Appleton et al., 2006; Fredricks et al., 2004; Jimerson et al., 2003), which was supported in the work of Archambault et al. (2009). The multidimensional school engagements include affective, cognitive, and behavioral (Fredricks et al., 2004). Hence, attempt was made to use this aspect to construct conceptual framework for VEI. This is because (a) the multidimensional indicators support the human development of education measurement (b) it points to prevention and intervention (Archambault et al., 2009) (c) the eccentric factors address various risks in schooling and (d) they address social vulnerability (Birkmann, 2006; Cutter et al., 2000, 2003). So, the WE cubicle is conceptualized in the next sub-subsections.
The affective risk dimension
This dimension directly affects the emotional person of the student. Although authors like Goodenow (1993) alternated perception with belongingness, Archambault et al. (2009) argued that “feelings, interests, perceptions, and attitudes toward school” (Archambault et al., 2009, p. 654) of the enrolled students could be explored subject to the focus of the research. Then, it is appropriate to choose belongingness (because unbelongingness constitutes risk) (Goodenow, 1993), feelings, interests, and attitudes as vulnerability indicators that affect the child being and thoughts (Archambault et al., 2009; Fredricks et al., 2004). For example, a child feeling to attend classes would have been raised to show that he belongs to the class. Absence of belongingness in a class of students will probably raise the feeling of absenteeism. Thus, it is assumed that the affective risk indicator significantly stimulate school-age child to be vulnerable to education inequality during schooling grade transition. The testable statement is:
The cognitive risk dimension
The cognitive dimension has two subdimensions which could explain the kind of risk that could impact on susceptibility. According to Archambault et al. (2009), these include “student psychological investment in learning and the use of self-regulation strategies by students” (p. 654). The psychological investment is measured by four other indicators which include willingness to learning activities, competency, willingness to engage in productive learning and task-focused goals as designed in DeBacker and Nelson (2000) and used in Archambault et al. (2009) models. The self-regulatory indicator focused on learning instruments which are measured by three indicators—self-monitoring, task planning, and memorisation as developed in Ablard and Lipschultz (1998), which was applied in Archambault et al. (2009). For example, self-defeat could arise if a school-age child finds himself or herself in a condition of lacking competency. Here, it is assumed that the cognitive risk dimension could induce a loss for school-age children to be vulnerable and get themselves out-of-school system during years of schooling. So, the testable null hypothesis is stated as follows:
The behavioral risk dimension
This third dimension defines conduct suitable for “psychosocial adjustment and achievement at school” (Archambault et al., 2009, p. 653). According to Archambault et al. (2009), there are three constructs to this dimension—positive behaviors, involvement in school-related tasks, and participation in extracurricular activities (Fredricks et al., 2004). The positive behavior is a range of either negative or positive. Archambault et al. (2009) explained the construct as “school attendance vs skipping class and compliance with rules vs oppositional behaviour and represent good examples along the engagement/disengagement continuum” (p. 654). The school-related tasks are measured by two indicators—students to efficiently do their homework and classroom participation (classroom lesson and discussions) (Archambault et al., 2009; Tymms & Fitz-Gibbon, 1992). The third indicator is about physical education and fitness. The position of Archambault et al. (2009) is for students to be frequently participating in physical exercises which could attract them to continue schooling. The support of the argument reflected in Mahoney and Cairns (1997) that physical activities correlate with academic achievement. Likewise, Rasberry et al. (2011) explicitly argued that physical activity is associated with cognitive, academic behaviour, and attitudes. It was stated that “physical education and academic performance were positive” in a relationship (Rasberry et al., 2011, p. 518). In McIntosh et al. (2008), office discipline referrals (ODRs) were introduced into the behavioral model such that disruptivebehaviour, physical assault, extreme noncompliance, and harassment are the measurement risk indicators. However, not only that the child would be out-of-school, but the school discipline with suspension yardstick has often resulted in out-of-school due to criminal behavior (Cuellar & Markowitz, 2015; Hemphill et al., 2014). Thus, it was assumed that behavioral risk dimension could make a school-age child vulnerable to education inequality. Thus, it is conjectured as follows:
The academic performance risk dimension
Although Archambault et al. (2009) did not include academic performance directly in their framework, Rumberger (2001) asserted that “poor academic achievement is a strong predictor of dropping out” (p. 8) as earlier predicted in Ekstrom (1986), Goldschmidt and Wang (1999), Rumberger (1995), and Wahlage and Rutter (1986). Hence, academic performance is a substantive susceptible indicator to pull and push vulnerable children to education inequality. This dimension could be measured by (a) low progression, (b) strangler, and (c) normal progression (Datt et al., 2018; Datt & Wang, 2012). Thus, it was assumed that academic performance could impact on school age child to be vulnerable to education inequality. In this instance, the null hypothesis is stated as follows:
In sum, within-education cubicle (WE), there are four independent variables (IVs)—affective, cognitive, behavioral, and academic performance risk dimensions to increase susceptibility of children. Each of the IV produces first-order concepts which expand the model with nine latent concepts (to construct the manifest variables, see Archambault et al., 2009, for research instrument development). Equally, there is an interaction between physical education in behavioral dimension and cognitive dimension (Rasberry et al., 2011). The four dimensions hypothesized could be summarized into one main hypothesis as follows.
Cubicle 2: Socioeconomic Status (SES) Risks
There are green lines of studies available on socioeconomic status (SES) which are relevant to conceptualize the model for VEI (Braveman et al., 2001, 2005; Cirino et al., 2002; Hollingshead, 1975; Sirin, 2005; Yang & Gustafsson, 2004). Here, SES is adopted as an indicator because SES is a universal indicator virtually used in all disciplines such as behavioral sciences, social sciences, health, and natural sciences which captures individual household behavior (Birkmann, 2006; Cirino et al., 2002; Cutter et al., 2000). Education as subsocial sciences discipline is not an exception. In this article, it was assumed that SES is a risk factor that significantly impacts on the school-age child being vulnerable to education inequality during educational progression. Being that said, how should SES be measured in studying VEI studies? The current study considers relevant SES risk indicators among several indicators arising from different fields.
Historically, the origin of SES as an indicator in social measurement began with Hollingshead in the early 1940s. He tested for three variables—education, occupation, and location of the households (Hollingshead, 1957). He came up with two-factor index (TFI) that has only education and occupation for SES measurement because the location indicator was not significant. However, the TFI received opposition that the occupation is too conservative (Braveman et al., 2005; Haug, 1972). For example, Braveman et al. (2005) argued that although “prestige, skills, social influence, and/or power have been the primary basis for SES . . . but considering variation in the psychosocial characteristics of one’s occupation, including control over one’s work” (p. 2883), is a sufficient condition. This led to developing a four-factor index (FFI) that included education, sex, occupation, and marital status (Hollingshead, 1975). Consequently, the FFI manifest variables were often used for SES in subsequent studies such as in the field of health, education, and so on (Cirino et al., 2002; Yang & Gustafsson, 2004). For example, Selden (1990) and White (1982) used the FFI to estimate academic achievement while Spalding (1995) used it to measure HIV high-risk population.
However, there are different positions of papers on the FFI adoption in social sciences and health. Yang and Gustafsson (2004) examined and found the relationship between SES and reading achievement in 23 countries significant. The SES indicators used were cultural, ownership of household items, and student’s own possessions instead of FFI indicators. Although SES could consider family income as an indicator (Sirin, 2005). Braveman et al. (2005) argued that income should not be misconstrued with wealth but proposed wealth as a separate indicator. As such, they proposed that past SES experience and neighborhood SES conditions should be added to SES indicators. For example, they further argued that “socioeconomic characteristics of neighbourhoods could affect health through features of the physical (‘built’), social, or service environments via multiple pathways” (Braveman et al., 2005, p. 2884). Parental income, parental education, and parental occupation were additional positions (Duncan et al., 1972; Sirin, 2005) to measure SES. Interestingly, Bradley and Corwyn (2002) noted that “SES is associated with a wide array of health, cognitive . . . ” (p. 1). As such, SES is more of multidimensional indicators to explain social and economic school risk issues.
In sum, as the indicators “of SES are unique and that each one measures a substantially different aspect of SES” (Sirin, 2005, pp. 418–419), direct indicators of SES risk useful for the framework were built in. Relevant SES indicators were chosen to capture the loss associated with interest in schooling. The chosen indicators include family education, gender (proxy for sex), family occupation (Duncan et al., 1972; Hollingshead, 1975; Sirin, 2005), culture, student’s own possessions (e.g., books, writing material, good wears) (Yang & ustafsson, 2004), health (Bradley & Corwyn, 2002), family income (Duncan et al., 1972; Sirin, 2005), family wealth, and neighborhood SES (Bradley & Corwyn, 2002; Braveman et al., 2005). The past SES in Yang and Gustafsson (2004) and marital status of Hollingshead (1975) were not considered because this article focuses on the school-age child instead of adult. Instead, teenage pregnancy would be helpful as an SES risk indicator when gender issue is examined (Manlove, 1998). For example, culture of a community on education, such as BOKO Haram (literally translated Western education is wicked), is a strong influence on child feeling on knowledge acquisition. Hence, the following was hypothesized:
Cubicle 3: School Physical and Environment Risks
A vast of literature discussed environmental risk factors in diverse ways. While some focused on health-related risks (Story et al., 2009), others concentrated on school physical and environmental (SPE) risks (Anilan, 2014; Goldman, 1995; Sheffield et al., 2017). Likewise, multiple environmental indicators were made available by World Health Organization (WHO, 2004) in its information series on school health, documents 2. Experts in this area have shown that the location where elementary schools were built, usually, has a consequence on the health of the children attending such schools. Specifically, Goldman (1995) argued that “school is built directly over a hazardous waste disposal site and from other cases of exposures to chemicals whose effects are not obvious for decades, such as vaginal cancer following exposure in utero to diethylstilbestrol (DES)” (p. 27). Other consequences of poor school environments were identified by WHO which include respiratory infections, diarrheal diseases, vector-borne diseases, injuries and poisonings, cancer, asthma, and developmental disabilities. The implications of Goldman (1995) and WHO (2004) pointed to schools that were built in a hazardous area or environmental unfriendly constitute school environmental risks that attracts deadly diseases. The risk of encountering deadly diseases around the school premise could subject the school-age child to poor health and make them exhibit lateness, poor attendance, and poor performance, thereby become vulnerable to education inequality during grade-level transitions.
Given the potential role of SPE risk, the task ahead is to separate and choose those school environmental risk indicators that could lead to schooling vulnerability. Given the potential role of SPE risk, the task ahead is to separate and choose those school environmental risk indicators that could lead to schooling vulnerability as explained in the classification of WHO (2004) indicators. The indicators include (a) water (such as surface water runoff and stormwater discharge) and sanitation, (b) indoor air pollutants, (c) outdoor air pollutants (Goldman, 1995), (d) ultraviolet radiation, (e) pesticides, (f) food, and (g) hazardous location. Also, sick building in which the sickness varies from inferior blocks, mold, vapor intrusion and bacterial air release, and carbon monoxide are SPE indicators. To prevent children susceptibility regarding sick buildings is to engage in remediation. The cost of remediation comes in twofold—monetary loss and knowledge loss during school closure for the remediation. In Story et al. (2009), food consumption is another area to which an environmental impact could cause susceptibility. They argued that below standard food in the school environment has higher significant effect on the health of the children. Others include malnourishment and challenges of obesity. The article added food quality as an indicator to explain the SPE risk factors. Finally, although the outcome showed that school environmental factors exist, smoking, alcohol, and drugs were not considered because they constitute behavioral risk factors; thus, there is need to avoid multicollinearity problem (Anilan, 2014).
At this juncture, considering the arguments and the technical materials in practice, it was assumed that the physical environment risk factors could affect educational progression of a school-age child. The SPE risk indicators are (a) water, sanitation, and food quality; (b) internal air pollution; (c) external air pollution; (d) sick buildings and landscaping; (e) hazardous laboratory instruments; and (f) ultraviolet radiation. Hence, the null hypothesis required to be tested is stated as follows:
Furthermore, a central focus of identifying the vulnerable indicators that relates to VEI is to prevent the susceptible population and intervene into helping those that are educational inequality trapped to quickly recover (Daniel, 2011; Manyena, 2006). This addresses the policy aspect that would assist the tragedy population to get the best outcome of resilience. The resilient is the effort of nonvulnerable population to bring back the vulnerable population to a state of continuing to survive in schooling transitions despite adverse schooling events (McCubbin, 2001; Windle, 2011). In other words, “resilience is responsible for reducing society’s vulnerability” (Daniel, 2011, p. 3), or the ability to recover from the state of susceptibility (IPCC, 2007; McLean et al., 2001). Relating to schooling, “resilience is the ability to thrive academically despite adverse circumstances” (Windle, 2011, p. 155). From the theory of resilience, the education intervention package for the nonvulnerable population (education sector and educational institutions) is expected to moderate the cubicles of the identified vulnerable indicators and the extent to which the interventions moderate and mediate the overall VEI and the extent of falling into the EIP (McCubbin, 2001). To have a specific approach, education sector/government intervention was introduced as direct intervention (INTV) to assist in the resilience while institutional intervention based is proposed as vulnerability prevention (VPRE), for disallowing the event to occur. The INTV is a structural approach to the resilience while the VPRE is the individual school’s approach of increasing resilience.
Hence, the following null hypotheses are proposed for testing against real education and economic data.
With above explorations and discussions, VEI is multidimensionally focused. As a result, the conceptual framework of the multidimensional of VEI which could predict the probability of school-age children falling into EIP during educational grade-level transitions is presented in Figure 3.

Proposed conceptual framework for multidimensional vulnerability to education inequality (VEI).
Conclusion
In this conceptual article, the study was not focused on education sector vulnerability as a macro study neither did it attempt to empirically investigate the claims. Instead, the study qualitatively, through literature exploration, identified those susceptible factors that could trigger education inequality during grade transition. Thus, this aspect constitutes microeconomics in education distribution studies. To that end, varieties of literature were explored to understand vulnerability and define VEI. The study expanded the understanding to the designing of vulnerability instruments for measuring educational inequality as presented in Figure 3. The proposed conceptual framework for VEI captured three covariate cubicles. Each cubicle explained the susceptible indicators that child faces during years of schooling. In other words, the conceptual model presented an understanding of the challenges that school-age children faced, beginning from the point of enrolment. Thus, the study has two novelty properties serving as authors’ contributions to the economic and education distribution literature.
First, the VEI helps to understand that education inequality does not occur by chance. There are major and eccentric risk factors that school-age children face at school, which make pupils/students susceptible to abandoning schooling and have low educational attainment (Barro & Lee, 2010). Another truth about VEI is that the framework summarized the risk factors in a cubicle form to predict the child future vulnerability to inequality of education. The cubicles include WE, SES, and SPE risk dimensions. Furthermore, if the empirical study is carried out, the VEI framework would not unlikely be useful to the policymakers to understand the specific areas of attention to minimize the child susceptibility to inequality of education. In a nutshell, the novelty of the study is the prevention and intervention that were built into the VEI framework.
Second, through the economic and educational literature exploration, the study proposed STR framework that explained child susceptibility, tragedy, and resilience. This would be helpful to the mathematicians and applied statisticians in educational development to construct and extend the framework, to understand the rate of vulnerability across households because the STR framework has susceptible infection recovery (SIR) properties (Apenteng & Ismail, 2014; Weiss, 2013). Thus, introducing STR framework, thereby adopting SIR technique would go beyond analyzing education vulnerability with standard deviation and principal component methods (see Galleto & Bureros, 2017; Tietjen & Zdrojewski, 2010).
Finally, although authors did not test the proposed frameworks (STR and VEI frameworks) to real education and economic data, it is likely that the frameworks would engender further research that could lead to better policy formulation. Likewise, despite that the proposed frameworks would raise questions among the scholars in educational distribution, it was assumed that this study would generate new research method to explain VEI, such as SIR technique of estimation (Apenteng & Ismail, 2014; Roberts et al., 2015; Weiss, 2013). Although the article did not cover the structural indicators that could trigger inequality of education, the study suggested that future research should verify the study claims of the multidimensional features of VEI (Appleton et al., 2006; Fredricks et al., 2004; Vogel & O’Brien, 2004). As well, it will be necessary to construct a framework for structural indicators affecting VEI, for example, sociopolitical instability and economic upturn risks, which have the likelihood properties of influencing the high rate of inequality in education distribution during grade transition. Likewise, efforts should be concentrated on the resilience, prevention, and intervention frameworks to assist the policymakers. Finally, each country education inequality covariate variables should be annually updated to increase empirical works in education distribution studies, as well as provide increasing responsibility for education policymakers to control children vulnerability to schooling.
Footnotes
Acknowledgements
The authors acknowledge the comments provided by Associate Prof. Dr.VGR Chandran A/L Govindaraju, HOD, Development Studies, University of Malaya. We equally appericiate the comments of the anonymous reviewers who helped to improve the article.
Declaration of Conflicting Interests
The author(s) declared no potential conflicts of interest with respect to the research, authorship, and/or publication of this article.
Funding
The author(s) received no financial support for the research, authorship, and/or publication of this article.