
Abstract
Evaluating depressive symptomatology in older adults is important for monitoring and treatment. However, few studies have examined the association of the Beck Depression Inventory-II (BDI-II) to demographic characteristics in middle-aged and older adults or have tested its factor structure using confirmatory factor analysis (CFA). Participants were 542 middle-aged and older Greek community-dwellers of a wide education range. The BDI-II score was correlated with age and education and one-way analysis of variance compared mean score in men and women, controlling for differences in education. In addition to the unidimensional model, eight models were tested using CFA: four two-factor models, a three-factor model, two bifactor models, and a hierarchical model with three first order factors and a second order factor. Age was marginally associated with BDI-II score; education was inversely associated with it in this sample of a wide range of education. Women scored higher than men, although controlling for education attenuated the differences. Internal consistency was similar to that of other studies. Of the nine models tested using CFA eight showed good fit but the bifactor models yielded anomalous factor loadings. The hierarchical model of Byrne, Stewart, Kennard, and Lee showed the best fit in terms of all the indices. The results indicate the presence of a second-order general depression factor that influences highly correlated first-order factors and extend the applicability of the hierarchical model to older community dwellers.
Introduction
The Beck Depression Inventory-II (BDI-II; Beck et al., 1996) is one of the most commonly used instruments for screening for depression and measuring depression severity. It has high internal consistency (Dozois et al., 1998; Erford et al., 2016; Schulte-van Maaren et al., 2013; Subica et al., 2014), test-retest reliability (Erford et al., 2016), construct validity (Steer et al., 1997), and convergent validity (Giannakou et al., 2013; Krefetz et al., 2002), and can distinguish between outpatients with Major Depressive Disorder or dysthymia and non-patients with sensitivity and specificity of 96% and an area under the ROC curve of 0.99 (Schulte-van Maaren et al., 2013).
Nonclinical studies of the factor structure of the BDI-II were initially conducted primarily with samples of college students from various countries (e.g., Al-Turkait & Ohaeri, 2010; Beck et al., 1996; Canel-Çınarbaş et al., 2011; Carmody, 2005; Dozois et al., 1998; Osman et al., 1997; Steer & Clark, 1997; Whisman et al., 2000, 2013). Principal component factor analysis (PCA) in the original validation study of Beck et al. (1996) revealed a Cognitive-Affective and a Somatic factor in a small student sample (henceforth CA-S) but a Somatic-Affective and a Cognitive factor in a larger psychiatric sample (henceforth SA-C); the CA-S structure was corroborated using the same methodology in another small student sample by Steer and Clark (1997). Some subsequent studies employing confirmatory factor analysis (CFA) with student samples have corroborated the CA-S two-factor structure, although not always with the same items (Campos & Gonçalves, 2011; Canel-Çınarbaş et al., 2011; Dozois et al., 1998; Whisman et al., 2000); however, other studies have revealed different factorial structures (Al-Turkait & Ohaeri, 2010; Byrne et al., 2007; Carmody, 2005; Osman et al., 1997; Whisman et al., 2013). The variety of factorial structures in the studies reviewed likely reflects differences in sample characteristics and the extent to which the researchers had tested alternative models.
Studies that have examined the factor structure of BDI-II in mixed (nonclinical and clinical) samples using CFA have also shown support for a variety of factorial structures (García-Batista et al., 2018; Park et al., 2020; Vanheule et al., 2008Ward, 2006). A meta-analysis and review of a large number of studies with diverse clinical and nonclinical samples showed support for both one- and two-factor solutions, although few studies tested the default unidimensional model and one-third of the studies were underpowered (Erford et al., 2016). Another meta-analysis of a large number of studies using exploratory factor analysis revealed a Cognitive and a Somatic-Affective factor similar to the SA-C factors of Beck et al. (1996) in support of two-factor models (Huang & Chen, 2015).
Increasingly, studies have examined the psychometric properties and factor structure of the BDI-II in community samples from different countries in order to extend findings to the general population (Campos & Gonçalves, 2011; Ciharova et al., 2020; Faro & Pereira, 2020; Kapci et al., 2008; Kojima et al., 2002; Lim et al., 2019; Ociskova et al., 2017; Park et al., 2020; Rodríguez-Gómez et al., 2006; Sanz et al., 2003; Segal et al., 2008). These studies have included mixed samples of college students and other community-dwelling adults (Campos & Gonçalves, 2011; Sanz et al., 2003; Segal et al., 2008), persons of a wide age range from the community (Ciharova et al., 2020; Kojima et al., 2002; Lim et al., 2019), and samples of relatively young persons from the community (Faro & Pereira, 2020; Kapci et al., 2008; Ociskova et al., 2017; Park et al., 2020). To the best of our knowledge, only one study has examined the factor structure of the BDI-II in an older community-dwelling sample (Rodríguez-Gómez et al., 2006), and another study has examined its factor structure separately for a small older group and a younger group in order to assess the test’s appropriateness for use with older adults (Segal et al., 2008). Use of samples of a wide age range in the aforementioned studies may have obscured possible age differences in the responses, as indicated in the results of Segal and colleagues who showed using CFA that the same model did not fit both sets of data.
Although community-dwelling older adults have relatively low rates of major depressive disorder (Chou & Cheung, 2013; Fiest et al., 2011), they have high levels of clinically significant but subsyndromal depression (Carrière et al., 2017; Jeste et al., 1999; Lyness et al., 2007) so screening for depressive symptoms in older adults is important. The association between age and depression is complex, with age being linked to increases in both depression (Schaakxs et al., 2018; Stordal et al., 2003) and cognitive decline (Alley et al., 2007; Salthouse, 2009). Furthermore, late-onset depression may be an early manifestation or risk factor of future cognitive decline and dementia (Ganguli et al., 2006; Li et al., 2011; Olaya et al., 2019), and depressive symptoms can predict subsequent cognitive decline (Zheng et al., 2018). Depressive symptoms in later life are associated with impaired quality of life, decreased social functioning, and cognitive impairment (Velten et al., 2014), so their early detection and treatment may offer an effective approach for preventing cognitive decline or delaying its progression to dementia (Zheng et al., 2018). Depression in older persons is, however, often unrecognized, and untreated (Karlsson et al., 2016; Stek et al., 2006), and both subthreshold depression and major depression are associated with similar additional mortality (Cuijpers et al., 2013). It is, therefore, important to evaluate the presence of depressive symptoms in older adults for both monitoring and intervention purposes. The BDI-II is a suitable instrument for older adults (Segal et al., 2008) but its factor structure for this population is undetermined and may vary according to sample characteristics and the methodology employed.
The relationship of depression with age has shown great variability in a review of epidemiological studies, with the most common pattern being an initial rise across age groups followed by a drop. However, when risk factors that are differentially distributed across the life span in cross-sectional studies (e.g., level of education and income) were statistically controlled, greater age was associated with less anxiety and depression (Jorm, 2000). On the other hand, depression was shown to increase linearly with age in a large study of the general population of adults; although the relationship was moderated by statistically controlling for multiple variables and education, some of the increase in depression with age remained, indicating a genuine effect (Stordal et al., 2003). Prevalence of depression was higher in those over 80 years compared to the younger old (Karlsson et al., 2016), and a prospective population-based study of 85-year-old community-dwelling persons showed that the oldest old are at high risk of developing depression, and that when depression was present, it was highly persistent (Stek et al., 2006).
Studies of the relationship of age, sex, and education specifically with the BDI-II in nonclinical community samples have also yielded equivocal results. Older age was associated with higher BDI-II scores in some studies (Sanz et al., 2003; Schulte-van Maaren et al., 2013) but not in others (Kojima et al., 2002; Segal et al., 2008). Moreover, some community studies have used samples of adults up to 65 years of age (Roelofs et al., 2013; Schulte-van Maaren et al., 2013) so the relationship of age and BDI-II scores could not be fully examined. Higher education levels were associated with lower BDI-II scores (Roelofs et al., 2013; Sanz et al., 2003; but see Ociskova et al., 2017). Women had higher BDI-II scores than men in many studies (Beck et al., 1996; Kojima et al., 2002; Osman et al., 1997; Roelofs et al., 2013; Sanz et al., 2003; Schulte-van Maaren et al., 2013) but not in all (Ociskova et al., 2017; Segal et al., 2008). Because higher education is less frequent in older age and particularly among older women (Stordal et al., 2003), the association between sex and BDI-II scores could have been confounded by this factor. Adjusting for social and health factors accounted for differences in BDI-II scores between a small sample of Greek-born older immigrants in Australia and their Anglo-Australian counterparts, indicating the contribution of such factors to the symptomatology rather than of cultural factors (Kiropoulos et al., 2004).
In conclusion, there is lack of agreement concerning both the factor structure of the BDI-II across different community samples and its relationship to demographic variables. Sample characteristics and the specific models tested in the studies may have contributed to inconsistencies regarding different factor solutions. Given the dearth of studies that have examined the factor structure of the BDI-II in an older sample, the critical role of evaluating depressive symptomatology in older adults for monitoring of cognitive status and treatment purposes and the suitability of the BDI-II for such purposes it is important to examine the above in the relatively neglected target population of middle-aged and older persons. The aims of the current study were, therefore, (a) to investigate the relationship of BDI-II scores to age, education, and sex in a Greek sample of middle-aged and older persons from the community, b) to compare the internal consistency of the BDI-II in this sample to other samples in the literature, and (c) to examine the factor structure of the BDI-II in this sample using CFA. Two-factor models, three-factor models, higher-order, and bifactor models were compared to each other and to the default unidimensional model.
Methods
Participants
The sample comprised 542 participants (301 women) 43 to 92 years of age, M(SD) age: 64.89 (9.38) years. The education level ranged from no formal education to 23 years, M(SD) education: 10.56 (4.35) years, with 34 (6.3%) having completed <6th grade; 145 (26.9%) having completed 6th grade; 56 (10.4%) having completed <12th grade; 140 (26%) having completed 12th grade; 61 (11.3%) having completed post-high-school training; 90 (16.7%) having completed university; and 13 (2.4%) having completed graduate studies. The study was conducted according to the guidelines of the Declaration of Helsinki and was approved by the Department of Psychology of the National and Kapodistrian University of Athens. All participants volunteered to participate without compensation and gave informed consent. It was emphasized that their privacy and confidentiality would be protected, that participation was voluntary and that they had the right to withdraw at any time.
Participants were recruited from the community between 2005 and 2006 by the investigators and their research assistants using snowball sampling. The initial pool of participants comprised relatives and acquaintances of the investigators and their research assistants, but the participants were seen by investigators other than the ones that recruited them. Of the participants, 296 also completed tests of short-term/working memory and 167 tests of memory (not reported in this study).
Men were slightly older than women, F(1,541) = 3.96, p = .047, η2 = 0.047, M(SD) men = 65.78 (9.10) years, M(SD) women = 64.18 (9.55) years. They were significantly more educated, F(1,538) = 30.28, p < .001, η2 = 0.05, M(SD) men = 11.69 (4.40) years, M(SD) women = 9.66 (4.11) years. Information on education was unavailable for three participants. Discrepancies in educational attainment between older men and women characterize Greek society and are reflected in the 1961 Census (Hellenic Statistical Authority, 2022).
Measurement of employment status or highest professional attainment pre-retirement using a modification of the Hollingshead Scale (Hollingshead, 2011) by the first author showed that N = 91 (17.0%) were “major professional;”N = 103 (19.2%) were “minor professional;”N = 96 (17.9%) were “technician;”N = 44 (8.2%) were “skilled manual employee;”N = 83 (15.5%) were “unskilled manual employee;” and N = 119 (22.2%) were “housewives.” The modification involved subsuming the categories of “lesser professional” and “minor professional” into one because of difficulties distinguishing between the two. Employment information was unavailable for six participants.
Inclusion and Exclusion Criteria
Participants were middle-aged and older persons living independently in the community who were native Greeks with no history of neurological, psychiatric or memory disorders, who were not under any medication known to significantly affect cognitive function.
Measures and Procedure
The BDI-II is a 21-item self-report instrument which assesses depression severity in line with the criteria for Major Depressive Disorder of the Diagnostic and Statistical Manual of Mental Disorders (4th ed.) of the American Psychiatric Association (1994). It is scored by summing the highest ratings for each of the 21 items. Each item is rated on a 4-point scale, ranging from 0 to 3, and total scores can range from 0 to 63. According to the manual for the BDI-II, scores from 0 to 13 correspond to no or minimal depression, from 14 to 19 to mild depression, from 20 to 28 to moderate depression, and from 29 to 63 to severe depression. No cutoff scores were used in the present study, in line with the view that depression is a dimensional rather than categorical construct (Crawford et al., 2001).
Participants were administered an approved Greek translation of the BDI-II (Beck et al., 1996) by permission to the first and last authors (2005). A back translation of the initial translation had been conducted to ensure accuracy of the translation. Participants were tested predominantly in their own homes by the researchers and their assistants.
Data Analysis
Descriptive analyses, correlations, and analysis of internal consistency were performed using SPSS (v. 25). CFA was performed with Mplus 7 (Muthén & Muthén, 1998–2017). The specific models employed, shown in Table 1, were chosen because of their wide use in the international literature. Due to the ordered categorical (ordinal) nature of the variables, all models were estimated using the standardized weighted least squares mean and variance adjusted (WLSMV) method of estimation.
List of Models Tested.

Note. Byrne et al. (2007) model was run with the excluded item 21 in Performance Difficulty, after Whisman et al. (2013).
In addition to the unidimensional model (#9), eight models were tested in this study. Factors were allowed to covary unless otherwise specified in the models. Specifically, factors were allowed to correlate in the two-factor models (#1–4) and the three-factor model (#5). The bifactor models #6 and #7 were constructed by specifying the two latent factors as orthogonal to the General factor and to each other (Faro & Pereira, 2020; Ward, 2006). As specified by Ward (2006), model #6 included two minor factors (correlated errors), namely self-dislike (item 7) with self-criticalness (item 8), and loss of pleasure (item 4) with loss of interest (item 12); these were specified as orthogonal residual factors with an equality constraint on the factor loadings for each factor for model identification purposes. Model #7 was tested with item 20 as the reference to estimate the G factor, after Faro and Pereira (2020). Analyses of models #6 and #7 were run with the default setting of fixing the path loading for the first observable variable of a factor to 1. Each of the latent factors was set to have a mean of 0 and a variance of 1 for model identification purposes. Model #8 is a hierarchical model with three first order factors and a second order factor. In this model the loadings of items 3 (in Negative Attitude factor), 12 (in Performance Difficulty factor) and 16 (in Somatic Elements factor) were fixed to 1 (after Byrne et al., 2007; Whisman et al., 2013).
Both higher-order and bifactorial models assume a general depression factor. In the higher-order models the lower-order factors are modeled as facets of a second-order factor of general depression, which is indirectly related to the individual items of the test, whereas in the bifactor models the general factor underlies the test items but includes two or more uncorrelated group factors (Al-Turkait & Ohaeri, 2010).
The goodness-of-fit indices that were employed in order to assess the model fit were the chi-square ratio (χ2/df; adequate fit < 5, excellent fit ≤ 2), the comparative fit index (CFI) and the Tucker-Lewis index (TLI; acceptable fit ≥ .9, excellent fit ≥ .95), and the root mean square error of approximation (RMSEA; adequate fit < .08, excellent fit < .06) and its 90% confidence interval (90% CI) (Hooper et al., 2008; Hu & Bentler, 1998).
Results
Levels of Depression by Age, Education, and Sex
The frequency distribution of the BDI-II scores (Appendix, Figure A4) was positively skewed (skewness = 1.13, SE = 0.11) and leptokyrtic (kurtosis = 1.60, SE = 0.21). The mean of the BDI-II total score was 11.74 (SD = 8.23), indicating low levels of depression in the sample as a whole. Correlation between age and depression was weak (r = .09, p = .037). Depression levels as per BDI-II manual were computed for the whole sample for descriptive purposes: 364 (67.2%) participants scored in the minimally depressed range, 88 (16.2%) participants scored in the mildly depressed range, 67 (12.4%) participants scored in the moderately depressed range, and 23 (4.2%) scored in the severely depressed range. Chi-square test of independence showed a marginal association between age group and level of depression, χ2 (9, N = 542) = 16.71, p = .053 (see Table 2 for distribution).
Depression Level by Age Group, Education Level, and Sex.

Note. Depression level is computed based on the BDI-II manual. Educ = Education, HS = high school.
Correlation between education (years) and depression was significant (r = −.28, p < .001). Chi square test of independence showed a significant association between education level and level of depression, χ2 (15, N = 539) = 56.25, p < .001 (see Table 2 for distribution, with university and graduate education levels recoded into one category due to the small number of the latter).
One-way analysis of variance by sex showed a significantly higher BDI-II total score in women, M(SD) = 13.16 (8.47) than in men, M(SD) = 9.96 (7.57), F(1, 541) = 20.92, p < .001, η2 = 0.04. Controlling for differences in education attenuated the sex difference in total score but did not remove it, F(1, 538) = 10.63, p = .001, η2 = 0.02. Chi square test of independence showed a significant association between sex and level of depression, χ2 (3, N = 542) = 13.73, p = .003 (see Table 2 for distribution and Table 3 for mean scores for men and women per item).
Descriptive Statistics of the BDI-II Items by Sex.

Note. M (SD) are based on total sample.
Internal Consistency of the BDI-II
Table 4 shows means and SDs of each of the 21 items as well as item-total correlations for the entire sample. Missing responses were minimal for all the items except for item 21 (loss of interest in sex).
Descriptive Statistics and Internal Consistency of the BDI-II.

Note. r-it = item-total correlation for total sample (N = 542); r-cit = corrected item-total correlation after excluded cases with missing data (N = 425). M (SD) are based on total sample.
Internal consistency of the scale was good, based on 425 participants with complete scores (Cronbach’s alpha = .87). Intercorrelations of the 21 items are provided in the Appendix (Table A1).
Confirmatory Factor Analysis
The number of participants with complete scores was >300, indicative of a good approximation of the chi-square statistic and unbiased standard errors for CFA with ordinal data (Moshagen & Musch, 2014). Additionally, we used the a-priori sample calculator for structural equation models (Soper, 2023) to determine the adequacy of our sample size selecting a medium anticipated effect size, a desired statistical power level of .95, two, three, and four latent variables, 21 observed variables and an alpha level of .05. In all instances the recommended minimum sample was lower than our sample size. Fit indices from the application of the eight models to the data set (participants with complete responses) are shown in Table 5. All models except the unidimensional model (#9) had excellent fit in terms of chi-square ratio and RMSEA; all had acceptable fit in terms of CFI and TLI. Models #6 (the bifactor model of Ward, 2006) and #8 (the hierarchical model of Byrne et al., 2007) had the best overall fit. Model #6, however, showed negative factor loadings and nonsignificant factor loadings in factor C, and model #7 showed one negative factor loading and nonsignificant factor loadings in factor SA. No other model showed nonsignificant factor loadings. Factor loadings for all models are presented in the Appendix (Tables A2 and A3).
Fit Indices of the BDI-II Models from Confirmatory Factor Analyses.
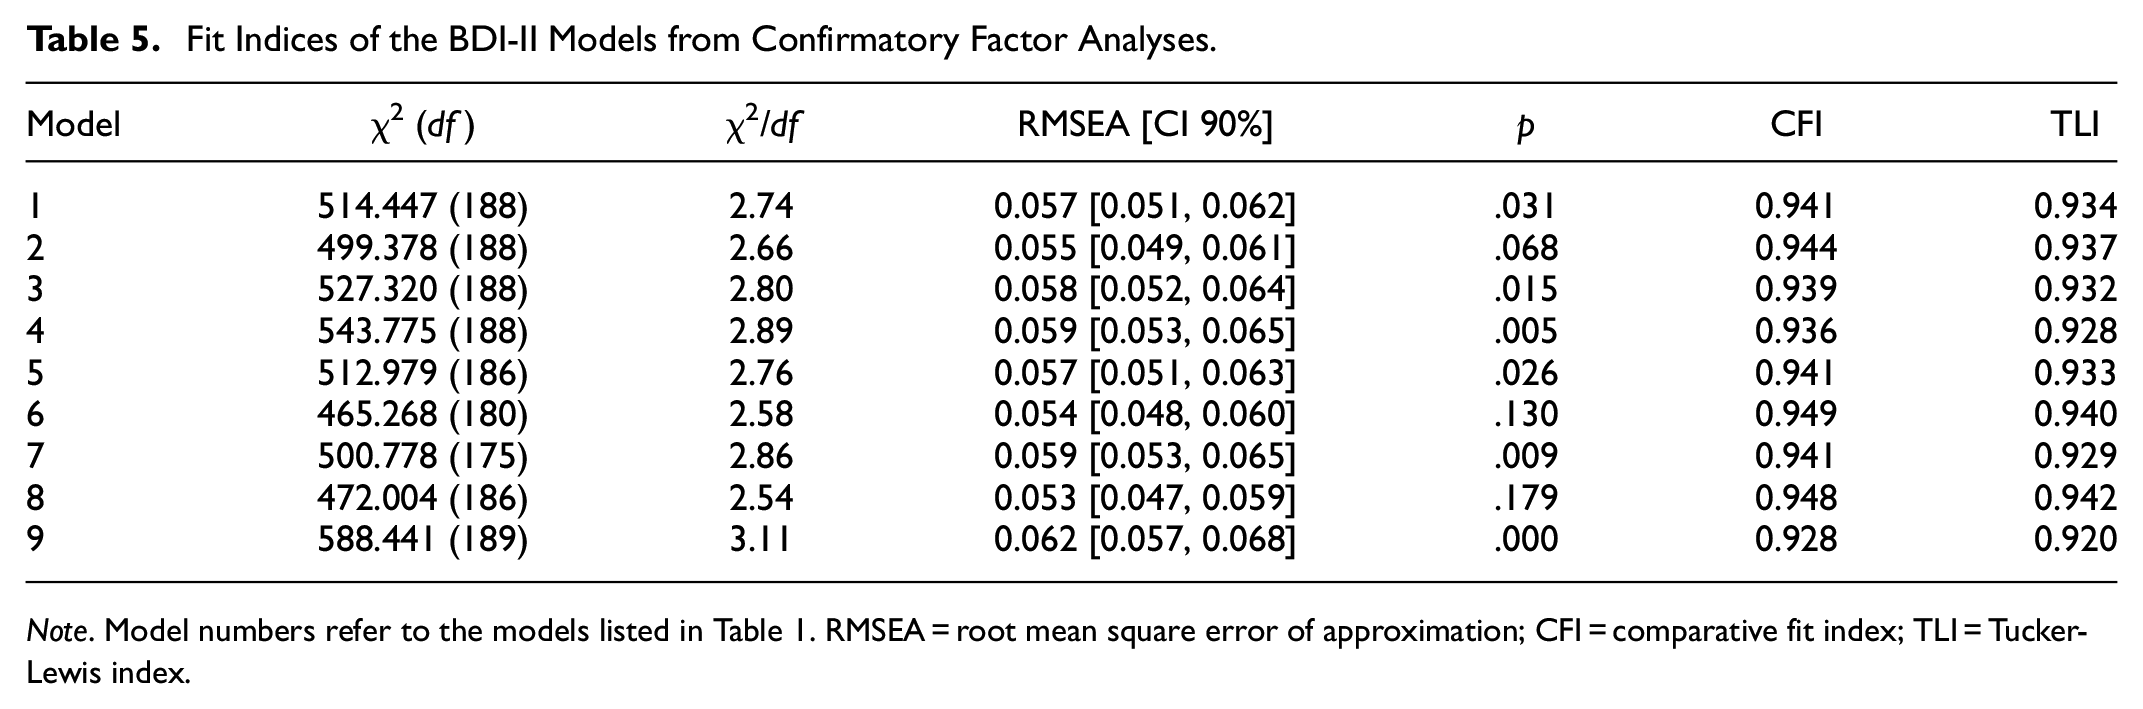
Note. Model numbers refer to the models listed in Table 1. RMSEA = root mean square error of approximation; CFI = comparative fit index; TLI = Tucker-Lewis index.
Bivariate Pearson correlations between factors in the two- and three-factor models showed an r of .86 between factors SA and C in model #1; an r of .82 between factors CA and S in model #2; an r of .86 between factors C and NC in model #3; an r of .89 between factors CA and SV in model #4; and an r of .86 between factors NA and PD, of .85 between factors NA and SE, and of .99 between factors PD and SE in model #5.
Discussion
Levels of Depression by Age, Education, and Sex
The majority of the participants scored in the mildly depressed range, consistent with other community studies of adults from different countries using the BDI-II (Faro & Pereira, 2020; Kojima et al., 2002; Lim et al., 2019; Park et al., 2020; Rodríguez-Gómez et al., 2006; Segal et al., 2008), with a skewed distribution, as would be expected from a nonclinical sample. Age showed a marginal association with BDI-II total score in this sample of community dwelling participants over 40 years of age, consistent with community studies showing minimal or no association with age (Kojima et al., 2002; Roelofs et al., 2013).
Few studies have examined the relationship between BDI-II score and education in community samples. Education was strongly and inversely associated with BDI-II scores, consistent with Roelofs et al. (2013) and Ciharova et al. (2020) to a lesser degree but not Ociskova et al. (2017); however, in the present sample, the education range was very wide, from no formal education to 23 years of education, whereas in the Ociskova et al. study few participants had primary school education only. Women reported more symptoms of depression than men, consistent with some community studies (Ciharova et al., 2020; Kojima et al., 2002; Roelofs et al., 2013) but not others (Ociskova et al., 2017; Segal et al., 2008), and controlling for their lower education attenuated their difference but did not remove it.
Loss of interest in sex was the item most likely to be omitted, especially by older women, indicating that this question may be difficult for many older persons to respond to, similar to the finding of Kojima et al. (2002). About 22% of a small sample of older women provided no response to at least one item, the majority of whom omitted the loss of interest in sex item (Jefferson et al., 2001).
Internal Consistency of the BDI-II
The BDI-II showed good internal consistency, using Cronbach’s alpha as a measure of the average degree of interrelatedness of the items of a scale (Sijtsma, 2009). It was comparable to that of other community studies (Kojima et al., 2002; Lim et al., 2019; Segal et al., 2008 for the older sample), and a sample of Greek psychiatric outpatients (Giannakou et al., 2013), although it was somewhat lower than that of some community studies (Campos & Gonçalves, 2011; Ociskova et al., 2017; Park et al., 2020), which reported Cronbach alpha >.90.
Both uncorrected and corrected Item-total correlation coefficients were greater than .46, with the exception of “suicidal thoughts,” which was .32 (corrected), attributed to the low BDI-II scores in this nonclinical sample. The high correlation coefficients indicate that each item contributed substantially to the total BDI-II score.
Confirmatory Factor Analyses
Most studies employing nonclinical samples from the community have used samples of a wide age range with a younger mean (e.g., Campos & Gonçalves, 2011; Faro and Pereira, 2020; Park et al., 2020; Sanz et al., 2003; Vanheule et al., 2008); Only two studies that we are aware of have employed nonclinical samples of community-dwelling older persons (Rodríguez-Gómez et al., 2006; Segal et al., 2008 using a small sample). In the present study all nine models showed adequate fit in terms of the chi-square ratio and the CFI and TLI indices, with models #6 (Ward, 2006) and #8 (Byrne et al., 2007) approaching excellent fit in terms of the two indices. In terms of the RMSEA, all models except model #9 (the unidimensional model) showed excellent fit. However, the two bifactor models (#6 & #7) showed negative as well as nonsignificant factor loadings. Excluding those, model #8 (the hierarchical model of Byrne et al., 2007) showed the best fit in terms of all the indices.
Anomalous results are common in bifactor models and include factors with negative loadings and with nonsignificant loadings. A literature search revealed that 48% of bifactor CFA models showed irregular loading patterns not statistically significant from 0 (Eid et al., 2017). A bifactor model with a general factor and three specific factors showed the best fit in a young adult sample of healthy persons and hospital outpatients (García-Batista et al., 2018); however, the specific factors produced two nonsignificant loadings (<.10) and six small loadings (<.20) (p levels not provided). Similarly, Ciharova et al. (2020) reported that a bifactor model with two specific factors showed the best fit of the models tested but 3 of the specific factor loadings were nonsignificant (including a negative one) and two were small. In our study, factor C of model #6 and factor SA of model #7 vanished empirically. No anomalous factor loadings were observed for the first-order factor models and the hierarchical model (#8), and their standardized factor loadings ranged between .48 and .85.
Of the two-factor models (models #1–4), Beck’s CA-S student model (model 2) showed the best fit in terms of all four indices. The three-factor model (model #5) also showed very good fit; its factors are similar to the three first-order factors of the hierarchical model (#8). The superiority of the hierarchical model and the high correlations between the factors in the two- and three-factor models strongly support the existence of a general depression factor. Bifactor models assume the existence of a G (general) factor and specific factors, that are uncorrelated with other specific factors and with G, whereas hierarchical models support the existence of first-order factors and a second-order G factor that influences all first-order factors (Eid et al., 2017). Thus, according to bifactor models, the specific factors have potential clinical meaning that is independent of the correlated symptoms of depression of the G factor. Moreover, bifactor (S-1) models will tend to show a better fit because they estimate more free parameters, but this should not by itself indicate that they are more appropriate (Heinrich et al., 2020). The results of the present study do not support the existence of such specific factors and are consistent with the existence of a second-order G factor that influences all the first-order factors, with the lower-order factors showing little independent sources of variation due to their high association with each other. This model has not been tested in community samples to the best of our knowledge, and the findings extend its applicability to a nonclinical community sample of middle-aged and older persons. Assuming a view of depression as a dimensional rather than categorical construct (Crawford et al., 2001), the present study supports an interpretation of the BDI-II as an essentially unidimensional measure of level of depressive symptomatology. As such, the instrument is useful in detecting subsyndromal depression, which may be an early manifestation of future cognitive decline and may have implications for intervention.
Summary, Limitations, and Future Directions
The present investigation of the BDI-II in a middle-aged and older sample of community dwellers showed a marginal association of scores with age, an inverse association of scores with education and higher scores for women than men even after controlling for education. The marginal association of BDI-II score with age in the age range studied suggests that a high score in an older person may not be explained by age and therefore requires further investigation. The inverse association of score with education in this sample of a wide range of education indicates a protective influence of education and implies that high levels of depressive symptoms in older persons of higher education need to be followed up. On the other hand, the higher depression scores of women even after controlling for education together with the strong association of depression with lower education highlights the potential vulnerability of women of lower education. Of the nine CFA models tested the two bifactor models showed anomalous results whereas the hierarchical model showed the best fit, although one two-factor model and the three-factor model also showed very good fit. The results support an interpretation of depression as essentially a unidimensional measure rather than a general measure with specific factors that are of clinical significance.
Strengths of the present study are the testing of a number of frequently employed models in a nonclinical middle-aged and older community sample in order to elucidate the structure of the BDI-II and extend the findings to this relatively understudied population. Another strength is the wide range of education of the participants, which allows for the investigation of the association of level of education with BDI-II score. A main limitation is that the present sample is not a random sample but one of convenience, with most participants essentially coming from a major metropolitan area, which restricts the generalizability of the findings to the population. Moreover, the time that elapsed between data collection and analysis may have implications for how typical the patterns of responses are. Another limitation is that the tendency of some persons, especially women, to omit the loss of interest in sex question, which resulted in their exclusion from CFA, may have unknown effect on the analyses. A future study should extend the external validity of the findings by including persons from different urban and rural areas of Greece.
Supplemental Material
sj-docx-1-sgo-10.1177_21582440241252264 – Supplemental material for The Beck Depression Inventory-II in Community-Dwelling Middle-Aged and Older Greeks: Factor Structure and Demographic Associations
Supplemental material, sj-docx-1-sgo-10.1177_21582440241252264 for The Beck Depression Inventory-II in Community-Dwelling Middle-Aged and Older Greeks: Factor Structure and Demographic Associations by Alexandra Economou, Eleni Konsolaki, Ishar Alexander Kalsi and Maria Psychountaki in SAGE Open
Footnotes
Ethical Approval
The study was conducted according to the guidelines of the Declaration of Helsinki and approved by the Ethics Committee of the Psychology Department of the National and Kapodistrian University of Athens.
Authors Contributions
Conceptualization, A. E. and M. P.; Methodology, A. E.; Formal analysis, A. E.; Investigation, A. E.; Resources, A. E. and M. P.; Data curation, E. K.; Writing-Original Draft Preparation, E. K. and I. A. K; Writing-Review & Editing, A. E., I. A. K., and M. P.; Visualization, A. E., E. K.; Supervision, A. E.; Project Administration, A. E. and M. P.; Funding Acquisition, E. K.
Declaration of Conflicting Interests
The author(s) declared no potential conflicts of interest with respect to the research, authorship, and/or publication of this article.
Funding
The author(s) disclosed receipt of the following financial support for the research, authorship, and/or publication of this article: E. K. was supported by financial support from the Foundation for Education and European Culture (IPEP).
Supplemental Material
Supplemental material for this article is available online.
Data Availability Statement
The data that support the findings of this study are available on request from the corresponding author (A. E.).
References
Supplementary Material
Please find the following supplemental material available below.
For Open Access articles published under a Creative Commons License, all supplemental material carries the same license as the article it is associated with.
For non-Open Access articles published, all supplemental material carries a non-exclusive license, and permission requests for re-use of supplemental material or any part of supplemental material shall be sent directly to the copyright owner as specified in the copyright notice associated with the article.