
Abstract
In recent years, in order to address climate change and energy depletion, countries around the world have been constantly promoting energy transformation and structural upgrading. The effectiveness of RCEP has broadened the international east Asian new energy market. The development of renewable energy trade in the context of RCEP has attracted significant economic, environmental, and technical attention. Based on the background of RCEP in this study, the constant market share (CMS) model and the weighted dominant comparative advantage (IRCA) index are used to assess the export competitiveness of renewable energy products from 2006 to 2021. The data in this paper were obtained from the UN comtrade database according to the categorical statistics of HS codes. The results show that: (1) the overall competitiveness of Chinese renewable energy products shows an upward trend; (2) the comparative advantages of Chinese renewable energy products are strong, with some differences among different industries; (3) the growth effect is the main reason for the fluctuation of Chinese renewable energy product exports; and (4) the signing of RCEP has injected new vitality into Chinese renewable energy trade. Finally, based on the research conclusions, the paper puts forward corresponding policy proposal.
Plain Language Summary
Based on the background of RCEP in this study, the constant market share (CMS) model and the weighted dominant comparative advantage (IRCA) index are used to assess the export competitiveness of renewable energy products from 2006 to 2021. The data in this paper were obtained from the UN comtrade database according to the categorical statistics of HS codes. The results show that: (1) the overall competitiveness of Chinese renewable energy products shows an upward trend; (2) the comparative advantages of Chinese renewable energy products are strong, with some differences among different industries; (3) the growth effect is the main reason for the fluctuation of Chinese renewable energy product exports; and (4) the signing of RCEP has injected new vitality into Chinese renewable energy trade.
Introduction
Energy is crucial material basis for the survival and development of human society. Throughout the history of human social development, every major progress is inevitably promoted by the improvement and replacement of energy sources. In recent years, the global warming and energy crisis has intensified and thus accelerating the development and utilization of renewable energy has become the consensus of all countries in the world. Therefore, the future energy transition has become a major issue for the sustainable development of human society, and the vigorous development of green and low-carbon renewable energy has become the key path for human beings to address the energy dilemma.
In the context of energy transition, Chinese government has attached great importance to renewable energy. In 2017, President Xi put forward the strategic idea of “four energy revolutions and one international cooperation,” indicating that China will accelerate the development of renewable energy as the core and key link of energy development. In 2020, the Regional Comprehensive Economic Partnership Agreement (RCEP) was officially signed, which injects new vitality and brings new development opportunities for China’s foreign trade. At the same time, RCEP countries and even the world have paid more attention to the development, utilization, production, and consumption of renewable energy in recent years, and have actively explored international energy cooperation in order to optimize the structure of energy systems. In the process of achieving the RCEP agreement, China has shown great passion for integrating into the global energy system. Therefore, strengthening energy trade cooperation with RCEP countries is of great significance to ensure China’s energy security.
In the field of renewable energy, China has the world’s leading manufacturing capacity, abundant capital capacity, and large domestic market. The international competitiveness of Chinese renewable energy products in the context of RCEP has received wide attention from the international community, which is also the subject of this paper’s research. Studying and assessing the international competitiveness of China’s renewable energy products can make more people clearly understand that the import and export of China’s renewable energy products occupy an important position in the international market. At the same time, in the context of recognizing the development stage of renewable energy in China, the driving factors affecting the competitiveness of renewable energy products can be deeply explored, attracting more scholars to pay attention and focus on this area with a view to targeting a better development of renewable energy. In order to better understand the international competitiveness in the past 16 years, this study examines the long-term trend of China’s renewable energy products from 2006 to 2021 in the context of the RCEP agreement, and proposes relevant policy proposal to improve the international comparative advantage of China’s renewable energy products.
Literature Review
At present, research in the field of renewable energy industry has become a hot topic of academic research, and the research results of scholars are mainly presented in the following four aspects.
Importance of Renewable Energy Industry Development and Economic Benefits of Consumption
Some scholars have conducted studies on the importance of the development of renewable energy industry and concluded that the development of new energy industry has significant significance in replacing fossil energy, promoting economic growth, and achieving energy conservation and environmental protection. Moriarty and Honnery (2016) demonstrated that, at a time when environmental problems become increasingly serious, replacing traditional fossil energy sources through the development of new energy sources such as nuclear energy, wind energy, hydropower, and photovoltaics become an inevitable requirement for the international community to achieve sustainable. Inglesi-lotz (2016) stated that the development of new energy industries had a positive impact on the country’s economic growth, promoting renewable energy trade and sustainable economic development. Bashir et al. (2022) concluded, based on econometric analysis, that renewable energy and energy innovations effectively mitigated environmental degradation. Tu et al. (2022) empirically showed that increasing renewable electricity output and adopting energy-efficient technologies contributed to reducing air pollution and carbon emissions. Usman and Balsalobre-Lorente (2022) used panel data of newly industrialized countries from 1990 to 2019 to explore the impact of renewable energy expansion on ecological footprint, and the research results showed that abundant renewable energy can significantly reduce environmental pollution. Ibrahim et al. (2022) based on empirical results from CS-ARDL showed that environmental technology and renewable energy mitigate the surge in carbon emissions. Jahanger et al. (2023) showed that the protection of natural resources, the utilization of renewable energy and the guarantee of institutional quality can effectively reduce the level of carbon emissions. Usman and Radulescu (2022) examined the impact of renewable energy development on the carbon footprint through a second-generation panel empirical approach, showing that the consumption of renewable energy has broadly improved environmental excellence.
The economic benefits from renewable energy consumption have also been studied. Lin and Moubarak (2014) suggested a two-way causal relationship between renewable energy consumption and Chinese economic growth, that is, economic growth and the development of the renewable energy industry promote each other. The results of Bhattacharya et al. (2016), which calculate the long-term output elasticity, showed that renewable energy consumption has a significant positive impact on the economic output of most of the countries selected for the study. Roula (2016) showed that increasing the consumption of renewable energy not only contributes to the protection of the environment, but also to the economic growth of countries. Inglesi-lotz (2016) results showed that renewable energy consumption or its share in the energy mix had a positive impact on economic growth, which was statistically significant. Z. X. Wang et al. (2017) explored the global renewable energy landscape, noting that trade in renewable energy can improve technology and optimize industry and demographics. Khan et al. (2020) investigated how renewable energy consumption interacted with international trade and environmental quality in the Nordic countries from 2001 to 2018 and showed that renewable energy consumption stimulated international trade and improved environmental quality. Bekun (2022) explored the impact of renewable energy consumption and energy investment on carbon dioxide emission in the Indian economy, where the regression results showed that renewable energy consumption was negatively associated with carbon dioxide emission. Caglar et al. (2022) analyzed the impact of partnership energy investment and the complexity of the global economy on BRICS’ carbon dioxide emissions. The empirical results suggested that investment in renewable energy slowed down environmental degradation.
Problems and Dilemmas in the Development of the Renewable Energy Industry
Some scholars have explored the problems and causes of the development of renewable energy industry. X. Y. Liu (2010) suggested that the key to the overcapacity problem that erupted after the financial crisis was the environmental value of new energy and the lack of environmental policies. Y. Q. Liu and Kokko (2010) analyzed the impact of the wind power overcapacity problem on international trade in three dimensions: price policy, transmission capacity, and equipment manufacturing structure. Shi (2012) argued that shrinking international markets, incompatible domestic industrial development and market cultivation, and incompatible productivity development and institutional construction had led to overcapacity, while stating that the lack of international competitiveness of Chinese new energy industry was also a cause of shrinking external demand and domestic overcapacity. Luo et al. (2015) pointed out that Chinese new energy development faced three major challenges: key core technologies lag behind international levels and were heavily dependent on overseas, they did not yet have the attributes of a high-tech industry, and the construction process had high energy consumption and pollution problems. Xiong and Yang (2016) focused on the overcapacity of Chinese photovoltaic industry and examined the effects of government subsidies. Adedoyin et al. (2021) showed that the Brexit and the Greek bailout crisis can hinder the development of renewable energy and increase carbon emission, thus concluding that the development of renewable energy is influenced by the political environment and economic crisis.
Some scholars have also analyzed the foreign trade dilemma of Chinese renewable energy industry. According to Y. H. Li (2013), trade barriers imposed by the world’s major economies are one of the main constraints to the rapid development of Chinese renewable energy industry. Chen and Tu (2013) suggested that the development of Chinese foreign trade in the new energy industry had been severely impacted by the US “dual-track countervailing” strategy, and put forward countermeasures based on the ideas of domestic initiative to limit power, WTO limitation and expansion of power, active response to US lawsuits, and litigation and countermeasures against the US. Y. Fu (2013) showed that improving the international competitiveness of Chinese new energy industry was the fundamental way to break the dilemma and solve the problem of foreign trade in renewable energy.
International Cooperative Research on Renewable Energy
The international cooperation in renewable energy industry has received a lot of attention from scholars. Zhang et al. (2014) introduced the “renewable energy cooperation index” and pointed out that there are potential advantages of cooperation between China and the US in the field of renewable energy, and that the cooperation between China and the US in new energy should be promoted to achieve mutual benefits and win-win situation. Kalirajan and Liu (2016) pointed out that the effective operation of the RCEP had strengthed technical cooperation in the production of renewable energy products in Asia and facilitated the elimination of non-tariff barriers. Sharvini et al. (2018) analyzed the renewable energy policies of China, Japan, Malaysia, and Indonesia through a SWOT model, highlighting the need to strengthen the multi-level governance process and enhance cooperation among the four countries to strengthen the competitiveness of their renewable energy sectors in the global energy market. W. Q. Wang (2019) found that Africa is rich in renewable energy resources and there is huge scope for China-Africa energy cooperation, suggesting that China and Africa should establish a long-term cooperation mechanism for the open use of renewable energy to achieve win-win cooperation. Xu and Wang (2019) carried out a study on the current situation of renewable energy development in Kazakhstan and found that it is rich in renewable energy resources, proposing that China-Kazakhstan renewable energy cooperation should be further promoted. Yuan (2020) pointed out that the countries along the Belt and Road were rich in solar energy resources and have great potential for cooperation and development, and that cooperation with Chinese photovoltaic industry was in good shape. Xia (2022) showed that RCEP countries have a prominent position in Chinese outbound energy investments and that the new energy sector has become a new growth point for Chinese companies’ investment layout.
Analysis of the International Competitiveness of Renewable Energy
Many scholars have studied the international competitiveness of the renewable energy industry. Shuai, Cheng, et al. (2018) used the CMS model and the RCA index method to analyze the long-term trend of Chinese international competitiveness of renewable energy products in the context of the Belt and Road, and found that its overall international competitiveness had declined, the comparative advantages of different types of products were widely disparate, and the ASEAN and South Asia markets were growing faster. Cao et al. (2018) empirically measured the technological structure of Chinese exports of renewable energy from 2007 to 2016, indicating that the technological structure of Chinese exports of REP deteriorated, with the overall technology level in the middle of the global industrial value chain and technology to be improved. Shuai, Chen, et al. (2018) found that the international competitiveness of Chinese solar photovoltaic products has been rising, and ASEAN and South Asia regions have become regional markets with rapidly growing demand. Shuai et al. (2022) constructed a new multidimensional evaluation index to estimate the international competitive advantage of national exports of renewable energy products. The results showed that the US had a strong international competitiveness of renewable energy products, while China and India had achieved rapid growth. C. Li (2022) showed through CMS model analysis that the competitiveness of Chinese energy goods exports to ASEAN is facing a bottleneck, and that the RCEP tariff rules should be systematically studied to cultivate multiple competitive advantages.
Several scholars have also studied the drivers affecting the competitiveness of renewable energy exports. Kim and Kim (2015) empirical results showed that domestic R&D on renewable energy technologies is conducive to increasing the export volume and foreign trade competitiveness of renewable energy products. J. Y. Fu and Wu (2015) showed that renewable energy R&D expenditure and the quality of institutions in importing countries have a significant impact on the depth of exports in the solar industry. Fang et al. (2018) assessed the competitiveness of renewable energy in G20 countries through the Porter Diamond model and investigated the main drivers of the renewable energy industry. M. Liu (2015) also argued that the competitive advantage of Chinese new energy industry in the international market is increasing, and that the scale of exports is influenced by the total size of the country’s economy, the total consumption of the exporting country, the total consumption of the country, and the bilateral distance. Schmidt et al. (2019) established four drivers to promote renewable energy trade through a global modeling study, which were new production of renewable energy carriers technologies, social acceptance of renewable energy and land availability, economics of renewable energy systems, and reduction of stranded investments in the fossil fuel industry. Saqib et al. (2022) investigated the impact of technological innovation on the ecological footprint of G-7 countries from 1990 to 2020 through the CS-ARDL model, and the study showed that ecologically sustainable technological innovation is conducive to the application of renewable energy. Bekun et al. (2022) pointed out that institutional quality plays a significant role in energy transition, and policy makers should focus on optimizing policies to improve environmental quality and promote the utilization of renewable energy. Based on an expanded CMS model, Ge and Zhao (2022) deconstructed the drivers of growth in Chinese exports to the new energy industry in RCEP countries and found that the significant growth in the scale of Chinese exports to the RCEP new energy industry was mainly due to the expansion in the scale of import demand and the overall improvement in export competitiveness.
The literature review shows that: there are relatively abundant studies on renewable energy in the world, but so far, studies on the export competitiveness of China’s renewable energy products based on the RCEP context and the all-trade product perspective are relatively rare. The marginal contributions of this paper are: (1) this paper objectively describes China’s international trade of renewable energy products in the past 16 years, so that readers can clearly understand the development stage of China’s renewable energy; (2) this study measures the long-term trend of China’s international competitiveness and comparative advantage of renewable energy products from 2006 to 2021 through CMS model, so as to reveal the core factors affecting the export growth of China’s renewable energy industry; (3) this paper explores the development opportunities of China’s renewable energy trade in the context of RCEP and investigates the comparative advantages of renewable energy in RCEP countries with the IRCA index to contribute to the regional economic study of RCEP.
Data Sources, Research Methodology, and Regional Classification
Data Sources
In this paper, six types of renewable energy, namely solar energy, wind energy, hydraulic energy, biomass energy, geothermal energy, and ocean energy, including a total of 81 different varieties of renewable energy products from China, the world and the remaining 14 countries of the RCEP, are selected as samples for the study. The HS code classification of each renewable energy product is shown in Table 1.
Table of HS Codes for Renewable Energy Products.

Source. Author’s classification based on UN comtrade database HS codes.
The data in this paper is obtained from the UN comtrade Database and the World Bank database (data.world bank), through the International Convention on the Harmonized System of Commodity Description and Coding (HS Code) classification statistics, to obtain data on China and the world and the remaining 14 countries of the RCEP from 2006 to 2021. The data on trade in renewable energy products were obtained from China and the world and the remaining 14 countries of the RCEP for the period 2006 to 2021 using the HS code classification methodology.
If any scholars are interested in reproducing the research of this paper, we would like to share our original data sets in the Excel format.
Research Methodology
Constant Market Share (CMS) Model
The Constant Market Share (CMS) model, first proposed by Tyszynski in 1951, has been refined and improved by a number of scholars in the course of subsequent research and application, and the version used in this paper is the most widely used version, Jepma (1989). The CMS model has the advantage of being able to clearly quantify the export trade fluctuations and perform the degree of contribution calculations. It has become one of the most important models used by scholars worldwide to explain the sources of export growth and general trends in the international competitiveness of exported goods.
In order to analyze the changing trends in the export competitiveness of Chinese renewable energy products over the past 16 years, this paper adopts a constant market share (CMS) model to quantitatively decompose the export growth at different stages, and through a static and dynamic comparison of the CMS model measurement results, it attempts to deeply explore the evolution pattern of Chinese international competitiveness of renewable energy products in the context of RCEP and its influencing factors.
Assuming that China exports n renewable energy products to m destinations, with the RCEP region as the target market, the total export growth of renewable energy (
The first level of decomposition is given by

Structural effects Competition effects Second order effects
The second level of decomposition is given by

(1) rowth effect (2) Market effect (3) Commodity effect

(4) Structural interaction effects (5) General competition effects

(6) Specific competitive effects (7) Pure second order effects

(8) Dynamic structural residuals
Here
Weighted Revealed Comparative Advantage (IRCA) Index
This paper uses the projection tracing method to downscale a number of variables reflecting the competitiveness of renewable energy products to obtain weights, which are then weighted to construct an improved Index of Revealed Comparative Advantage (IRCA), which is modeled as follows.

where
(1) Traditional RCA Index
The traditional display of comparative advantage (RCA) index, often used to reflect a country’s comparative advantage in trade in a particular industry, has become a persuasive measure of competitiveness. The basic form of the traditional RCA index is as follows.

Here,
As countries’ comprehensive strength increases and the international economic situation continues to change, some scholars have found that the traditional RCA model has obvious limitations when applied to the present time. The traditional RCA index is more inclined to static analysis, ignoring the dynamic trend of national trade development and the fact that national resource endowments and even comparative advantages are constantly evolving, and therefore the predictive effect is insufficient. In this paper, we select indicators related to the export competitiveness of renewable energy products of each country, reduce the dimensionality and construct weights by projection tracing method, and improve the weighting of the traditional RCA model.
(2) Competitiveness weights
In this paper, weights are obtained by the projection tracing method. Projection tracing is a class of statistical methods for processing and analyzing high-dimensional data. The basic idea is to project high-dimensional data onto a low-dimensional subspace and find a projection that reflects the structure or characteristics of the original high-dimensional data in order to analyze the high-dimensional data. This study uses this method to transform multiple variables related to export competitiveness, that is, p-dimensional data
① Selection of indicators
Based on the availability of data, this paper identifies six specific factors that affect the trade flows of renewable energy products in China: GDP (US$ million), population size, export trade of renewable energy products (US$ million), the ratio of exports of renewable energy products to total exports, renewable energy consumption, and renewable energy generation from 2006 to 2021.
② Projection tracing modeling process
Considering being friendly to practitioners other than academia and allowing more scholars to reproduce our research process, we include the process of projection tracking modeling in the appendix of the paper.
Study Area Division
The Regional Comprehensive Economic Partnership, or RCEP (Regional Comprehensive Economic Partnership), is an agreement initiated by ASEAN in 2012 and formally signed in 2020 with a total of 15 country members. Based on the regional characteristics of the study objectives and the remaining 14 RCEP countries, we classify the target markets for Chinese renewable energy exports as Japan, South Korea, Australia, New Zealand, and the ten ASEAN countries (Singapore, Malaysia, Indonesia, Myanmar, Thailand, Laos, Cambodia, Vietnam, Brunei, and the Philippines), for a total of five regions.
Chinese International Trade in Renewable Energy Products
Development Trend of Chinese International Trade in Renewable Energy Products
General Trends
In the past 16 years from 2006 to 2021, China’s total international trade in renewable energy has increased significantly. According to the search and statistics of the United Nations Statistics Program Trade Data (UN comtrade), it can be seen that since 2006, the overall trend of China’s renewable energy trade is improving (see Table 2 and Figure 1). The total amount of imports and exports increased from US $107.592 billion in 2006 to US $266.232 billion in 2021, an increase of US $158.64 billion, with a growth rate of 147.45%. From 2006 to 2009, China’s renewable energy trade has been in the trade deficit stage, but the deficit decreased year by year. In 2009, the trade deficit was only $6.805 billion (see Table 2); the surplus continued to grow, increasing from $1.277 billion in 2010 to $97.329 billion, an increase of 76.22 times and an annual growth rate of 48.28% (see Figure 2).
Overall Trends in Chinese Renewable Energy Trade, 2006 to 2021 (in US$ Million).

Source. Authors’ calculations based on UN comtrade database data.

Overall trends in Chinese trade in renewable energy products, 2006 to 2021 (in US$ million).

Chinese trade surplus in renewable energy products, 2006 to 2021 (in US$ million).
Trends in structural change
(1) Structural changes in the export of different types of renewable energy products
From the perspective of dynamic trends, during the period 2006 to 2021, the proportion of solar energy exports in the exports of renewable energy products first increased and then decreased, reaching a maximum of 75.21% in 2010; the proportion of wind energy and biomass exports showed an overall upward trend, rising from 11.07% and 7.53% to 19.83% and 7.98% respectively; The proportion of exports of geothermal energy products generally showed a downward trend, from 4.82% to 1.94%; hydraulic energy and marine energy products basically remained stable (see Table 3).
Trends in the Structure of Exports of Different Types of Renewable Energy Products, 2006 to 2021.

Source. Authors’ calculations based on UN comtrade database data.
(2) Structural changes in the import of different types of renewable energy products
In terms of dynamic trends, between 2006 and 2021, the share of solar energy products in the import of renewable energy products has generally shown a trend of fluctuating downward, from a high of 68.43% in 2007 to 52.51% in 2021; the share of wind energy products has increased in fluctuation, from 11.96% to 24.03%; the share of biomass energy products has always been fluctuating. The share of biomass energy products is always fluctuating, fluctuating between 13.71% and 19.66%, with an overall upward trend; the share of hydraulic energy, geothermal energy, and marine energy products remains basically stable (see Table 4).
Trends in the Import Structure of Different Types of Renewable Energy Products, 2006 to 2021.

Source. Authors’ calculations based on UN comtrade database data.
(3) Structural changes in the total import and export of various types of renewable energy products
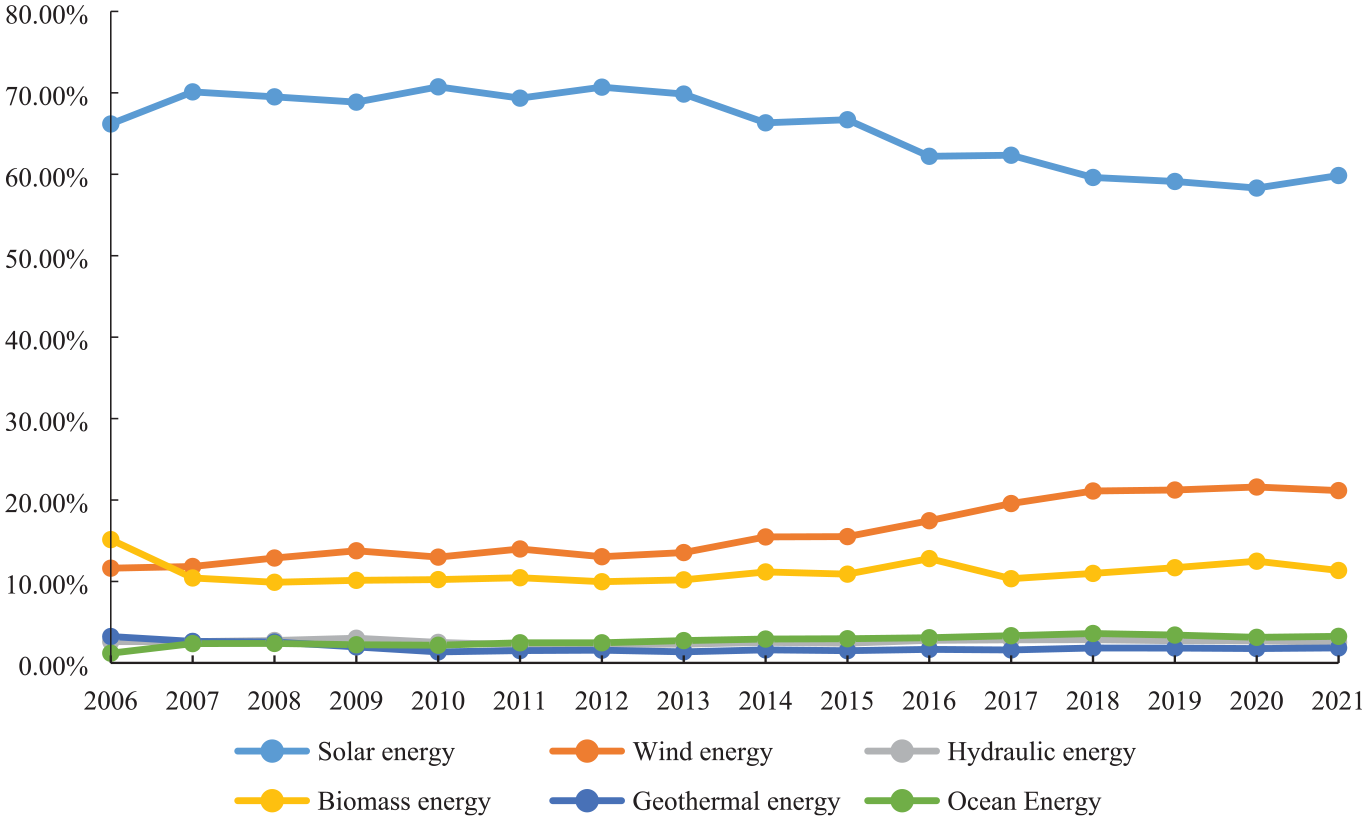
From the total import and export of all kinds of renewable energy products, solar, wind and biomass are the main varieties of Chinese renewable energy products trade in the 16 years from 2006 to 2021, accounting for more than 90% of Chinese total renewable energy import and export.
Among them, solar energy trade accounted for the largest proportion, accounting for more than 58%, but from 2006 to 2021, solar energy trade accounted for the overall declining trend, from 66.19% to 59.85%; wind energy products import and export trade accounted for the second, accounting for more than 10%, in 2018 exceeded 21%, and trade accounted for a year-on-year increase in the trend, from 11.63% to 21.16%; the trade volume of biomass energy is second only to wind energy, and the proportion of trade remains basically stable, accounting for about 10%; the import and export trade volume of hydraulic energy, geothermal energy, and marine energy accounts for a relatively low proportion, each accounting for about 1% to 3% (see Table 5 and Figure 3).
Structural Changes in Total Exports and Imports of Various Types of Renewable Energy Products, 2006 to 2021.

Source. Authors’ calculations based on UN comtrade database data.
Structural changes in total imports and exports of various types of renewable energy products, 2006 to 2021.
(4) Changes in the Structure of Chinese Target Markets for Renewable Energy Products Exports
According to the dynamic trends, between 2006 and 2021, the market share of RCEP countries generally showed an upward trend in the structural distribution of Chinese target markets for renewable energy exports, rising from 22.68% in 2007 to 26.61% in 2021, while the share of the rest of the world showed a downward trend amidst fluctuations. Among the top five export regions of RCEP countries, Australia and the ten ASEAN countries have experienced greater market share growth between 2006 and 2021, with Japan’s market share continuing to decline amid fluctuations. Australia’s market share remained at around 0.02% until 2014, surpassing 1.80% after 2014 and having increased to 2.56% by 2021, but the increase in market share was not significant; the ASEAN-10 countries’ market share increased by 6.57% from 9.24% to 15.81% over the 16-year period; Japan’s market share declined significantly, from 10.18% in 2006 to 4.91% in 2021; the market shares of Korea and New Zealand are basically stable (see Table 6).
Trends in the Structure of Chinese Target Markets for Exports of Renewable Energy Products, 2006 to 2021.

Source. Authors’ calculations based on UN comtrade database data.
Analysis of CMS Model Results: International Competitiveness of Chinese Renewable Energy Products
Delineation of Study Intervals
According to different development trends, China’s renewable energy export trade from 2006 to 2021 can be roughly divided into six stages. The first stage (2006–2008), when Chinese renewable energy exports showed a gradual increase before the financial crisis; the second stage (2008–2009), when Chinese renewable energy exports fell sharply due to the financial crisis; and the third stage (2009–2012) witnessed a the recovery of the world economy The fourth phase (2012–2016), with the global economic recovery slowing down, inflation level is low, trade growth rate declined, Chinese renewable energy export trade volume turned to a downward trend; the fifth phase (2016–2020), due to the energy price index rebound, price level improved, Chinese renewable energy export volume slowly. In the sixth phase (2020–2021), China was the first country to emerge from the impact of the new epidemic and the new opportunities presented by the signing of the RCEP, resulting in a sudden increase in the export trade of renewable energy products (see Figure 4).

Trends in Chinese exports of renewable energy products, 2006 to 2021 (in US$ million).
Based on the above division of stages, we used the CMS model to conduct statistics and analysis on the export data of Chinese renewable energy products in each stage, and then compared the change trend of each interval, aiming to explore the change pattern of Chinese international competitiveness of renewable energy products in the context of RCEP.
Results and Analysis
Table 7 shows the results of the six-stage CMS model analysis. The following is a description and analysis of the results of the study.
Results of CMS Model Analysis for Renewable Energy Products in China in the Context of RCEP 2006 to 2021 (in US$ Million).

The Overall International Competitiveness of Chinese Renewable Energy Products is on the Rise
A positive GCE indicates that the increase in overall competitiveness has a positive effect on Chinese exports of renewable energy products, while the opposite is negative. the GCE for all six periods from 2006 to 2021 is positive, indicating that the increase in overall competitiveness has bolstered Chinese exports of renewable energy products. The general competition effect decreases from 52.56% in 2006–2008 to 2.01% in 2008–2009, increases from 2009 to 2012 with an effect of 32.25%, increases significantly from 2012 to 2016 with an effect of 296.13%, and decreases slightly from 2016 to 2020 with an effect of 73.26%. The general competitive effect stabilizes at 70.26% for 2020 to 2021. This indicates that, in the context of the RCEP, the overall competitiveness of Chinese renewable energy products has maintained an upward trend, except for the setback in the general competitive effect when the financial crisis hit.
Positive values of the specific competition effect indicate an increase in the value of exports due to the increased competitiveness of Chinese exports of renewable energy products in the RCEP market and a change in the structure of product exports in line with changes in demand in the target market, while negative values indicate the opposite. The specific competition effect was negative for all periods except 2008 to 2009. The specific competition effect increased from −6.96% in 2006 to 2008 to 15.09% between 2008 and 2009, turning from negative to positive, indicating that the structure of Chinese exports of renewable energy products improved and adapted to changes in demand in the RCEP market. However, the specific competition effect declined again to −3.84% in 2009 to 2012 and fell further to −165.43% in 2012 to 2016, indicating that the structure of Chinese exports of renewable energy products deteriorated and deviated from the changing trend of demand in the RCEP market. the specific competition effect retraced to −24.79% in 2016 to 2020, and in 2020 to 2021 compared to the previous The effect of −5.52% is still negative, indicating that China has made some optimization of the structure of its exports of renewable energy products, although it has not always been well-aligned with changes in demand in its target markets.
Growth Effects are an Important Factor in the Volatility of Chinese Renewable Energy Exports
Between 2006 and 2008, the value of Chinese renewable energy exports to RCEP countries increased by US$7,167.86 million, with the structural effect accounting for 50.41% (of which the growth effect accounted for 34.69%) and the competition effect for 45.61%, indicating that the growth effect of renewable energy products and the improvement of product structure played an important role in the growth of Chinese renewable energy product exports.
In 2008 to 2009, hit by the financial crisis, Chinese renewable energy export trade value dropped sharply, with the total volume decreasing by US$ 1979.18 million, of which the growth effect also fell sharply, resulting in a decrease of US$ 2249.72 million in the structural effect; at the same time, although the competition effect increased the export value by US$ 338.28 million, it dropped to 17.09% compared with the previous period, with the competition effect and the hindering effect of the simultaneous decline of the competition effect and the structural effect led to a negative growth in the value of exports. This indicates that the economic crisis led to a decrease in demand for renewable energy products from the RCEP countries and a consequent slowdown in the growth rate of the competitiveness of Chinese renewable energy product exports.
In contrast, Chinese exports of renewable energy products decreased by US$493.49 million between 2012 and 2016, with the structural effect leading to a 32.80% decrease in exports (whose growth effect was −378.78%), the second-order effect reducing exports by 197.87% and the competition effect increasing to 130.70%. This shows that the boosting effect of the rapid rise in competitiveness was offset by the hindering effect of the growth effect and the sharp fall in the second-order effect, with the contraction of RCEP and even world demand leading to a reduction in the value of Chinese exports of renewable energy products.
From 2020 to 2021, in just 1 year, Chinese renewable energy export trade grew by US$7,498.82 million. Of this, the growth effect has increased to 26.35% from the previous period and the competition effect has increased the export value by 64.74%. This indicates that China has seized the opportunity of the significant increase in demand for renewable energy products after the signing of the RCEP agreement, while pushing forward the expansion of exports with a stable growth competition effect, thus increasing the value of Chinese renewable energy products exports.
The Product Structure and Market Structure of Chinese Renewable Energy Products Still Need to be Optimized
The product structure of Chinese exports of renewable energy products can be observed by the commodity effect of the CMS calculation results, while the market structure is observed by the dynamic residuals. Dynamic structural residuals are an important component of the second-order effect and an influential factor in the growth of Chinese exports of renewable energy products, with positive values indicating that Chinese export share of renewable energy products is growing faster in product markets where RCEP is growing faster, and negative values indicate the opposite. In terms of trends, both the commodity effect and the dynamic structural residual of Chinese exports of renewable energy products have shown a fluctuating trend of rising, then falling, then rising, and then falling again since 2006, with insufficient stability, requiring constant attention to international patterns for adjusting and optimizing the structure.
The commodity effect is generally on a downward trend, from 20.72% in 2006–2008 to 7.60% in 2020–2021. This indicates that the product structure of Chinese renewable energy trade in the RCEP region is on a deteriorating trend; from the cross-sectional data for 2020 to 2021, the dynamic structural residual is −4.52%, indicating that the dynamic residual limits the growth of Chinese renewable energy product exports. The dynamic structural residual is basically negative at all stages from 2006 to 2021, which indicates that in the RCEP import demand growth of the more. This suggests that the international competitiveness of Chinese renewable energy products is slower to increase in product markets with faster growth in RCEP import demand. However, we also find that the dynamic residual increases to 1.20% in 2009 to 2012 and 9.74% in 2016 to 2020. It can be seen that China attaches importance to adjusting the market structure of its renewable energy product exports, hoping to improve its competitiveness in regions where product demand is growing faster and making efforts to do so, but it is difficult to control the world market share of renewable energy product exports due to the instability of the overall trade environment. Therefore, the product structure and market structure of Chinese renewable energy products still need to be further optimized.
Analysis of IRCA Index Results: Comparative Advantages of Renewable Energy Products in China
On the basis of the CMS model measure, this paper also uses a weighted and improved IRCA index method to analyze the comparative advantage of Chinese export trade in each renewable energy sector (see Table 8 and Figure 6). In order to find the IRCA index for each commodity group in each year, the paper uses the real number coded accelerated heritage algorithm (RAGA) to optimize the projection tracing method, and the solution process is carried out via MATLAB. The weights of each indicator are
Explicit Comparative Advantage (IRCA) Index for Renewable Energy Products in China, 2006 to 2021.

Source: Authors’ calculations based on UN comtrade and World Bank database, using the IRCA index method.

Convergence process of the genetic algorithm.

Trends in IRCA index for renewable energy products in China, 2006 to 2021.
The indicator weights were back substituted to obtain the projection values for each year from 2006 to 2021 in China, that is, the weights for each year, and then multiplying the weights for each year with the RCA index to obtain the IRCA index, the results are shown in Table 8 and the trend is shown in Figure 6.
The results of the analysis show that Chinese major renewable energy products have a strong comparative advantage overall. The IRCA index for all types of renewable energy products is greater than 1 in the static cross-section in 2021, with solar products having an IRCA index of 4.60 and wind products having an IRCA index of 2.12. Meanwhile, the IRCA index for all types of renewable energy products is on an overall upward trend.
The IRCA index for Chinese Solar Products Has Fluctuated Upward, Maintaining a High Comparative Advantage in the International Market
In the past 16 years, the IRCA index for solar products has stabilized at over 2.5 after breaking through 2 in 2010, and will rise to 4.60 in 2021. It has become one of the few strategic emerging industries in China that can participate in international competition at the same time and reach the leading international level. In recent years, due to the improvement of solar photovoltaic technology and strong government support, the cost of using solar photovoltaic power generation has been greatly reduced, and Chinese solar photovoltaic market has been developing rapidly. In 2021, China had launched a number of technology research and development projects for the development of key areas, key technologies and industry shortcomings in the solar power industry, which is of great significance in promoting the development of the solar power industry.
China has a Medium Comparative Advantage With a Rapidly Growing IRCA Index for Wind and Hydraulic Energy Products
The IRCA index for wind energy products had increased from 0.14 in 2007 to 2.12 in 2021, and for hydraulic energy products from 0.25 in 2007 to 2.44 in 2021, both exceeding 2 in 2021. energy products have been strengthening their competitive export position.
In 2021, Chinese installed wind power capacity reached 328 million kilowatts, an increase of 16.6% year-on-year. Chinese rich wind energy resources have good development prospects and huge potential for the development of electricity. In third-party market studies, Chinese wind energy industry exports show a rapid growth trend in the RCEP market, which provides an explanation for the continued increase in the competitiveness of Chinese wind energy products.
Data from Chinese National Energy Administration shows that China will have a total installed hydropower capacity of 391 million kilowatts in 2021, of which 23.49 million kilowatts will be newly installed, maintaining its position as the world’s number one installed hydropower capacity. China has abundant reserves of hydropower energy, a significant and stable market share in hydropower construction, and a steadily increasing scale advantage. The combined effect of these factors has significantly increased the international competitiveness and influence of Chinese hydropower energy products.
The Comparative Advantages of Chinese Geothermal Energy and Marine Energy Products Have Been Steadily Increasing
The IRCA index for geothermal energy products broke through 1 in 2011 and then fluctuated upward to reach 1.86 in 2021, indicating that Chinese exports of geothermal energy products are internationally competitive. The IRCA index for marine energy products has been on the rise, breaking through 1 to reach 1.09 after 2012, and showing a year-on-year upward trend from 2012 to 2021, reaching 1.80 in 2021, indicating that the export competitiveness of Chinese marine energy products continues to improve.
The Comparative Advantage of Chinese Biomass Products is Increasing, but the Growth Rate is Slow
Between 2006 and 2019, the IRCA index for Chinese biomass products slowly increased year by year and was always below 1 and at a stage of comparative disadvantage. The IRCA index for biomass energy products broke through 1 in 2020 and reached 1.29 in 2021, indicating that the export competitiveness of Chinese biomass energy products is increasing but is still at a stage of less comparative advantage overall.
Discussion
Perspectiveness
The Research in this Paper is to Expand the Public’s Understanding of the Development Status and Future Trend of Renewable Energy
In the context of the global energy transition, the development of renewable energy has become an important driving force for sustainable economic development. The research on renewable energy has broad and far-reaching significance for how to guarantee energy security, protect the ecological environment, and realize sustainable development. This study of the international competitiveness of China’s renewable energy products is conducive to the objective cognition of the development stage of China’s renewable energy, and can also analyze how to better develop renewable energy from the factors affecting the competitiveness, so as to improve the efficiency of energy transformation and realize the high-quality development of renewable energy industry.
The Method Adopted in this Study has Some Improvement Over Previous Measures of International Competitiveness
How to measure the international competitiveness of products in international trade has always been a hot topic in academia. In the previous research by scholars, the methods of international market share (IMS), trade competitiveness index (TC), Display Comparative Advantage Index (RCA), competitive Comparative Advantage Index (CA), and the establishment of competitiveness index system are often used to measure the international competitiveness level of products. The above methods have certain limitations: (1) analyze the trade competitiveness of export products only from the perspective of import and export trade volume, ignoring the many influencing factors leading to international competitiveness, and the analysis level stays on the surface; (2) although the results can objectively evaluate the product competitiveness, it is difficult to analyze the driving factors affecting the change of competitiveness; (3) the method of establishing international competitiveness index system can be regarded as a good method, but often not recognized by experts, because the index selection and weight setting are subjective.
In this paper, the CMS model and the improved IRCA index method are adopted as the research method to make up for the above disadvantages to a certain extent. The fixed market share model (CMS) can decompose the driving factors of export growth from three aspects: structure effect, competition effect, and second-order effect, so as to explain the reasons for the change of international competitiveness of products; (3) we try to add more indicators and other influencing factors, thus designing the improved IRCA index method. That is, to change the factors affecting the development of national renewable energy into weights, so as to correct and optimize the results of the RCA index method.
The Research in this Paper is Based on the Background of RCEP and Contributes to the Coordinated Regional Development
RCEP is a very valuable research topic and direction. The research in this paper basically expounds the development status of renewable energy in RCEP region, and shows the future possibility of mutual energy supply and common development in RCEP region.
Inadequacy
There is Still Some Room for Improvement in the Research Methods
Through the comprehensive use of CMS model and IRCA index method, although the international competitiveness of renewable energy products can be measured comprehensively and objectively, it also stays in the calculation of commodity import and export trade volume, and the perspective is too macro. From the analysis of C. Li (2022) on China’s commodity export growth model, we can see the possibility of conducting the heterogeneity analysis in the product field and country field in the CMS model. This is the direction that this study can be optimized in the future.
The Driving Factors Affecting the International Competitiveness of Renewable Energy Products can be Further Deepened
When explaining the reasons for the change in the competitiveness of various renewable energy products over the past 16 years, we only explained the changes in the data and the events that affected the renewable energy sector at that time but did not analyze the detailed impact mechanism. This is a part worthy of further study in the future, but in view of the macro- perspective and limited space of this paper, we cannot add this part of research.
Improvements in Future Research
The author believes that there are three aspects worth digging in the future research.
(1) Design a brand-new way to evaluate the international competitiveness. Based on the new assumption, a more reasonable way to evaluate the international competitiveness of products has not yet emerged. How to better explore the driving factors affecting product competitiveness is also a problem to be solved; (2) refine the perspective of renewable energy research. Future research can explore renewable energy from the perspective of mesoeconomics and micro-energy enterprises, which will lead to more valuable theoretical recommendations; (3) actively participate in background studies on RCEP, which will provide value to the economic development of East Asia.
Conclusions and Recommendations
Conclusions
The Overall Competitiveness of Chinese Renewable Energy Products has Shown an Upward Trend
Chinese renewable energy exports were US$40,069.21 million in 2006, increasing to US$181,780.43 million in 2021, an increase of 353.67%. During the sixteen-year period from 2006 to 2021, the international competitiveness of renewable energy products fluctuated considerably at different stages due to the global financial crisis, reverse globalization and the New Crown epidemic, but the overall competitiveness showed an upward trend. the competitive effect was positive in all stages from 2006 to 2021, rising from 45.61% in 2006–2008 to 64.74% in 2020–2021. 64.74%, indicating that the competitiveness of Chinese renewable energy products is steadily increasing.
The Comparative Advantages of Chinese Renewable Energy Products are Strong, With Differences Between Different Industries
On the whole, Chinese renewable energy products have a strong comparative advantage. Among them, solar energy products have a strong comparative advantage, wind energy and hydraulic energy products have a medium comparative advantage, geothermal energy and marine energy products have a certain comparative advantage, and biomass energy has a weak comparative advantage. During the period 2006 to 2021, Chinese exports of solar energy products accounted for the highest proportion of all renewable energy exports, and its export share has been above 60%, with a strong comparative advantage of 4.60 in the IRCA index in 2021. In recent years, the IRCA index for Chinese wind and hydraulic energy products has exceeded 2, IRCA index for geothermal and ocean energy products has steadily increased and exceeded 1.5, and IRCA index for biomass products has increased year on year, but at a slow pace and only slightly exceeded 1 in the last 2 years.
The Growth Effect is the Main Reason for the Volatility of Chinese Exports of Renewable Energy Products
In the context of the RCEP, fluctuations in Chinese total exports of renewable energy products mainly stem from changes in demand for renewable energy products in the world market. between 2006 and 2021, events such as the financial crisis, trade frictions, reverse globalization, and the new crown epidemic caused constant fluctuations in world demand for renewable energy products, which had a serious negative impact on Chinese exports of renewable energy products. between 2006 and 2008, the value of Chinese renewable energy exports to RCEP countries increased by US$7,167.86 million, of which the structural effect accounted for 50.41% (of which the growth effect accounted for 34.69%) and the competition effect accounted for 45.61%; between 2008 and 2009, due to the financial crisis, the value of Chinese renewable energy export trade dropped significantly, with the total volume decreasing by US$1,979.18 million, of which the growth effect also fell sharply, resulting in a decrease in the structural effect of US$2249.72 million; between 2009 and 2012, the competition effect was 28.41% of the growth in the value of Chinese renewable energy exports, up from the previous period, and the growth effect also turned from negative to positive, rising to 50.40%; between 2012 and 2016, trade frictions intensified and the economic recovery slowed down. The growth effect fell to -378.78% between 2012 and 2016, resulting in a decrease of US$493.49 million in the value of Chinese renewable energy exports; between 2016 and 2021, the value of Chinese renewable energy exports turned from negative to positive and increased significantly and rapidly, with an increase of US$7,498.82 million in the year 2020 to 2021. It can be seen that the growth effect is the main reason for the fluctuation of Chinese renewable energy products exports.
The Signing of RCEP has Injected New Vitality into Chinese Energy Trade
Chinese renewable energy products continue to cluster in regional markets where demand is growing faster, and the markets of RCEP countries are growing faster, bringing new development opportunities for Chinese renewable energy trade. Analysis of the RCEP market structure of Chinese renewable energy exports reveals that the market share of Chinese renewable energy products exported to RCEP countries has steadily increased, from 22.68% in 2007 to 26.61% in 2020. Among them, the market share of Chinese renewable energy products in the ten ASEAN countries continues to grow, rising from 11.42% in 2016 to 15.81% in 2021. Market share in Japan and South Korea, on the other hand, has been declining, but nevertheless, Japan and South Korea still account for a large share so far. Australia and New Zealand’s market shares are not outstanding. Due to differences in economic development and resource endowments, the RCEP countries have developed certain resource and technology complementarities. the implementation of the RCEP strategy has helped optimize Chinese energy structure, promoted cooperation in core energy technologies, enhanced the resilience of Chinese energy system and further safeguarded Chinese energy security.
Policy Recommendations
Based on the above findings, this paper makes the following policy recommendations:
GiveFull Play to the International Comparative Advantage of Chinese Renewable Energy Products
In order to cope with the economic recession brought about by the pandemic and counter-globalization, promote economic recovery and facilitate supply-side structural reform of Chinese energy industry, we must give full play to the international comparative advantages of Chinese renewable energy industry. Firstly, we should give full play to the international competitive advantages of renewable energy products, mainly solar energy, and make the solar, wind and hydraulic energy industries better and stronger, consolidate the dominant position of Chinese solar energy and other products in the international market, and continue to encourage the export trade of solar energy and other products. At the same time, attention should be paid to nurturing renewable energy products whose comparative advantages are increasing year by year, and to exploring the development potential of geothermal energy, marine energy, and biomass energy products to give full play to their special advantages. To this end, the government should formulate preferential policies to stimulate the development of the renewable energy industry and import and export trade, increase investment in capital and advanced technology, and nurture professionals in the field of new energy, so as to further reduce product costs and improve the export competitiveness of Chinese renewable energy products.
Focus on Optimizing the Market Structure and Product Structure of Chinese Renewable Energy Trade
Since 2006, the commodity effect and dynamic structure of Chinese renewable energy product exports have not been stable enough. It is crucial to timely adjust and optimize the market structure and product structure of Chinese renewable energy export trade, which is one of the important measures to improve the competitiveness of Chinese renewable energy product exports. Led by the “the Belt and Road Initiative” concept, we should continue to consolidate the dominant position of Chinese renewable energy products in the RCEP markets such as the ten ASEAN countries, Japan and South Korea, and optimize the market structure with the goal of promoting the sustainable growth of Chinese renewable energy product exports. At the same time, according to the different economic development and resource endowments of different RCEP regions, and paying attention to the policy requirements of the “the Belt and Road Initiative” policy and the urgent local needs, the product structure of Chinese renewable energy trade products should be optimized, so that the export products can better meet the needs of the import market, thus giving full play to the energy industry in the RCEP regions. This will enable the energy industry in the RCEP region to complement each other and improve the international competitiveness of Chinese products.
Insist on Promoting Energy Technology Innovation and Stimulating Core Technology Attacks
Innovation is the first driving force to lead development. Based on the existing strong foundation of renewable energy, China should increase investment in research and development of renewable energy technologies, fill the shortcomings, strengthen the weaknesses, increase the advantages, cultivate and strengthen the new growth point of Chinese industrial upgrading through energy technology innovation, and support the high-quality development of Chinese energy business. At present, some of the key core technologies in energy are restricted by developed countries, which is a matter of great concern. China urgently needs to achieve independent control of key core technologies as the goal, accelerate the layout of basic, forward-looking, disruptive research, play the advantages of the new national system to focus on research, and strive to achieve a breakthrough within a certain period of time. At the same time, it’s wise to improve technical standards and intellectual property systems, consolidate technological advantages, and improve international competitiveness based on international perspective.
Make Full Use of International Resources and Strengthen Energy Cooperation With RCEP Countries
The signing of RCEP has injected new vitality into Chinese energy trade and brought many development opportunities such as the improvement of the energy supply chain and the acceleration of the development of new energy service providers. On the basis of giving full play to independent innovation, we should continue to promote the construction of international cooperation in energy with RCEP countries, carry out complementary advantages in renewable energy markets, technologies and resources, and jointly achieve the optimal development of renewable energy in the world. At the same time, we should accelerate the effective docking of the RCEP energy market with Chinese energy market and form a mutually beneficial and risk-sharing cooperation mechanism under a larger market network, so as to promote Chinese energy transformation and provide security for Chinese energy security.
Footnotes
Appendix
The following is the projection tracing modeling process mentioned in the research method.
In this paper, the data are normalized using the min-max normalization method, and the transformation function for the sequence x is as in Equation 1.
Multiply the p-dimensional data x(i, j) synthetically by
Where
Where
Where
Perform constrained non-linear function optimization and estimate the optimal projection direction.
Maximized scalar function expressions (8).
Binding condition Equation 9.
The derived
Author Contributions
Conceptualization, Qing Guo; methodology, Qing Guo; software and formal analysis, Jingyao Wen; writing—original draft preparation, Qing Guo and Jingyao Wen; writing—review and editing, Qing Guo and Jingyao Wen; supervision and funding acquisition, Qing Guo. All authors have read and agreed to the published version of the manuscript.
Declaration of Conflicting Interests
The author(s) declared no potential conflicts of interest with respect to the research, authorship, and/or publication of this article.
Funding
The author(s) disclosed receipt of the following financial support for the research, authorship, and/or publication of this article: This research is supported by the National Social Science Fund of China (21CJL007).
Institutional Review Board Statement
Not applicable.
Informed Consent Statement
Informed consent was obtained from all the subjects involved in the study.
Data Availability Statement
The data and estimation commands that support the findings of this paper are available on request from the first and corresponding authors.