
Abstract
Trade-in (TON) and trade-old-for-remanufactured (TOR) programs are commonly used to boost consumer demand and recycle old products, and can generate significant economic benefits from disassembling or reusing old products. However, the influence of channel structures on the TON and TOR optimal decisions of closed-loop supply chains (CLSCs) is rarely discussed. To explore the impact of the implementation of the TOR program on the optimal pricing and demand strategy, enterprise profit, environment, and social welfare when the enterprise has applied the TON program, we develop four models with different power structures and market decisions to maximize enterprise profits based on consumer utility and the Stackelberg game: (1) manufacturer-led model with TON (Model M); (2) retailer-led model with TON (Model R); (3) manufacturer-led model with TON and TOR (Model TM); (4) retailer-led model with TON and TOR (Model TR). The manufacturer-led models may benefit consumers more and stimulate the replacement consumers’ demand for TON and TOR programs. Both TON and TOR demand for the Model TM are considerable. However, when the retailer is in the driver’s seat, the retailer can profit more due to government subsidies for the TOR programs. Our analysis provides insights into the choice of corporate power structures, reducing environmental impacts and improving social welfare. This paper studies for the first time the influence of different power structures and government subsidies on TON and TOR programs in CLSCs. Future research could consider the impact of old products quality or multi-period models on TON and TOR programs.
Plain Language Summary
To explore the impact of the implementation of the trade-old-for-remanufactured program on the optimal pricing strategy, demand strategy, enterprise profit, environment, and social welfare when the enterprise has applied the trade-in program, this paper develops a closed-loop supply chain that includes only a manufacturer and retailer and considers power structures and government subsidies. Based on consumer utility and Stackelberg game, we develop four models with different power structures and market decisions to maximize enterprise profits. Our analysis provides insights into the choice of corporate power structures, the reduction of environmental impacts and the improvement of social welfare. This paper studies for the first time the influence of different power structures and government subsidies on trade-in and trade-old-for-remanufactured programs in closed-loop supply chains. Future research could consider the impact of old products quality on TON and TOR programs. We can also consider the impacts of two-period or multi-period models on pricing strategies, TON and TOR strategies.
Keywords
Introduction
The closed-loop supply chain comprises the forward product sales supply chain and the reverse waste recycling supply chain, which can maximize the development of the residual value of waste products and the secondary utilization of waste resources, and realize the multi-win of social benefits, economic benefits and environmental benefits. And previous studies have confirmed that trade-in as a marketing promotion means (Desai et al., 2016) and a way to recycle old products can increase purchase frequency and achieve price discrimination (Vanackere, 1995). The reasonable reuse of the old products recovered in the trade-in promotion activities can also indirectly reduce the cost of enterprise facilitation. And as a tool to collect used products and promote industrial development, trade-in has been widely used in various markets (L. Xiao et al., 2020), such as automobiles, electronic products, home appliances, gold, and jewelry, etc. About half of all new car sales involve the trade-in program in the automobile industry (R. J. Zhu & Dasgupta, 2008). In the electronics industry, consumers in 27 countries can trade their used products for new ones through Apple’s trade-in program (Zhao et al., 2021). Huawei also implements a trade-in program for replacement consumers (JD, 2022). And the proportion of replacement purchases in the US is between 60% and 80% of the annual sales in highly saturated markets like refrigerators and electric water heaters (Fernandez, 2001). In other industries, Xerox provides trade-in services for used printers and promises to pay for the shipping and disposal (Wu, 2013). The Trade-in program is becoming more and more popular with consumers. However, although trade-ins expand the enterprise market and meet the upgrading demands of consumers, the increased demand may not be beneficial to the environment during the production of products. And the remanufactured products may be more environmentally friendly than the new ones (He et al., 2019). Furthermore, the recycling stream of used products brought about by the trade-in programs has the potential to generate revenue through remanufacturing operations and reuse is more beneficial than recycling.
In recent years, the importance of remanufacturing’s environmental performance and economic benefit indeed have attracted more attention (Chuang et al., 2014; Gonsch, 2015; M. Huang et al., 2013). Many companies, such as Canon, Xerox, Dell, and HP, have realized that remanufacturing can be profitable and environmentally friendly (L. Yang et al., 2020). Remanufacturing can not only prolong the service life of products, improve their technical performance and add value, but also provide information for the design, transformation, and maintenance of products, and finally complete the whole life cycle of products with the lowest cost and the least energy and resource consumption. However, the consumers’ acceptance of the remanufactured products is not high since the remanufactured products are remanufactured from recycled used products through multiple processes. In fact, consumers are much less willing to pay for remanufactured products than for new ones. Therefore, stimulating the demand for remanufactured products to achieve environmental protection and resource conservation (Yenipazarli, 2016) has become an interesting topic worth considering.
In 2015, the Chinese government identified ten enterprises (Volkswagen, DCEC, etc.) that could pilot the trade-old-for-remanufactured program of automobile gearboxes or engines (National Development and Reform Commission of China, 2015), the consumers holding used products could purchase a remanufactured product at a discount price by returning the used products. And the implementation of a trade-old-for-remanufactured program can also increase the recycling rate of used products. It may be more attractive to consumers than selling remanufactured products directly. But do companies have the motivation and ability to implement the trade-old-for-remanufactured program? Or when there is a trade-in program in the market, what is the impact of implementing of the trade-old-for-remanufactured strategy on the enterprise’s pricing strategy and the consumer’s purchase decision? In fact, the government subsidy can influence the decisions of firms and consumers. And the government subsidy also helps promote remanufacturing. Therefore, we can explore the impact of government subsidy on implementing the trade-old-for-remanufactured program. And it has a specific significance to improve the efficiency of the whole supply chain (Khan et al., 2019, 2020).
Based on the above, we have realized that although trade-in programs can stimulate market demand, the new products will bring a burden to the environment during the production process. To some extent, the remanufactured products are less harmful to the environment than new products and the sales price of remanufactured products is usually lower than that of new products. And it is possible to achieve economic benefits by remanufacturing the old products from trade-in programs. If the government can subsidize remanufacturing activities, the enterprises will have the opportunity to reduce environmental pollution and achieve economic benefits by implementing trade-in programs. Based on different power structures, the purpose of this paper is to analyze the impact of the implementation of the trade-old-for-remanufactured program (the government will subsidize the trade-old-for-remanufactured program) on the optimal pricing strategy, demand strategy, enterprise profit, environment, and social welfare of the enterprise when the enterprise has implemented the trade-in program. And the previous literature has studied the situation where the manufacturer acts as a leader and the retailer is a follower, without considering the situation where the retailer is the supply chain leader. To fill this gap, we establish four models to explore the influence of trade-in and trade-old-for-remanufactured strategies of the manufacturer and retailer on a closed-loop supply chain under different power structures. There are two types of consumers in the market, namely primary consumers and replacement consumers. And we model each consumer’s purchasing decisions based on the consumers’ utility.
Our paper focus on the following questions:
(1) What are the optimal pricing strategies, consumers’ demand, and enterprises’ profits in the four models? And what influences the changes of the optimal decision in the closed-loop supply chain members?
(2) Is it beneficial for supply chain members to implement trade-in and trade-old-for-remanufactured programs compared to implementing trade-in separately? How will the implementation of the trade-old-for-remanufactured strategy affect the pricing strategies of manufacturers and retailers and the purchasing decisions of consumers?
(3) What are the effects of different power structures on pricing decisions and profits of the manufacturer and retailer, and consumers’ demand in the closed-loop supply chain? Under which power structure the trade-old-for-remanufactured program is more beneficial to the supply chain members?
(4) How does the government subsidy for the trade-old-for-remanufactured program affect the manufacturer and retailer’s optimal decisions under different power structures?
(5) In which case the manufacturer and retailer are making more environmentally friendly decisions? What influences do trade-in and trade-old-for-remanufactured strategies influence social welfare under different power structures? Is the implementation of the trade-old-for-remanufactured program beneficial to the social welfare of the closed-loop supply chain?
To solve these questions, we develop a closed-loop supply chain consists only a manufacturer and a retailer. And the market has two types of consumers: primary and replacement consumers. Based on the game-theoretic model, we investigate four models with different power structures, and the government will subsidize the trade-old-for-remanufactured program. Our results show that the manufacturer-led models can stimulate the replacement consumers’ demand for trade-in and trade-old-for-remanufactured programs. And the manufacturer-led models are more beneficial to both the manufacturer and retailer when there are slightly more primary consumers than replacement consumers in the market. Moreover, the replacement consumers’ demand for the trade-old-for-remanufactured program is related to the government subsidy. And if there are many primary consumers in the market, the environmental impact of Model R will be the largest of the four models. The government subsidy for the trade-old-for-remanufactured program can indeed stimulate an increase in social welfare. The above findings can provide insights into the choice of enterprise power structures, the reduction of environmental impacts, and the enhancement of social welfare. And this paper is the first to study the effects of different power structures and government subsidies on trade-in and trade-old-for-remanufactured reengineering programs in a closed-loop supply chain.
The content constructions of our paper are as follows: We first review the previous literature. And then we show the model descriptions and necessary assumptions. Next, we develop the four models and obtain the optimal decisions. We also compare and analyze the optimal decisions of the four models. In order to further verifies the optimal decisions and relevant conclusions, we provide the numerical analysis. Furthermore, we present a comparative analysis of consumer surplus, environmental impact, and social welfare in the four models. And the conclusions, limitations, and future research are presented in the end.
Literature Review
Our paper draws on several significant streams of literature: trade-in, trade-old-for-remanufactured, power structure, and government subsidy.
Firstly, this paper is related to the literature on trade-in in CLSC (Miao et al., 2017). Vanackere (1995) established three two-period closed-loop supply chain models with varying assumptions on consumers’ rationality, in which the monopolist set prices in the first period to divide the products holders and non-holders in the second-period market and set different prices for the two types of consumers in the second period. Ray et al. (2005) studied the optimal pricing and trade-in strategies for durable and remanufactured products. Genc and Giovanni (2017) modeled a two-period Stackelberg game to study the pricing strategy of trade-in and technology-dependent returns. And Quan et al. (2021) developed the two-period closed-loop supply chain models to study the effect of trade-in services on optimal prices, rebates, profits, and conditions of scenario preferences for each firm and supply chain. Based on consumers behavior, Y. Xiao (2017) developed two business models to investigate the optimal pricing and remanufacturing decisions for firms that adopt the exchange-old-for-new program, in which the used products are remanufactured by the manufacturer or retailer and then sold on the secondary market. Y. Huang (2018) established a closed-loop supply chain including a manufacturer and two competing retailers who implemented the trade-in program to explore which trade-in strategy is more beneficial to the closed-loop supply chain. X. X. Zhu et al. (2016) considered the trade-in strategy under duopoly competition. Zhao et al. (2021) considered product recycling quality options in the case of the trade-in and third-party remanufacturing competition. K. Y. Cao et al. (2018) explored the manufacturer’s strategies when third-party recycling competed with the manufacturer’s trade-in service. Z. W. Feng et al. (2021) developed closed-loop supply chain game models consisting of a manufacturer and two independent manufacturers to investigate the optimal trade-on strategy. Some literature also considered the pricing, demand, and trade-in strategies of the dual-channel closed-loop supply chain (L. Feng et al., 2018; K. Y. Cao et al., 2019; L. Xiao et al., 2020, 2022; K. Cao et al., 2018). Based on the different carbon tax policies, Z. J. Yang et al. (2021) established two trade-in models to explore its environmental impact. This study can provide a reference for managers to promote the development of remanufacturing through a trade-in strategy and carbon tax policy. Similarly, Dou and Choi (2021) developed a manufacturer recycling model and a retailer recycling model to explore whether trade-in and green technology are beneficial to the environment. Vedantam et al. (2021) studied trade-in and resale programs in the P2P resale market to explore the profitability and environmental impacts of the resale market. And Li et al. (2019) considered an original equipment manufacturer that implemented a trade-in program to improve sales and recycle used products. These used products were remanufactured and then resale to the second-hand market. Agrawal et al. (2016) examined when and how OEMs offered trade-in rebates to recycle the used products to achieve better price discrimination and diminish competition from third-party remanufacturers. Y. B. Xiao et al. (2020) proposed joint and dynamic decisions on the new product’s selling price and the trade-in price to study the impact of the manufacturer’s production capacity on product sales and trade-in program. The studies on trade-in in the above literature mainly focus on the optimal pricing, trade-in rebate, demand, and profit strategies when enterprises implement the trade-in programs. Little literature also studies the optimal trade-in strategies under duopoly competition environment, retailer competition environment, or third-party competition environment. Some scholars have also explored the impacts of second-hand market and remanufacturing on trade-in strategies.
Subsequently, we continue to consider the literature related to trade-old-for-remanufactured. X. Zhu and Wang (2018) investigated the optimal pricing strategies of a hybrid trade old for the new and remanufactured products supply chain. Han et al. (2017) developed three models to investigate when and how companies should offer the trade-old-for-remanufactured program to benefit businesses, consumers, and the environment. Based on double reference parameters (reference price effect and reference quality effect), P. Ma et al. (2020) established five models and obtained equilibrium solutions to explore the influence of the double reference effect and government incentive on the pricing strategy, the manufacturer’s profit, and the consumer surplus. Z. J. Ma et al. (2017) studied the optimal pricing decisions for the coexistence of “trade-old-for-new” and “trade-old-for-remanufactured” programs and obtained the conditions when the firm should implement both TON and TOR programs. Taking consumer willingness to pay and product durability into consideration, Shu et al. (2018) developed a trade-old-for-remanufactured (TOR) model for a scenario of the carbon tax and government subsidies and obtained the optimal production and pricing decisions. Zhang et al. (2022) established four models to study the impact of e-commerce platforms’ extended warranty service on trade-old-for-new and trade-old-for-remanufactured strategies. Based on trade-old-for-remanufactured program, Meng et al. (2020) considered a three-way game closed-loop supply chain composed of an OEM, a third-party remanufacturer, and the government to study the government’s optimal consumption subsidy and its influence on the operation of the closed-loop supply chain. The above literature considers the enterprises’ production and pricing strategies when trade-in and trade-old-for-remanufactured programs coexist. There is also literature considering government involvement.
The third related research stream is the power structures in the closed-loop supply chain. Taking power structures into consideration, H. T. Chen et al. (2021), Gao et al. (2016), J. H. Ma et al. (2020), and Wan (2018) studied the pricing decisions in the closed-loop supply chain. Gong et al. (2019) developed six models to investigate the influence of different recycling modes and channel power structures on a closed-loop supply chain’s optimal decisions and performance. Zheng et al. (2017) considered a closed-loop supply chain consisting of a manufacturer, a retailer, and a collector to study the influence of forwarding channel competition and power structure on it. Under various channel power structures, Wang et al. (2015) developed several reward-penalty mechanisms for different closed-loop supply chains to investigate the responsibility sharing between the manufacturer and the collector and obtain the optimal reward-penalty mechanism for the government to motivate the industry’s recycling endeavor. Zheng et al. (2019) used a game-theoretic framework to study the manufacturer’s encroachment strategy and its impact on retailer and supply chain system performance under different power structures. Ranjbar et al. (2020) considered a three-level closed-loop supply chain, which included a manufacturer, a retailer, and a third-party collector, to evaluate optimal pricing and recycling decisions under channel leadership. Regarding the power structures in closed-loop supply chains, the existing literature has studied the pricing strategy of closed-loop supply chains under different power structures and the influence of power structures on optimal decision-making and supply chain performance of closed-loop supply chain. Some scholars also explored the influence of reward and punishment mechanisms on the performance of enterprises and supply chain systems based on the power structures.
Our paper also related to the government subsidy in the closed-loop supply chain. Guo et al. (2022) investigated the optimal pricing and subsidy decisions of the trade-old-for-new and trade-old-for-remanufactured programs and also studied the impacts of trade-old-for-new subsidies on firms, consumers, and society. Mondal and Giri (2021) set up a two-level green CLSC considering the government subsidy to study the impact of the government subsidy on optimal decisions and supply chain efficiency. Considering government subsidy, He et al. (2019) considered a dual-channel CLSC to study the manufacturer’s channel structures and pricing decisions and the government’s subsidy policy for competing new and remanufactured products. Gu et al. (2021) established a two-period battery secondary use CLSC model to explore the impact of the government subsidy on the secondary use of electric vehicles. Y. T. Huang and Liang (2021) developed three CLSC models of three recycling modes to investigate the influence of the government subsidy on channel members’ pricing decisions and recycling mode selection. Based on the consideration of government subsidies, the existing literature explores the optimal pricing decisions of enterprises when they implement trade-in or trade-in programs. Some literature considers the manufacturers’ pricing decisions and government subsidy policies under different power structures.
The existing literature either investigates the optimal decisions of the enterprises to implement the trade-in and trade-old-for-remanufactured programs or explores the optimal subsidy policies of the government for the trade-old-for-remanufactured program. And there is little literature on enterprise’ the trade-in and trade-old-for-remanufactured decision-making based on power structures and government subsidies. The contribution of our paper mainly has the following three points. First of all, previous literature aims to explore the optimal decisions of enterprises when trade-in and trade-old-for-remanufactured coexist. In contrast, we aim to explore the impact of trade-old-for-remanufactured on the optimal decision of enterprises under the premise that the trade-in program has already been implemented. Furthermore, while most of the previous literature used manufacturers as supply chain leaders to implement trade-in and trade-old-for-remanufactured decisions, this paper considers different power structures, introducing the case of the retailer as a leader and the manufacturer as the follower. Last but not least, there are few studies on trade-old-for-remanufactured subsidies in previous literature. This paper enriches this part based on existing literature (Table 1).
The Related Literature.

Model Formulation
Model Description
This paper considers a closed-loop supply chain consisting of a manufacturer and a retailer (Giri & Dey, 2019). The manufacturer produces new and remanufactured products (Qiao & Su, 2020), as we can see in Figure 1. There are two types of consumers in the market: primary consumers who do not have any old products and replacement consumers who already own used products. Based on the power structure, we consider four models of the closed-loop supply chain. In Model M and Model TM, the manufacturer acts as a leader in the Stackelberg game, and the retailer acts as a follower. The manufacturer acts as a follower, and the retailer is the leader in Model R and Model TR.

The models: (a) Model M, (b) Model R, (c) Model TM, and (d) Model TR.
The manufacturer sells the new and remanufactured products to the retailer at the price of
Model Assumptions
The related assumptions are proposed as follows:
Assumption 1: The market size in a period is normalized to one. Therefore, the market size is usually defined as 1 (Q = 1) to simplify the calculation. The market has two types of consumers:
Assumption 2: The new and remanufactured products in this paper have a valuable life of the period. Each customer uses at most one unit in each period.
Assumption 3: We assume
Assumption 4: The consumers’ sensitivity towards the quality of the new products is
Assumption 5: Compared to the new products, the depreciation rate of used products is
Assumption 6: We assume that the salvage value of the used products is
Assumption 7: The trade-in and the trade-old-for-remanufactured program have the same price rebate
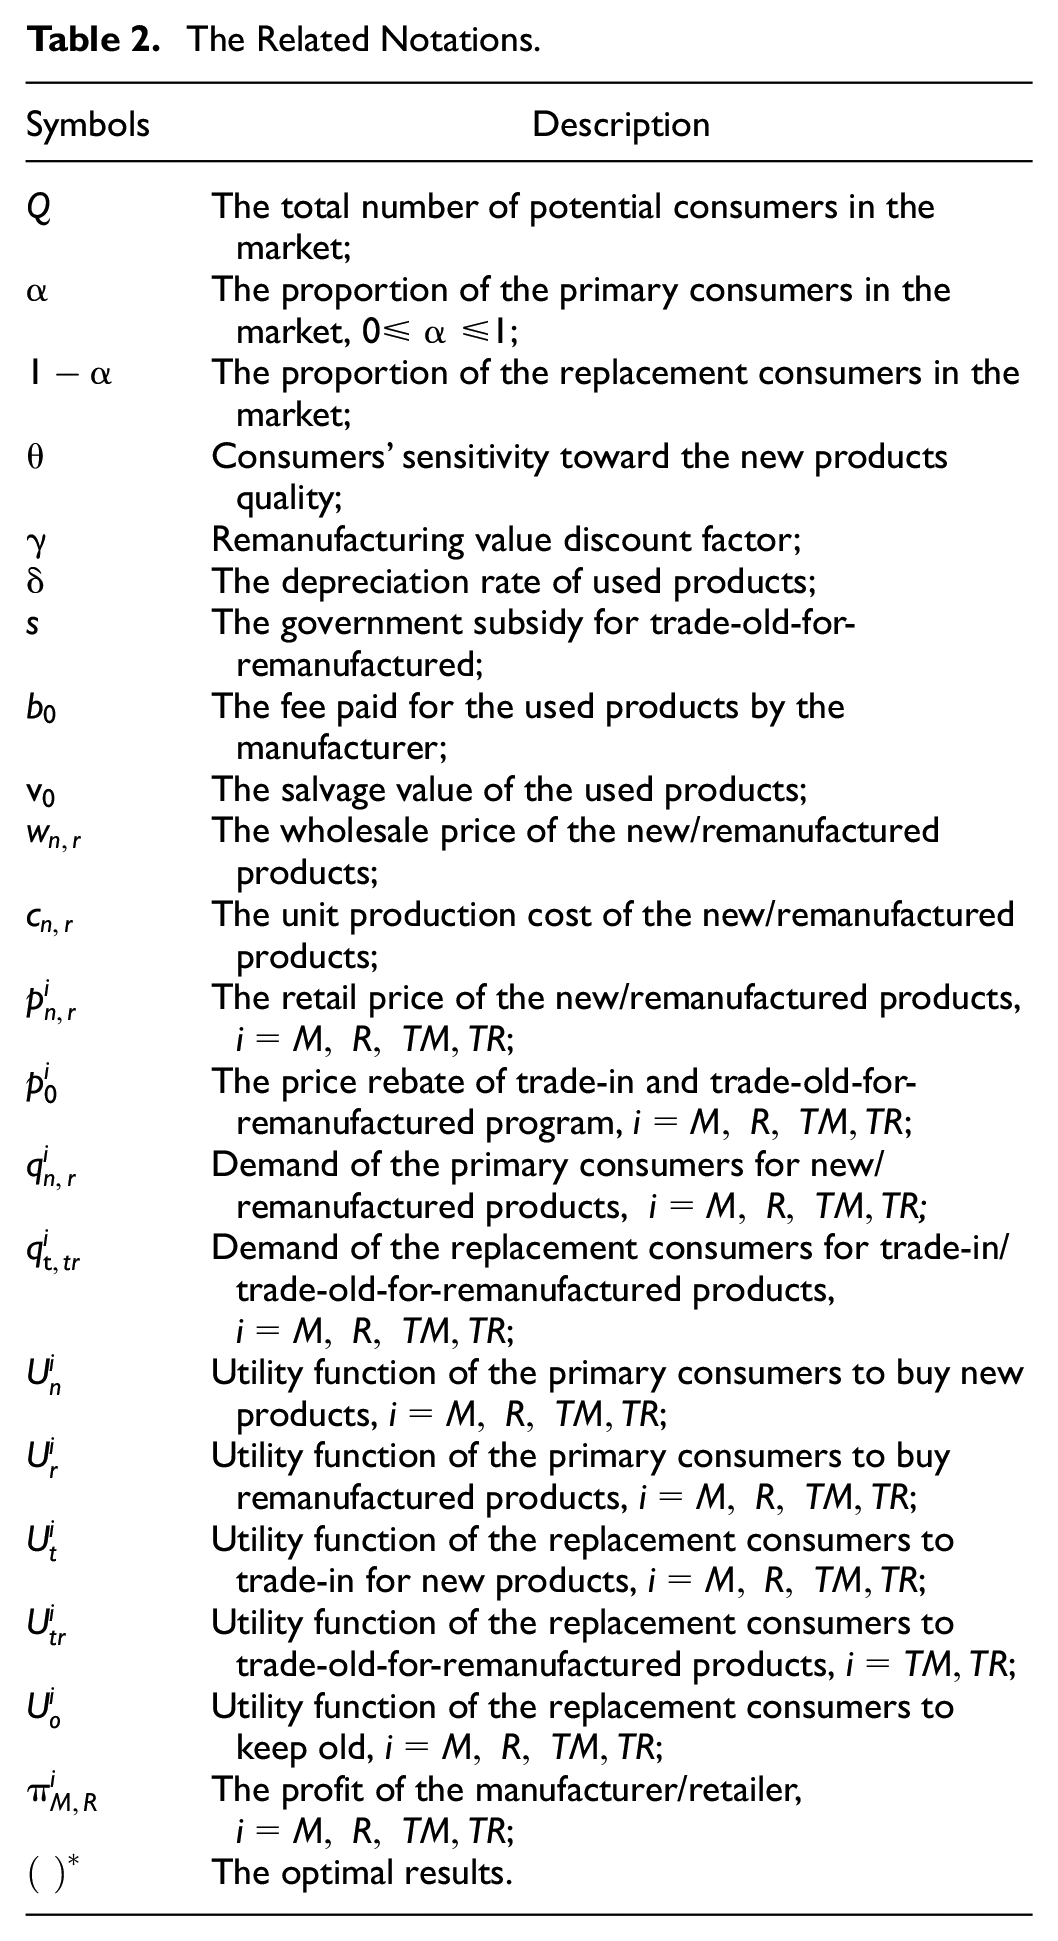
The related symbols are shown in Table 2.
The Related Notations.
The Model Development
In this section, we develop four different closed-loop supply chain models, namely, manufacturer-led model with trade-in (Model M), retailer-led model with trade-in (Model R), manufacturer-led mode with trade-in and trade-old-for-remanufactured (Model TM), and retailer-led model with trade-in and trade-old-for-remanufactured (Model TR). The manufacturer and the retailer aim to maximize their profit. Based on consumer choice behavior, the Stackelberg game, and profit maximization, we investigate the optimal decisions of the four models.
Consumer behavior theory mainly deduces market demand from consumer choice behavior, and is also a method to model individual choice behavior. The consumers’ choice behavior is based on utility, that is, the degree of satisfaction consumers feel when consuming products. When the consumers’ utility reaches the maximum, the consumers will make the corresponding purchase decisions. The main idea of the Stackelberg Game is that both sides choose their strategies according to the possible strategies of the other side to ensure the maximization of their interests under the strategies of the other side. In this game model, the party that makes the decisions first is called the leader, and the other party makes the decisions according to the leader’ decision, which is called the follower. The leader then adjusts his decisions based on the decision of his followers. Profit maximization refers to the profit increment maximization after marginal revenue minus marginal cost, that is, the positive profit increment maximization. The profit function is maximized by determining whether its Hesse matrix is negative definite. Moreover, the Hesse matrix is obtained by taking the second-order partial derivative of the profit function.
Model M: Manufacturer-Led Model with Trade-In
In this model, the manufacturer acts as a leader in the closed-loop supply chain, and the retailer is a follower. The manufacturer sells the new and remanufactured products to the retailer at the price of
For primary consumers, they have three choices: purchase new or remanufactured products, or leave empty-handed. Therefore, the net utility of primary consumers when they buy new and remanufactured product are
Similarly, the replacement consumers have two choices: trade-in for a new product or continue using the old product. The net utility of replacement consumers when they trade-in for a new product and continue using the old product are
On the one hand, the primary consumer will purchase the new products when
The profit-maximizing function of the manufacturer is:

The profit-maximizing function of the retailer can be expressed as follows:


Proof is shown in Appendix.
According to the above decisions, we find that
Model R: Retailer-Led Model with Trade-In
In this case, the manufacturer produces the new and remanufactured products and acts as a follower in the closed-loop supply chain. The retailer acts as a leader and implements a trade-in program dependently. The retailer determines the retail price, trade-in rebate, and the fee paid for the used products by the manufacturer. The manufacturer then determines the wholesale price of new and remanufactured products based on the retailer’s pricing. The demand functions are same as Model M, that is,
The profit-maximizing function of the manufacturer is:

The profit-maximizing function of the retailer can be expressed as follows:


Proof is shown in Appendix.
Proposition 2 indicates that
Model TM: Manufacturer-Led Model with Trade-In and Trade-Old-for-Remanufactured
The manufacturer, who is responsible for selling the new and remanufactured products and implementing trade-in and trade-old-for-remanufactured programs, acts as the leader of the closed-loop supply chain. The retailer acts as a follower to sell the new and remanufactured products to consumers.
For primary consumers, they also have three choices and the demand functions are similar to Model M, that is,
In conclusion, the primary will purchase the new products when
The profit-maximizing function of the manufacturer is:

The profit-maximizing function of the retailer can be expressed as follows:


Proof is shown in Appendix.
According to Proposition 3, we can know that
Model TR: Retailer-Led Model with Trade-In and Trade-Old-for-Remanufactured
In this case, the retailer acts as a leader and simultaneously implements trade-in and trade-old-for-remanufactured programs. The manufacturer produces the new and remanufactured products and acts as a follower. The retailer first determines the retail price of the new and remanufactured products, trade-in and trade-old-for-remanufactured rebate, and the manufacturer’s fee for the used products. The manufacturer then determines the wholesale price of new and remanufactured products based on the retailer’s pricing. The demand functions are same as Model TM, that is,
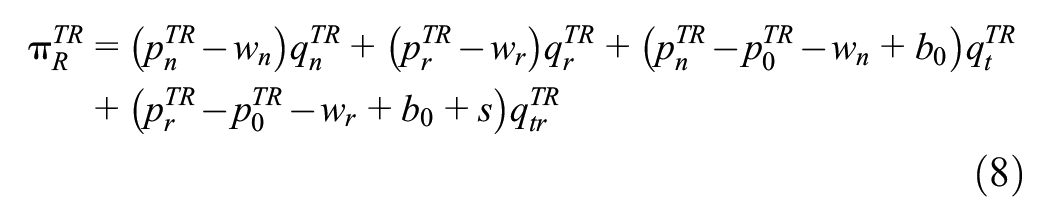
The profit-maximizing function of the manufacturer is:

The profit-maximizing function of the retailer can be expressed as follows:


Proof is shown in Appendix.
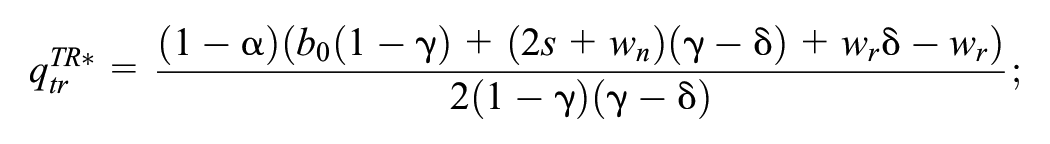
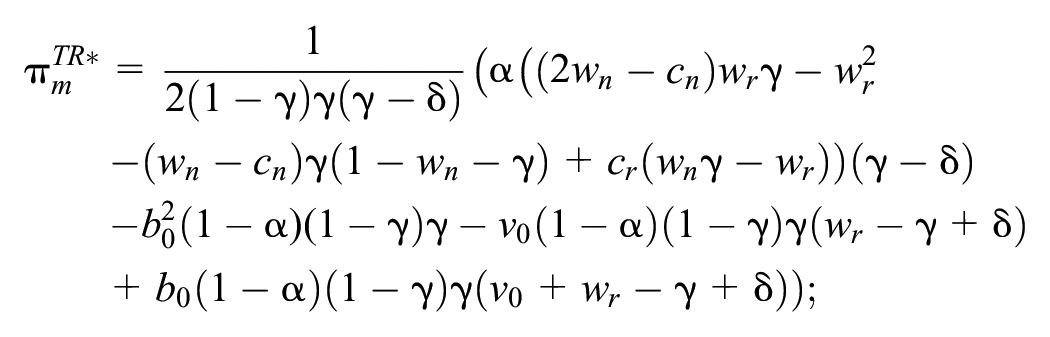
Based on proposition 4, we can obtain that
The Analysis and Comparison
In this section, we will compare the optimal decisions of the four models to investigate the impact of the trade-in and trade-old-for-remanufactured programs in the closed-loop supply chain under different power structures and government subsidies.
The Comparison of Optimal Prices


Proof is shown in Appendix.
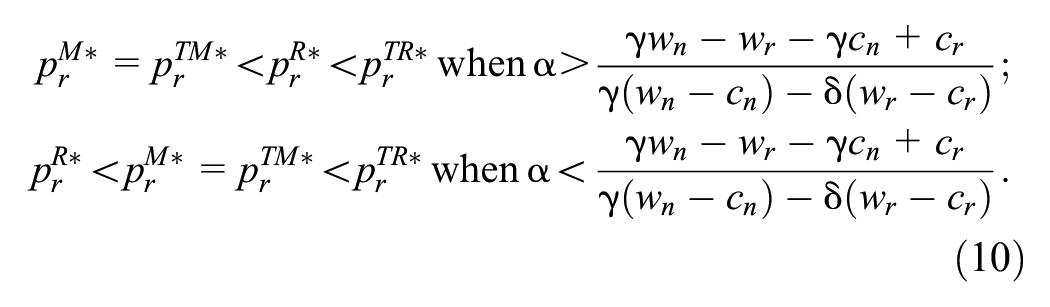
Corollary 1 indicates the ranks of the retail price and the rebate of each model. As the leader of the closed-loop supply chain, the manufacturer will set the same retail price for the new and remanufactured products, whether there is a trade-old-for-remanufactured program or not. And the retail price of the new products is higher in the retailer-led model with trade-in and trade-old-for-remanufactured. Meanwhile, the retail price of remanufactured products in Model TR is also the highest among the four models. However, when the retailer acts as a leader, and there is no trade-old-for-remanufactured program in the market, the retail price of remanufactured products is related to the proportion of primary consumers in the market. When
The Comparison of Optimal Demands


Proof is shown in Appendix.
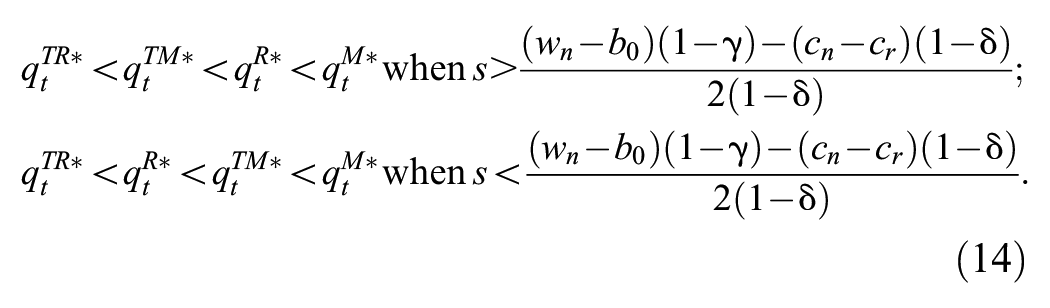
Corollary 2 indicates the ranks of the optimal demands of each model. The primary consumers’ demand for the new and remanufactured products are the same in the manufacturer-led model with trade-in and trade-old-for-remanufactured (Model TM) and the manufacturer-led model with trade-in (Model M). In the retailer-led model with trade-in and trade-old-for-remanufactured (Model TR), the primary consumers’ demand for new products is the lowest but demand for remanufactured products is the highest. In contrast to other models, the primary consumers’ demand for new products in the retailer-led model with trade-in (Model R) is related to the proportion of primary consumers in the market. When

Proof is shown in Appendix.
According to Corollary 3, we can know that the replacement consumers’ demand for the trade-in program in the four models is related to the government subsidy for the trade-old-for-remanufactured program. The demand for the trade-in program in the manufacturer-led model with trade-in (Model M) is the highest among the four models. However, the demand for the trade-in program in the retailer-led model with trade-in and trade-old-for-remanufactured (Model TR) is the lowest among the four models. When the government subsidies meet a certain value (such as s
Numerical Analysis
In this section, we further provide some numerical experiments to verify the results concluded before. We analyze the changes of the manufacturer and retailer’s profits with the proportion of the primary consumers in the market and the depreciation rate of used products in four models. We also compare the optimal price of the manufacturer and retailer, the optimal demand of primary and replacement consumers, and the profits of supply chain members in the four models. In particular, we also investigate the impact of government subsidy intensity on the manufacturer’s profit in Model TM and the retailer’s profit in Model TR. We assume that
The Changes of the Optimal Profits with
and
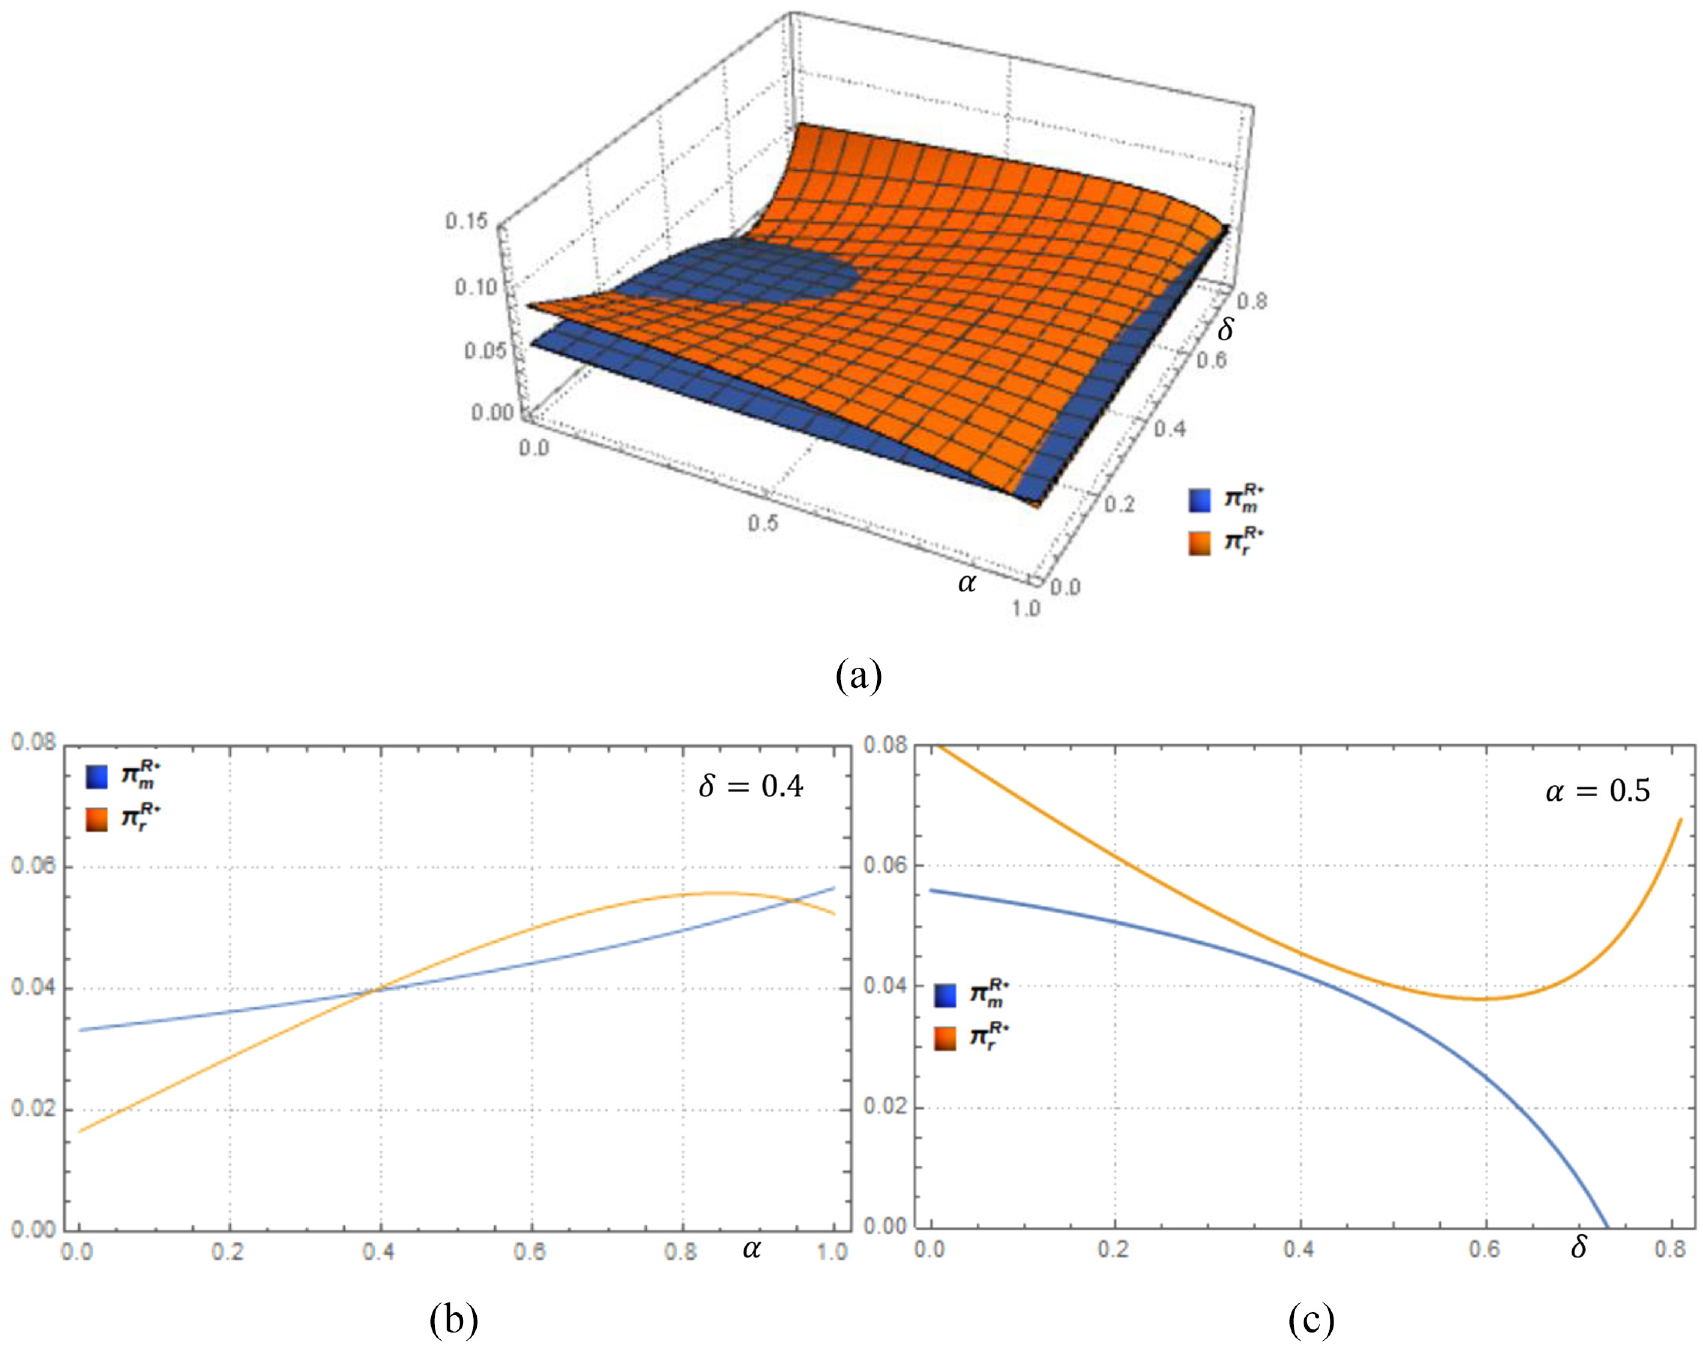
In this subsection, we investigate the changes of manufacturer and retailer’s profits with the proportion of the primary consumers in the market and the depreciation rate of used products in four models, which are respectively shown in Figures 1 to 4. In order to visually describe how the proportion of primary consumers in the market and the depreciation rate of used products affect the profits, we set

The changes of profits in Model M. (a) The profits in Model M with respect to a and d; (b) The profits in Model M with respect to a; (c) The profits in Model M with respect to d.
The changes of profits in Model R. (a) The profits in Model R with respect to a and d; (b) The profits in Model R with respect to a; (c) The profits in Model R with respect to d.
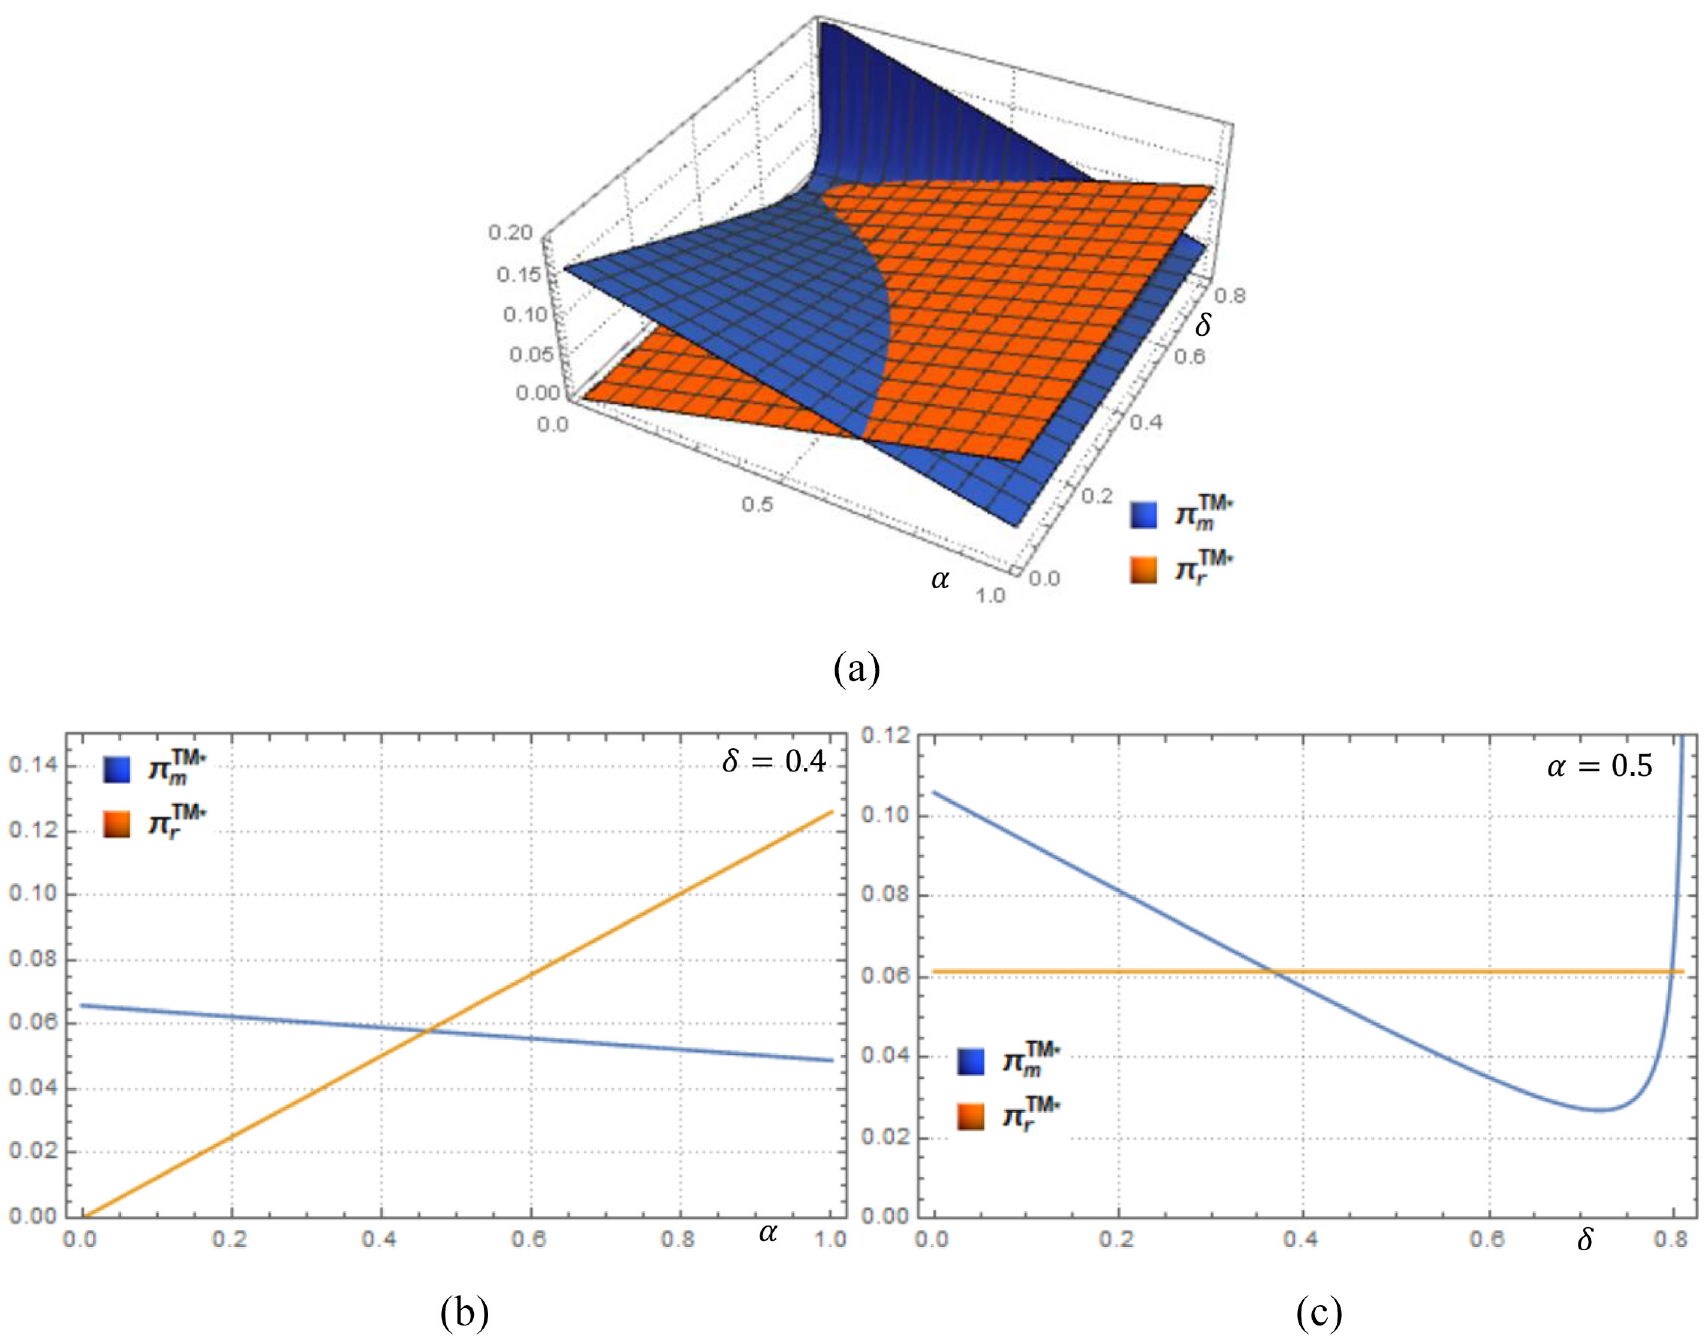
The changes of profits in Model TM. (a) The profits in Model TM with respect to a and d; (b) The profits in Model TM with respect to a; (c) The profits in Model TM with respect to d.
Figure 2 shows the changes of the manufacturer and retailer’s profits in model M. The manufacturer’s profit will decrease with the proportion of consumers in the market when the depreciation rate of used products is low. A low depreciation rate of used products means that the products are durable, and the demand for new and remanufactured products may decrease even though there are more primary consumers in the market. If the depreciation rate of used products is high, the manufacturer’s profit will increase with the proportion of primary consumers in the market. That is, the product durability is poor, and the elasticity of consumer demand is large when the depreciation rate of used products is large. Therefore, despite the decrease in consumer demand, the increase in the proportion of primary consumers in the market will also stimulate a slight increase in the manufacturer’s profit. Based on the above analysis, we can know that the manufacturer’s profit will decrease with the depreciation rate of used products when the proportion of primary consumers in the market is constant. As for the profit of the retailer, it is increasing with the proportion of primary consumers in the market. And the retailer’s profit is independent of the depreciation rate of used products. According to Figures 2b and c, we can obtain that the manufacturer makes more profit than the retailer when there are few primary consumers in the market or when the depreciation rate of used products is low, which means the trade-in program and durable products are more beneficial to the manufacturer.
According to Figure 3, we can see that the retailer’s profit is greater than that of the manufacturer in most cases of the retailer-led model with trade-in. Only when the products are of moderate durability, and there are few consumers in the market, or there are enough primary consumers in the market, will the manufacturer make more profit than the retailer. Both the manufacturer and retailer’s profits increase with the proportion of primary consumers in the market. In addition, the retailer’s profit increases first and then decreases with the depreciation rate of used products, while the manufacturer’s profit decreases with the depreciation rate of used products. Based on the above analysis, we can find that the retailer-led model with trade-in is more retailer-friendly. Nevertheless, the manufacturer may need more satisfaction from producing and trading products.
Figure 4 shows the changes of the manufacturer and retailer’s profits in Model TM. The manufacturer’s profit is increasing with the proportion of primary consumers in the market when the depreciation rate of used products is small. If the depreciation rate of used products is larger, the manufacturer’s profit will increase with the proportion of primary consumers in the market. Furthermore, the profit of the retailer is constantly increasing with the proportion of primary consumers in the market. And we can find that the profit of the retailer is higher than the manufacturer when there are more primary consumers in the market. That is, the more primary consumers there are, the better for the retailer. Therefore, the manufacturer should take advantage of the trade-in and trade-old-for-remanufactured programs when there is a high proportion of replacement consumers in the market. According to Figure 4c, we can know that the profit of the retailer has no relationship with the depreciation rate of used products, and the function of the retailer’s profit also shows this relationship. As for the profit of the manufacturer, it is decreasing with the depreciation rate of used products. However, the manufacturer’s profit will increase with the depreciation rate of used products as the depreciation rate of used products approaches the remanufacturing value discount factor, which indicates that the sales of remanufactured products and the trade-old-for-remanufactured program can compensate for the disadvantages created by the depreciation rate of used products.
According to Figure 5, we can know that the retailer is more profitable than the manufacturer in most cases. Suppose the depreciation rate of used products is low. In that case, the retailer’s profit is decreasing with the depreciation rate of used products and it will increase when the depreciation rate of used products is larger than a threshold. The remanufacturer’s profit is continuously increasing with the proportion of primary consumers in the market. This means that although the products are durable, it does not stimulate the demand of consumers. Figure 5c shows that the profits of the manufacturer and retailer will decrease with the depreciation rate of used products. In comparison, the retailer’s profit will increase with the depreciation rate of used products when the depreciation rate of used products approaches the remanufacturing value discount factor. Compared to the retailer-led model with trade-in, the retailer in the retailer-led model with trade-in and trade-old-for-remanufactured is in the driver’s seat and can make a higher profit due to the government’s subsidy for the trade-old-for-remanufactured program.

The changes of profits in Model TR. (a) The profits in Model TR with respect to a and d; (b) The profits in Model TR with respect to a; (c) The profits in Model TR with respect to d.
Analysis of the Optimal Decisions
In this subsection, we compare the optimal decisions in each model through numerical analysis. The changes of optimal prices, demands and profits are shown in Figures 6 to 8, respectively. We set
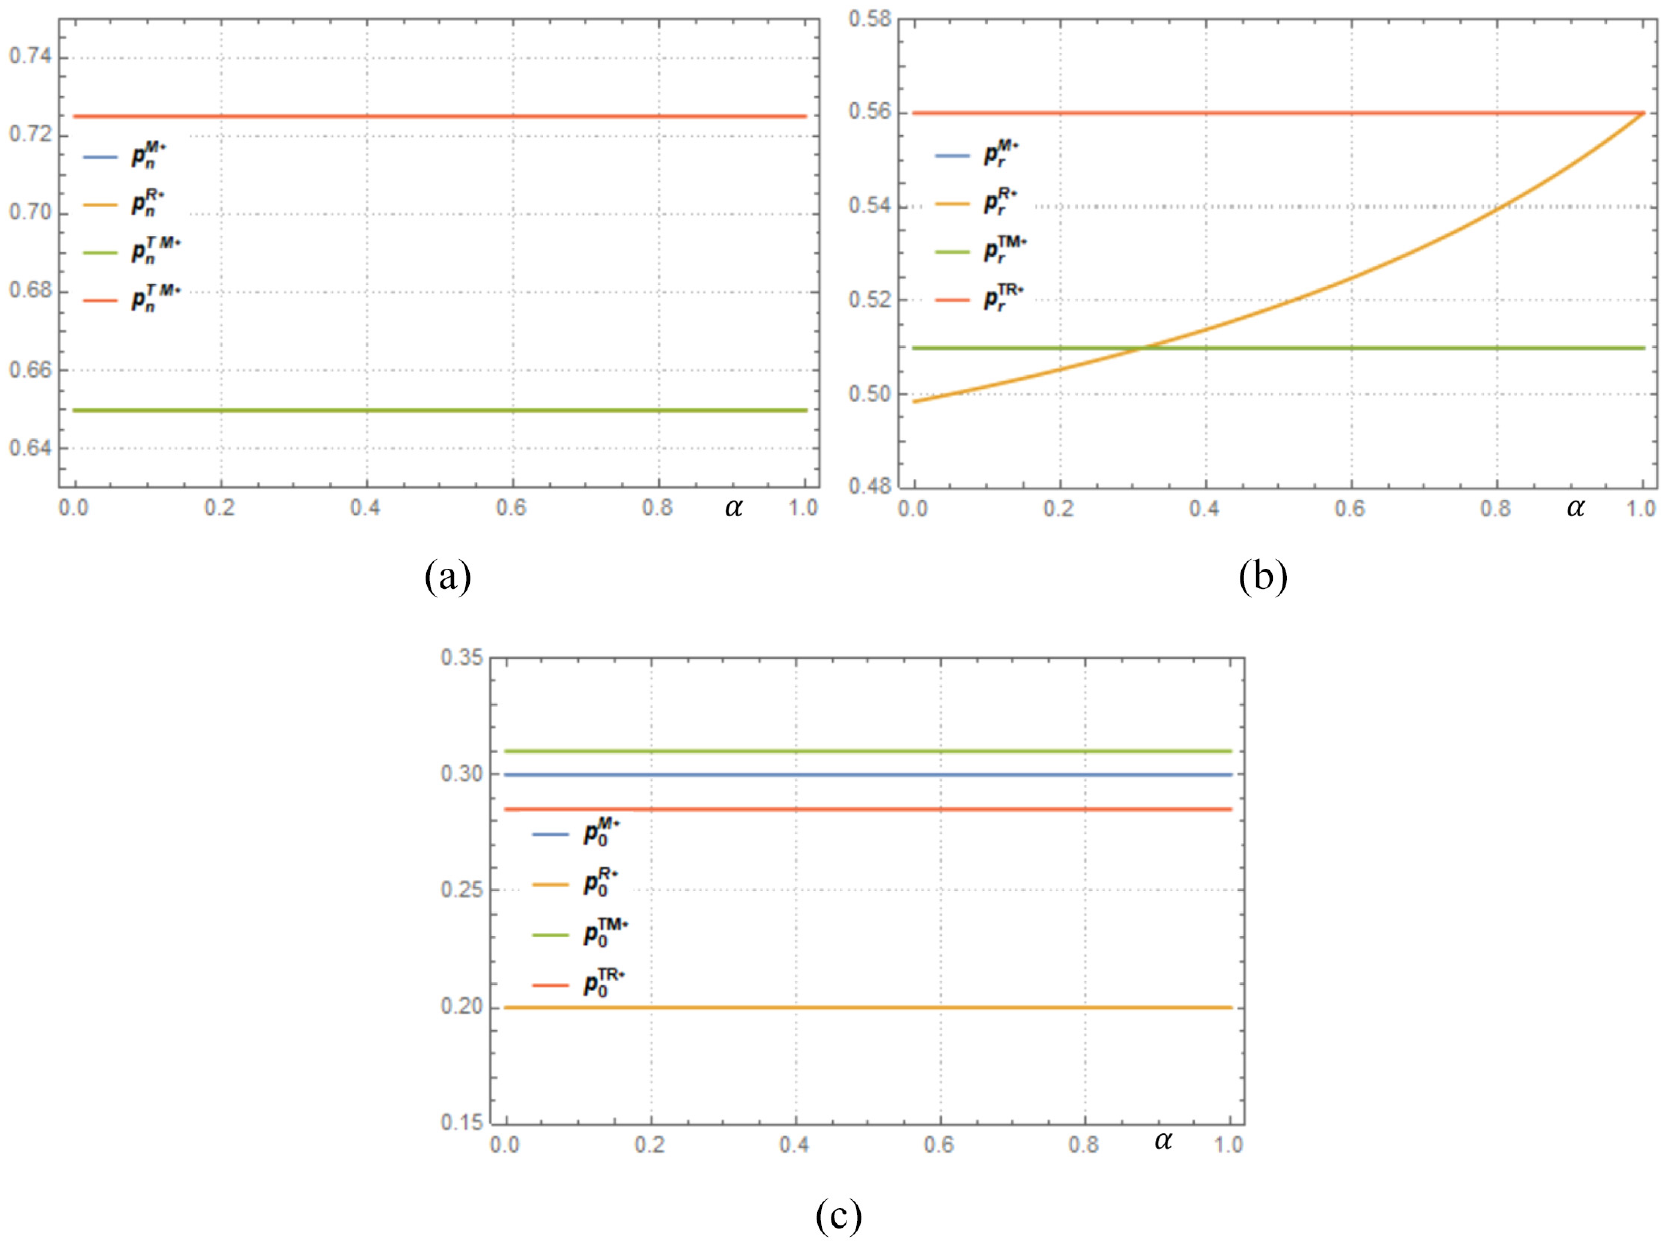
The changes of optimal prices. (a) The optimal retail prices of new products with respect to a; (b) The optimal retail prices of remanufactured products with respect to a; (c) The optimal price rebates with respect to a.

The changes of optimal demands. (a) The optimal demands of new products with respect to a; (b) The optimal demands of remanufactured products with respect to a; (c) The optimal demands for trade-in products with respect to a; (d) The optimal demands for trade-old-for-remanufactured products with respect to a.
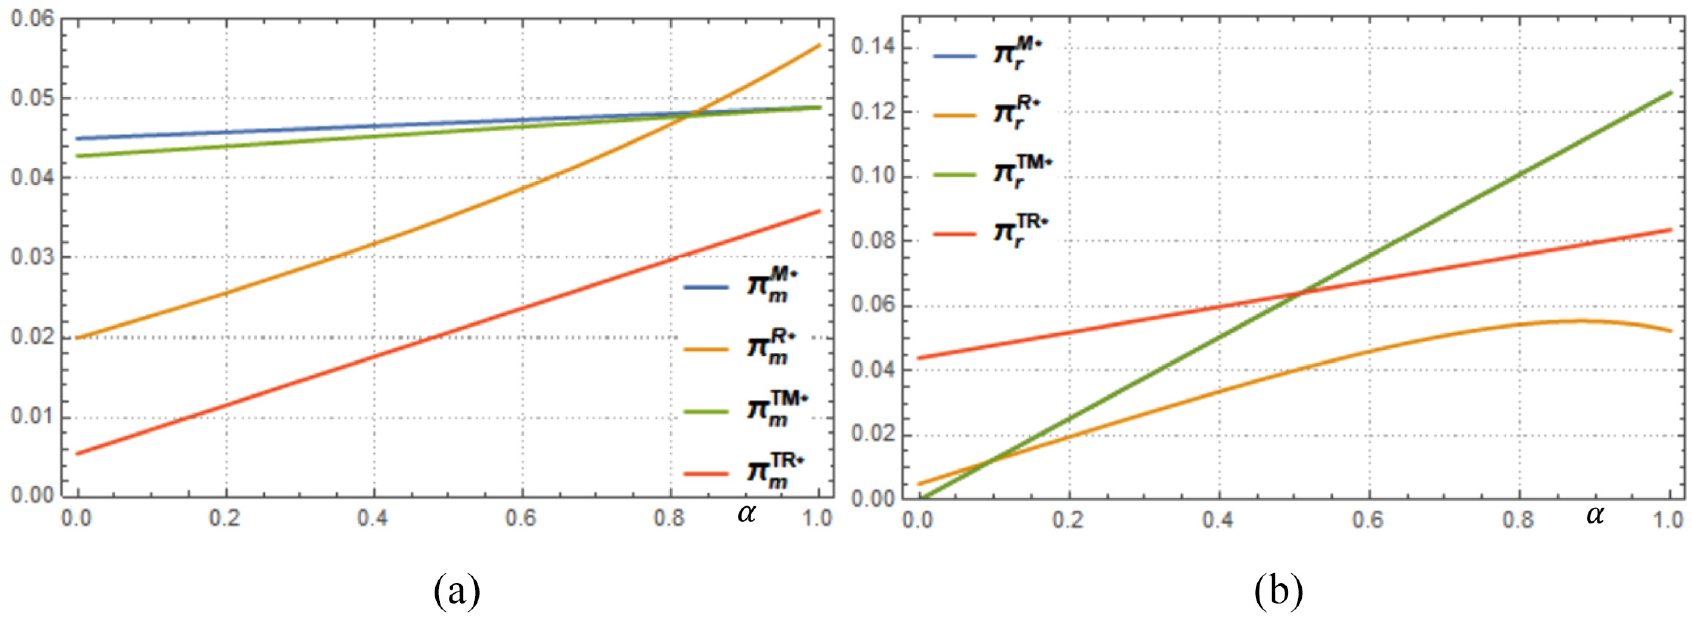
The changes of optimal profits. (a) The optimal profits of manufacturer with respect to a; (b) The optimal profits of retailer with respect to a.
Figure 6 shows that except for
Figure 7 shows the changes of the optimal demands in the four models. The demand for new products in Model TR is the lowest since
According to Figure 8, we can see that the manufacturer’s profits of all the models are increasing with the proportion of primary consumers in the market. The profits of the manufacturer-led models are generally higher than the retailer-led models. However, the manufacturer’s profit in the retailer-led model with trade-in will be the highest since the high demand for new products. And there is
The Impact of Government Subsidy
In this subsection, we explore the impact of government subsidy on the trade-old-for-remanufactured program of the enterprises through numerical analysis. Since the government only subsidizes the trade-in program, we explore the changes of the manufacturer’s profit in Model TM and the retailer’s profit in Model TR with the government subsidy. We set
Social Welfare
We have known that the government subsidizes the trade-old-for-remanufactured program, so we investigate the social welfare of the four models with numerical analysis to explore the role of the government in the closed-loop supply chain. Social welfare consists of the profit of the manufacturer, consumer surplus, and environmental impact.
First, we investigate the function of the consumer surplus based on H. Chen et al. (2020). The consumer surplus includes the primary consumers’ willingness to purchase the new and remanufactured products, and the replacement consumers’ willingness to participate in trade-in and trade-old-for-remanufactured programs. We denote


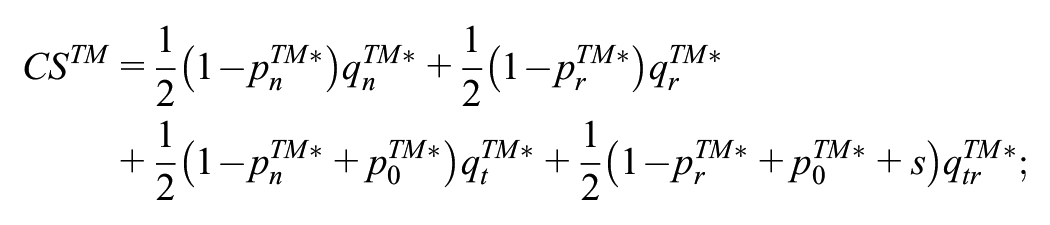

The first term indicates the consumer surplus of the new products; the second term represents the consumer surplus of the remanufactured products; the third term represents the consumer surplus of the trade-in program; the last term indicates the consumer surplus of the trade-old-for-remanufactured program.
And then, we will explore the environmental impact of the production of two products in the four models. We denote


The first term represents the environmental impact of the new products and the second term indicates the environmental impact of the remanufactured products.
Based on above analysis, we can obtain the functions of the social welfare in the four models. We denote


The changes of social welfare and environmental impact are shown in Figures 9 and 10, respectively. We set parameters:

The impact of government subsidy.

The changes of environmental impact. (a) The environment impact with respect to a and d; (b) The environment impact with respect to a; (c) The environment impact with respect to d.
Figure 10 shows the environmental impact changes of the four models. First, the environmental impact of retailer-led models is increasing with the proportion of primary consumers in the market. Notably, the environmental impact in the retailer-led model with trade-in is larger and increases faster than in the retailer-led model with trade-in and trade-old-for-remanufactured. Furthermore, the environmental impact of the manufacturer-led model with trade-in and trade-old-for-remanufactured is increasing with the proportion of primary consumers in the market. But the environmental impact of the manufacturer-led model with trade-in is decreasing with the proportion of primary consumers in the market but not by much. The environmental impact of manufacturer-led models is larger than retailer-led models when the proportion of primary consumers is less than a certain threshold. And if there are many primary consumers in the market, the environmental impact of the retailer-led model with trade-in will be the largest among the four models. In the retailer-led model with trade-in and trade-old-for-remanufactured, the impact on the environment does not increase very much or quickly because of the government subsidy. On the other hand, as the depreciation rate of used products increases, the environmental impact of all four models will decrease. That is, the higher the depreciation rate of used products, the worse the products’ durability and the greater the products’ demand elasticity. The consumers’ demand for various products is reduced, so the environmental impact is decreased naturally.
According to Figure 11, we can know that the social welfare of the two manufacturer-led models is generally higher, and that of the two retailer-led models is lower. This further indicates that it is more beneficial to social welfare when the manufacturer acts as the leader of the closed-loop supply chain. On the one hand, as the proportion of primary consumers in the market increases, the social welfare of the retailer-led models will increase, but the social welfare of the manufacturer-led models will decrease. Based on Figure 11b, we find that the social welfare in the manufacturer-led model with trade-in and trade-old-for-remanufactured is larger, indicating that government subsidy for the trade-old-for-remanufactured program can indeed stimulate an increase in social welfare. As for the two retailer-led models, the social welfare of the retailer-led model with trade-in is smaller than the retailer-led model with trade-in and trade-old-for-remanufactured. The environmental impact of Model R will increase and increase faster and faster when there are many primary consumers in the market. Therefore, the social welfare of Model R will decrease when the proportion of primary consumers in the market reaches a certain threshold. On the other hand, the social welfare of the four models will decrease with the increase of the depreciation rate of used products. Based on Figure 11c, we have known that the poor durability of old products will reduce the consumers’ demand, so the impact on the environment will be smaller. But the reduction in consumers’ demand will also reduce the manufacturer’s profit, and the reduction in the manufacturer’s profits is greater than the reduction in the environmental impact. Therefore, the social welfare of all four models decreases with the depreciation rate of used products.

The changes of social welfare. (a) The social welfare with respect to a and d; (b) The social welfare with respect to a; (c) The social welfare with respect to d.
Discussion
This paper fills the gaps in the existing literature in the fields of different power structures, trade-in and trade-old-for-remanufactured competition, and government subsidies for trade-old-for-remanufactured. Based on previous literature, we also consider the impact of government-subsidized trade-ins on social welfare and the environment. There are many studies on trade-ins in the existing literature. Some scholars also consider trade-in and trade-in into the closed-loop supply chain but do not involve the master-slave relationship between manufacturers and retailers. This article takes into account both manufacturers and retailers as leaders, respectively. It is found that the manufacturer-led model is more beneficial to manufacturers and retailers under certain conditions, which is not involved in other literature. Moreover, when considering government subsidies, some literature will consider the government’s subsidy for both trade-in and trade-old-for-remanufactured programs. But in reality, consumers’ acceptance of remanufactured products and the trade-old-for-remanufactured program is much lower than that of new products and the trade-in program. In this paper, the government only subsidizes the trade-old-for-remanufactured program, and this paper finds that whether the manufacturer and retailer obtain advantage from their dominant model depends on how much the degree of government subsidy.
Theoretical Contributions
This paper makes theoretical contributions to the trade-in and trade-old-for-remanufactured strategies under different power structures. The existing literature has conducted a detailed analysis of the optimal pricing strategies of the trade-in and trade-old-for-remanufactured programs, and there are also studies on the impact of government trade-in subsidies on pricing strategies. Most of the literature mainly focuses on the manufacturer-led situation and does not consider the complex channel structures. Therefore, based on previous theoretical studies, this paper explores the impact of the implementation of the trade-old-for-remanufactured strategy under different power structures (in which the government subsidizes the trade-old-for-remanufactured) on the relevant strategies of enterprises when the trade-in strategy already exists. This paper makes an extended analysis on the fields of trade-old-for-remanufactured and channel structures.
Practical Implications
Our main conclusions can incentive the managers of enterprises to make decisions for trade-in and trade-old-for-remanufactured programs in practice. This paper can provide references for the decision-making of different power structures of enterprise managers and government subsidy policy. When the manufacturer acts as a leader of the closed-loop supply chain, he can adopt the low products retail price and high rebate to stimulate the replacement consumers’ demand. In reality, the retailer may set a higher retail price because he is closer to consumers when the retailer is the leader of the closed-loop supply chain. Therefore, it is necessary for the retailer to lower his retail price and increase the rebate to attract consumers. Moreover, regardless of whether the manufacturer or the retailer acts as the leader, implementing both trade-in and trade-old-for-remanufactured programs can be used to bring higher profit to policymakers than just implementing the trade-in program. The government can regulate the social welfare and the profits of supply chain members by controlling the subsidy intensity for the trade-old-for-remanufactured program. And governments also play a role in balancing the power of the manufacturer and retailer.
Limitations and Future Research
Our investigation also has some limitations and can be further extended in several directions. In fact, the quality of the products will degrade over time and with consumers’ use. Therefore, it is of great value to investigate the quality of old products for trade-in and trade-old-for-remanufactured strategy selection of enterprises. Future research may consider the influence of used products quality on the trade-in and trade-old-for-remanufactured program. Furthermore, this paper only considers the single-period model, but sometimes a simple single-period model cannot reflect the complex supply chain environment. In the future, we can consider the influence of the two-period or multi-period model on the pricing strategy, and the trade-in and trade-old-for-remanufactured strategy. Last but not least, this paper does not consider the influence of third parties or secondary markets. In reality, enterprises often face competition from the third party and the encroachment of the second-hand market. Future research can explore enterprises’ trade-in and trade-old-for-remanufactured strategies under third-party competition conditions and investigate the impact of second-hand market encroachment on corporate profits.
Conclusion
This paper develops a closed-loop supply chain consisting of a manufacturer and a retailer, in which the manufacturer and the retailer act as the leader of the CLSC to implement a trade-in program or both the trade-in and trade-old-for-remanufactured programs, respectively. Our paper can provide guidance on how different power structures affect the profits of supply chain members and what subsidy policies the government can provide for trade-old-for-remanufactured programs.
Our key conclusions can be summarized as follows.
(1) The retail prices of new and remanufactured products are highest when the retailer dominates TON and TOR programs. The manufacturer-led models have lower retailer prices and higher price rebates, which means that it is likely to be more beneficial to consumers. And the price rebate in Model TM is higher since the government will subsidize the TOR program.
(2) No matter how the proportion of primary consumers changes in the market, , the primary consumers have the lowest demand for new products and the highest demand for remanufactured products in model TR. But the demand of primary consumers for new and remanufactured products in other models is related to the proportion of primary and replacement consumers in the market. And the manufacturer-led model can stimulate the replacement consumers’ demand for trade-in and trade-old-for-remanufactured programs.
(3) In Model TM, the sales of remanufactured products and the trade-old-for-remanufactured program can compensate for the disadvantages created by the depreciation rate of used products. And the manufacturer-led models are more beneficial to both the manufacturer and retailer when there are slightly more primary consumers than replacement consumers in the market.
(4) Compared to Model R, the retailer in Model TR can make a higher profit due to the government’s subsidy for the trade-old-for-remanufactured program. The manufacturer’s profit in Model TM with lower remanufactured products retail price and the higher price rebate will decrease when the government subsidy is small. And the manufacturer in Model TM has an advantage when the government subsidy is less than a certain threshold. Otherwise, the retailer in Model TR can get more profit.
(5) The environmental impact of manufacturer-led models is larger than retailer-led models when the proportion of primary consumers is less than a certain threshold. And if there are many primary consumers in the market, the environmental impact in Model R will be the largest in the four models.
(6) As the increase of the depreciation rate of used products, the environmental impact of all four models will decrease. Moreover, as the proportion of primary consumers in the market increases, the social welfare of the retailer-led models will increase, but the social welfare of the manufacturer-led models will decrease. And the government subsidy for trade-old-for-remanufactured program can indeed stimulate an increase in social welfare. The social welfare of the four models will decrease with the increase of the depreciation rate of used products.
Footnotes
Appendix A: Proof of Proposition 1
According to formula (1) and (2), we can obtain that
Combining
Appendix B: Proof of Corollary 1
We can easily know that
We can obtain that
The proof of Propositions 2 to 4 and Corollary 2 and 3 is similar to Appendix B.
Acknowledgements
The authors are sincerely thankful to the esteemed reviewers for their comments and suggestions based on which the manuscript has been improved.
Author Contributions
Conceptualization, K. L. and Q. L.; data curation, K. L., J. L., and Y. L.; formal analysis, K. L.; investigation, Q. L.; methodology, K. L.; project administration, K. L. and Q. L.; resources, Q. L., J. L., and Y. L.; software, K. L., J. L., and Y. L.; supervision, Q. L.; visualization, K. L., J. L., and Y. L.; writing—original draft preparation, K. L.; writing—review and editing, Q. L., J. L., and Y. L.; All authors have read and agreed to the published version of the manuscript.
Declaration of Conflicting Interests
The author(s) declared no potential conflicts of interest with respect to the research, authorship, and/or publication of this article.
Funding
The author(s) received no financial support for the research, authorship, and/or publication of this article.
Informed Consent Statement
Not applicable.
Ethical Approval
Not applicable.
Data Availability Statement
Data sharing not applicable to this article as no datasets were generated or analyzed during the current study.