
Abstract
The relatively low export innovation capacity is not conductive to the steady transformation and upgrading of China’s manufacturing industry, and it is necessary to implement suitable policies to enhance export innovation capacity. This study empirically analyzes the data of 827,471 manufacturing enterprises from 2000 till 2013 to investigate the impact of subsidy policy on export innovation. The overall results show that China’s subsidy policy has a significant crowding-out effect on export innovation, and subsidy for relatively small enterprises is more conducive to promoting export innovation; however, enterprises’ independent investment does not own much impact on export innovation. The econometric results made from perspectives of the sub-region and the industry reveal that subsidy policy is not conducive to export innovation, independent investment is not beneficial to export innovation, and export innovation ability is positively correlated with enterprise scale, but the influence coefficient shows obvious differences.
Introduction
China has experienced a rapid economic growth called China Miracle since the implementation of policy of reform and opening-up in 1978, which is a economic wonder in the world for lasting over 45 years. Meanwhile, the economic growth in China owns comparatively slow speed recent years, for example, the growth rate of GDP in 2010, 2019, 2022, is 10.3%, 6%, and 3%, respectively. There is no doubt that Covid-19 influences the economy in 2020 to 2022 in China significantly, but this could not change the fact that China touches lower growth, which could be demonstrated that China has stepped into the crucial stage of economic new normal, achieving more efficient transformation and upgrading, and the avoidance of the “middle income trap.” As per China’s economic level, the per-capita GDP exceeds US$ 10,000 since 2019, and that achieved US$ 12,741 in 2022.
There are three engines for China’s development, which is investment, consumption, and export, respectively. Even though the ratio of dependence on foreign trade in China decreases from 64% in 2006 to 35% in 2022, there is no doubt that China has been a foreign oriented nation, and export owns significant impact on economic growth in China (Fu et al., 2019; Huang et al., 2021; Jarreau & Poncet, 2012). Meanwhile, the formation of all-dimensional, multi-layered and wide-ranging opening pattern indicates that China pays more attention and releases more resource to develop export oriented economy, and implements many policies to promote it. For example, the strategy of Belt and Road Initiative, the strategy of Free Trade Zone, the strategy of Powerful Trade Nation. For enhancing the development of export, many tools and countermeasures are used, such as the subsidy policy, which is an important aspect of industrial policy for the manufacturing sector, for example, direct subsidy, indirect subsidy, non-currency subsidy, and special subsidy.
Innovation is the first or primary driver for China’s economic and social development, and export and innovation owns intimate relationship (M. Dai et al., 2020; Gkypali et al., 2021; Yang, 2018), which implies export would bring corresponding innovation to some extent. Hence, it is essential to detect the effect of subsidy policies on export innovation in China. In fact, it is well-known that industrial policies impact long-term performance of the enterprise, as do economic growth (Reinert, 1999; W. Wang et al., 2022) and social development (Ferrannini et al., 2021; Koski & Pajarinen, 2013). For example, according to Choi and Levchenko (2021), an industrial policy promoting learning-by-doing would increase welfare by 22% to 31%. In addition, subsidy industrial policy would affect export obviously. Therefore, it is necessary to detect subsidy industrial policy’s effect on export innovation in the manufacturing, so as to achieve Chinese modernization issued by the Twentieth Session Report of the Communist Party of China.
Literature Review
According to relevant research, literature review is made from the aspect of the subsidy policy’s impact on innovation, the relationship between subsidies and innovation, and the impact of industrial policy on export innovation, respectively.
Many studies have analyzed subsidy policy’s impact on innovation from multiple perspectives in China. For example, Haley and Haley (2013) developed independent measures of industrial subsidies using publicly reported data at the enterprise and industry levels and argued that subsidies contributed significantly to China’s success. Du and Mickiewicz (2016) used heterogeneity over Chinese sectors and counties to test subsidy’s effects on performance and identified that private, large, and old companies were the most affected. Guo et al. (2016) examined the effects of the government R&D program (Inno fund) on enterprises’ innovation in China. Yu and Wang (2018) demonstrated that the subsidy policy played one-way role in impacting innovation, and failed to establish a close relationship with the market mechanism of the spatial agglomeration effect. J. Hu et al. (2019) demonstrated relationship between government subsidy and corporate investment efficiency in China, and revealed there existed a negative effect. Bai et al. (2019) explored the impacts of government R&D subsidies on the green innovation of energy-intensive Chinese enterprises, and revealed that the impact was stronger in State-owned than that in small and medium enterprises (SMEs). L. Li et al. (2019) detected the certification effect of government R&D subsidies on innovative entrepreneurial enterprises’ access to bank finance in China. Sun et al. (2020) empirically investigated the impact of government subsidies on R&D decisions of listed manufacturing enterprises in China, and indicated that government subsidies affected R&D decisions for non-state enterprises significantly. Gao et al. (2021) found that R&D subsidies promoted enterprises’ exploratory innovation, and local R&D subsidies exhibited a more salient effect. S. Liu et al. (2021) investigated the impact of two types of government R&D subsidies on innovation using data of Chinese listed enterprises from 2010 to 2016, and identified that ex-ante grants had a better effect on innovation performance by stimulating private R&D investment compared to ex-post rewards.
As per the relationship between subsidies and innovation, many scholars have conducted corresponding theoretical and empirical analyses from different countries. For example, Le and Jaffe (2017) analyzed the impact of R&D subsidy on innovation in New Zealand; González and Pazó (2008) applied a matching approach to analyze public subsidies’ effect on private R&D spending in Spanish manufacturing enterprises, Costa-Campi et al. (2014) demonstrated that the subsidy was an important driver of innovation and R&D in Spanish energy industry, Expósito and Sanchis-Llopis (2019) detected the impact of different types of innovation on the business performance of Spanish SMEs using a multi-dimensional analytical approach; Barbieri et al. (2020) demonstrated that public funding and innovation strategies would touch better innovation performance by taking data of Italian SMEs, Bellucci et al. (2019) performed an empirical analysis of the effectiveness of regional research and innovation policies for SMEs by studying two subsidy programs in Italy, Bronzini and Piselli (2016) evaluated the impact of an R&D subsidy program implemented in a region of northern Italy on innovation by beneficiary enterprises, Catozzella and Vivarelli (2016) assessed the impact of public funding on innovative productivity using a sample of Italian enterprise-level data; Cin et al. (2017) revealed the impact of public R&D subsidy on the small-enterprise productivity by taking case of Korea, Choi and Lee (2017) investigated the relationship between public R&D subsidy and private R&D investment by analyzing the data of the Korean pharmaceutical industry; Engel et al. (2019) analyzed the effects of the governmental financing instrument Spitzencluster-Wettbewerb on R&D expenditure of enterprises in Germany; Berrutti and Bianchi (2020) detected public funding’s effect on enterprise innovation in Uruguay and clarified that behavioral additionality in process and organizational innovation lead to higher productivity levels. The above-discussed studies generally concluded that subsidy policy had a positive effect on innovation or enterprise innovation, and mainly argued about its degree and crowding-out effect. For example, Choi and Lee (2017) identified that government’s R&D subsidy stimulated, instead of crowding-out, private R&D activities of small biotechnology enterprises. The achievement of high-quality exports—a engine of economic development, which is especially important under the background of domestic and international environmental changes in the new development pattern of globalization, anti-globalization, domestic and international double economic cycle, and a national subsidy policy would have the corresponding impact on the export. Studies investigating the relationship between subsidy policy and exports have generally revealed either a negative or a positive relationship (Blonigen, 2016; Powell, 2005; F. Wang, 2014; Y. Wu et al., 2019). For example, Lou et al. (2020) assessed the spillover effects of the US industrial subsidy policies on Chinese exports and found that subsidy policy had a negative effect on mid- and high-tech products, and no impact on resource-based and low-tech export products.
Some researchers have identified the impact of industrial policy on export innovation. Lu et al. (2010) detected that foreign affiliate exporters were less productive than non-exporters in China and performed a theoretical analysis by incorporating the enterprise heterogeneity model. Hsiao (2014) analyzed the interaction between innovation capital and enterprise value by taking the biotech medical industry as an example, and Das Roy and Sana (2023) achieved the same opinion. He and Zhu (2018) explored the evolution of China’s export product space by studying China’s custom product-level data and concluded that export innovation was obviously influenced by regional industry diversification and path-dependent. According to the opinion of Suzigan et al. (2020), the main reason for the failure of industrial policies in Brazil and Latin America were their inabilities to induce persistent changes in enterprises’ export innovative behavior. Andreoni and Tregenna (2020) conducted a comparative analysis of industrial policies to escape the middle-income trap among China, Brazil, and South Africa. Y. Hu et al. (2021) detected the impact of heterogeneous environmental regulations on the export technological sophistication of the manufacturing enterprise in China, and indicated that enhanced environmental protection was essential for improving the level of export technology. X. Li et al. (2021) pointed out that sustainable development would significantly contribute to environmental degradation due to the improvements in the financial sector in the Belt and Road Initiative (BRI) region. The main viewpoints of the corresponding researches on industrial policy and export innovation focus on the debate between “industrial policy promotion theory” and “industrial policy inhibition theory.” Scholars who hold the opinion of “industrial policy promotion theory” believe that industrial policies can promote enterprises’ independent export innovation ability (Grossman & Helpman, 1991; Krugman, 1985; Lemi & Wright, 2020; C. Liu & Li, 2021; Yuan & Zhang, 2020), and those agreeing the opinion of “industrial policy inhibition theory” believe that industrial policy has an inhibitory effect on the improvement of enterprises’ independent export innovation ability (Haley & Haley, 2013).
As an important tool of industrial policy for promoting exports, subsidy policy would also have a corresponding impact on exports. However, literature of its effect on export innovation is scanty, but the relevant literature provides a valuable exploration on how to analyze the relationship between subsidy policy and export innovation. Therefore, taking China as the example, a theoretical model was established, relevant hypotheses were proposed, and an empirical analysis of the effects of subsidies on export innovation was conducted to detect the impact.
Model Establishment and Research Hypothesis
Model Establishment
Existing studies generally investigated subsidy policies’ impact on enterprises’ export innovation (Gao et al., 2021), and detected the impact of policy interactions scarcely. There is some channel that subsidy policy would influence subsidy policy’s effect, and scholars usually considered that China’s subsidy policies are intrinsically correlated with the size of enterprises (Chege et al., 2020), and investment, especially independent investment, also directly impacts enterprises’ innovation capability (X. Dai & Zhao, 2021), so it is necessary to detect the combination of other factors mingled with subsidy policy. Therefore, this study takes the interactions between subsidy policy and independent investment and enterprise scale as the core explanatory variables—considering the influence of factors such as enterprise sustainable operation time and the proportion of fixed assets—and constructs a basic econometric model to study the influence of subsidy policy on export innovation of the enterprise.

Among them, Innov, Sub,
Research Hypothesis
An extensive development model has been characterized by most Chinese enterprises. Thus, the subsidy received by them may be used more to expand the export scale, which may squeeze the export of high-tech products. Consequently, leading in concurrent dilemma of the higher the subsidy proportion, the smaller the export share of high-tech products would be. Furthermore, appropriate subsidies to enterprises may not effectively increase the level of export innovation while increasing export volumes. Subsidies act on non-innovative and innovative activities simultaneously, and it could stimulate the innovation activity obviously. Admittedly, subsidy policies might achieve a certain degree of crowding out effect on export innovation, that is, falling into the “low markup rate trap” (X. Dai et al., 2018; Xu, 2019). Meanwhile, it might not change the direction of the subsidy policy’s influence on export innovation. Therefore, Hypothesis 1 is as follows: export innovation is positively correlated with subsidy policies.
Resolving excess capacity and backward capacity issues is a major challenge for the transformation and upgrading of China’s manufacturing industry, and the resulting changes in enterprise capacity utilization rate and factor market distortion will lead to economic fluctuations and relatively ineffective productivity (X. Dai & Zhao, 2021; B. Hu et al., 2020). This will hinder the realization of China’s goal of becoming the world’s preeminent “manufacturing power.” Production capacity augmentation necessitates investment, and with China currently being at the lower bottom of the global value and global industrial chain, long-term investment of enterprises may be aimed more at expanding production capacity than improving export innovation ability. This may lead to negative correlation between export innovation and long-term investment of enterprises. Therefore, Hypothesis 2 is given: export innovation has negative correlation to do with the interaction terms of subsidized industrial policies and long-term investment.
Both incremental and disruptive innovations require enterprises to invest the corresponding capital. If there is no, or insufficient policy support, small enterprises cannot bear relatively large innovation costs; there is a positive correlation between enterprise scale and technological innovation (Chege et al., 2020; Zhu et al., 2019). However, some scholars believe that the relationship between enterprise scale and innovation input is complicated, and different variables lead to different conclusions, such as a U-shaped, negative, or no correlation with operating revenue, total assets, and total number of employees (Scherer, 1967). Considering the subsequent use of operating income as an variable, while financial factors are an important aspect of the business environment (H. Li et al., 2023), and taking into account the overall scale of Chinese enterprises is comparatively small and the economy is in the process of rapid development, it can be stated that China is at the back end of the U-shaped curve (i.e., the rising stage of the curve), and export innovation should be positively correlated with operating income. Therefore, Hypothesis 3 is given: export innovation is positively correlated with the interaction items for industrial subsidy policies and enterprise scale.
China has witnessed unprecedented economic growth since implementation of the reform and opening up policy, especially after Deng Xiaoping’s 1992 tour in southern China to promote economic takeoff. From an enterprise perspective, China’s growth trajectory can be characterized by the rapid increase of scale and quantity of small, private companies. Six decentralizations of foreign trade management rights include unified national management since the establishment of the People’s Republic of China till 1978, the gradual decentralization in the 1980s, the rectification from 1989 till 1991, the standardized approval in the 1990s, the approval system in the late 1990s till June 2004, and the registration system since July 2004. Particularly, the sixth decentralization has promoted a steady increase in the number of foreign trade subjects in China. However, even at the end of 1999, the total number of foreign trade enterprises in China was only 23,749. Furthermore, it may result in a relatively short lifespan of Chinese enterprises, including the trade and the non-trade, while longer-surviving firms (i.e., established firms) should be more competitive, which might lead to a greater ability to export innovation. Thus, Hypothesis 4 is given: the duration of the business is positively correlated with export innovation.
China’s enterprise innovation necessitates corresponding equipment and asset support, all of which need to be reflected through fixed assets, so both enterprises and the government will pay attention to the expansion of fixed assets and improve quality; this is more important when China has not entered the effective stage of innovative development. In fact, fixed assets investment is an important aspect for China’s economic growth (Mai et al., 2021; Xu et al., 2014), and innovation is the core driving force for China’s economic development. Therefore, China’s government usually coordinates fixed with assets investment and quality enhancement to promote high-quality economic development. In the process of enterprise development, especially their technological transformation, the government’s preferential policies play an important role. Certain measures are usually required to promote enterprises to increase fixed assets investment—for example, duty-free on technological transformation on subsidies, etc. However, China’s economy is generally in the state of relatively extensive, enterprises might achieve the expansion of scale mainly by increasing the fixed assets investment, which may lead the correlation between fixed assets investment and innovation to be not strong. Therefore, Hypothesis 5 is as follows: the proportion of fixed assets of enterprises is no correlation with export innovation.
Data Resource and Index Implementation
Data Source and Description
Data for the study were obtained from the Chinese Industrial Enterprises Database. Relevant data from 2000 to 2013 are taken as the data source. Considering that subsequent analysis is based on two dimensions of the industry and the region, the industry category and region are explained consequently—the explanation of database processing is also taken into account.
(1) 827,471 enterprises in continuous operation from 2000 till 2013 were obtained as data samples to study the influence of subsidy policies on enterprises’ export innovation considering data continuity and reduction of multiple regression endogeneity, and deleting unnecessary dates in the Chinese Industrial Enterprises Database. The following types of companies are included: first, the enterprise code is missing and the total assets, paid-in capital, net fixed assets, or sales are missing or less than 0; second, the number of employees is less than 10, and total assets are less than current assets or less than net fixed assets; third, enterprises have a wrong set-up time (the year in which the business was established is less than 1 or greater than 12 months after the reporting year); and fourth, enterprises are in an abnormal state of business, including the construction industry, transportation industry, accommodation industry, catering industry, wholesale trade, retail trade, etc.
(2) The manufacturing industry is divided into four categories: the labor-intensive, the resource-intensive, the capital-intensive, and the technology-intensive. According to China’s actual situation, the labor-intensive enterprises are defined as manufacturing enterprises, including industry codes 13, 14, 15, 16, 17, 18, 19, 20, 21, 22, and 24; the resource-intensive enterprises, including industry codes 25, 30, 31, 32, 33, and 42. the capital-intensive refers to manufacturing enterprises, including industry codes 23, 29, 34, 35, 36, 37, 38, 41, and 43; and technology-intensive refers to manufacturing enterprises including industry codes 26, 27, 28, 39, and 40. The industry codes mentioned above are taken from the Chinese Industrial Enterprises Database.
(3) The shortage of manufacturing enterprises in Tibet results in an inadequate reflection in the Chinese Industrial Enterprises Database, so Tibetan enterprises are not included in the range of analysis when dividing the eastern, middle, and western regions. At the same time, in the classification of the three regions, Hainan is usually placed in the eastern, as mentioned above in the classification standard of the China Environmental Statistical Yearbook (2013). However, the level of economic development in Hainan is obviously lower than that of other provincial regions in the eastern, and the development level of manufacturing enterprises generally is significantly lower than that of other eastern regions, hence it is included in the middle region. Therefore, the eastern region includes 10 province-level regions: Beijing, Tianjin, Hebei, Liaoning, Shanghai, Jiangsu, Zhejiang, Fujian, Shandong, and Guangdong; the middle region includes nine province-level regions: Shanxi, Jilin, Heilongjiang, Anhui, Jiangxi, Henan, Hubei, Hunan, and Hainan; and the western region includes 11 province-level regions: Inner Mongolia, Guangxi, Chongqing, Sichuan, Guizhou, Yunnan, Shaanxi, Gansu, Qinghai, Ningxia, and Xinjiang.
Index Implementation
(1) The explanatory variable is the degree of export innovation. Zerenler et al. (2008) proposed measuring an enterprise’s innovation output index, namely, the output value of a new product, compared with the commonly used measure of enterprise innovation variables, such as the number of invention patents, the number of new products, etc. This can compensate for the defect because of which a number of inventions or patents may not always be converted into products or outputs. That is, the limitation of not accurately measuring the output and value of innovation. Therefore, in the econometric analysis, the ratio of the output value of new products to the total export value is used as the index of export innovation to characterize the export innovation level of enterprises.
(2) The core variables include the policy support and interaction terms. Subsidy income represents whether the government provides necessary support for the export and innovation of enterprises, and there should be an intrinsic link between subsidy income and enterprises’ innovation (Gao et al., 2021; W. Wu et al., 2021). Therefore, “policy support” is selected as the core variable, and the econometric method is “subsidy income/sales income.” Additionally, interaction terms with long-term investment and enterprise size are also taken as core explanatory variables to strengthen the influence of policy support on enterprises’ export innovation. There are usually three variables to measure the scale of an enterprise: sales revenue, total assets, and number of employees. Compared with total assets and number of employees, sales revenue can better reflect the operating status of an enterprise (Scherer, 1967). Accordingly, “product sales income” (namely, “main business income” in accounting) is selected as the index to measure the scale of an enterprise.
(3) In terms of non-core variables, many factors influence enterprises’ innovation policies. To better examine the interactive influence of industrial subsidy policies on enterprises’ export innovation, enterprises’ continuous operation time and fixed assets ratio are selected as non-core variables.
In view of the possible heteroscedasticity problem, the following treatment methods are proposed: (1) if the variable appears in the form of ratio or time, it will remain unchanged, such as policy support index, business continuity time, and other variables; (2) if the variable appears in percentage or original value (i.e., the original data obtained from the database), the logarithm is taken, such as the intensity of new export products, long-term investment, enterprise scale, ratio of fixed assets, and other variables. For detailed description of variables, see Table 1.
Variable Description.

Descriptive Analysis
Based on the above-mentioned data sample screening method, Stata17.0 was used to delete and retain the sorted enterprise data from 2000 till 2013 according to the corresponding conditions, and descriptive statistics were obtained after calculation and processing of relevant variables, as shown in Table 2. Considering the large sample of micro-enterprise data, relatively extreme samples will appear; so it is not valuable to analyze the maximum and minimum values. However, the extreme values are reported to respect the data output results.
Descriptive Statistics.

In fact, it is obvious that the innovation ability of export enterprises in China is not high (Guan & Ma, 2003; Ma & Rauf, 2020; Mauro et al., 2020; Rialp-Criado & Komochkova, 2017), and the statistical results support this idea. For example, the export of new products only accounts for 0.74% of the total export value. That is, the value of Innov is −0.305.
In terms of the mean, except for the long duration of enterprise operation, the indexes of enterprise operation duration are significantly smaller. For example, subsidy income accounts for only 4.85% of sales revenue (i.e., 1.580 after logarithm in Table 2). However, the average operating duration of enterprises was only 7.854 years. In fact, China’s enterprise growth history is relatively short, resulting in a relatively low proportion of “elderly” enterprises; however, in Europe, the United States, and Japan, there are more “elderly” enterprises which show dominant agglomeration and clustering. For example, in 2014, there were 25,321 100-year old enterprises in Japan, 11,735 in the United States, and 828 in Canada ranking 10th globally in terms of the number of 100-year old enterprises. Correspondingly, the coefficient of variation is generally small. Only enterprise subsidies have a value greater than one, indicating that the internal differences of the other variables are relatively small.
Econometric Results
A total of 827,471 export enterprises from 2000 till 2013 were selected as data sources, and a panel model was used for econometric analysis. Panel models can be divided into fixed effect, random effect, and mixed estimation models—the last is usually not adopted. No significant difference was identified between the coefficients of the fixed effect and random effect models in the Hausman test, and the p-value was .000 on the premise of accepting the null hypothesis—thus, rejecting the original hypothesis, that is, the fixed effect model should be selected. Therefore, the fixed effect model was selected for the subsequent econometric analysis, which was conducted as follows: first, all samples were used for the overall analysis, followed by three regions and four types to examine impact differences.
Regardless of Attributes
By substituting the national sample in the model and using Stata17.0 for econometric analysis, we identified that variable of fixed asset investment does not pass the significance test, which is consistent with hypothesis 5. Additionally, in subsequent models of sub-region and sub-industry attributes, it is also found that this variable fails the significance test. Therefore, the variable of the output was removed and remodeled in the subsequent econometric models of sub-attributes, sub-regions, and sub-industries, and the results of this variable were not reported. As for the econometric results of the national total sample, all other variables excluding this variable passed the significance test of 1%, as shown in Table 2 (but the econometric results of the total sample are retained in this table).
Based on the core variables: According to the econometric results, China’s subsidy policy has a certain stimulus effect on export innovation (the coefficient is 1.480), which supports Hypothesis 1. However, the average value of China’s subsidy policy is only 4.85%. If this value increases by 1%, export innovation increases by 1.480%. In other words, subsidies to Chinese enterprises does not cut into the “export innovation trap.” The econometric results of the interaction term between subsidy policies and long-term investment are consistent with hypothesis 2, that is, long-term investment of enterprises biasing toward the extensive type would cause the corresponding squeezing effect on export innovation to a large extent. The coefficient of the interaction term between subsidy policy and enterprise size is positive, which is consistent with Hypothesis 3, that is, the interaction with enterprise size can break the “export innovation trap” to a certain extent, especially when the subsidy is shifted to high-quality companies. This may be directly related to manufacturing and high-tech industries in China. For example, nanotechnology offers enormous opportunities for companies (Mohammad et al., 2022). Alternatively, the export subsidy policies with strong guiding effect have promoted the output of Chinese enterprises to a certain extent, it contributes much to the transformation of switching from a large trading nation to a powerful trading nation in China. The research results of Mao et al. (2019) show that China’s ranking in trading power index rose from 18th in 2007 to 7th in 2014; however, there is still a long way to go.
Based on the non-core variables: According to the index of the enterprise’s duration of operation, the coefficient is −.029. It is believed that the longer the enterprise’s establishment time, the more importance it attaches to innovation, which is represented by a higher proportion of new product exports. In other words, the empirical results support Hypothesis 4. However, the coefficient is relatively small, which also indicates that the enterprise duration has relatively little influence on export innovation. In fact, the high-tech industry is usually considered an emerging industry or strategic emerging industry in China, but this category of the enterprise generally maintains for a short time in China. This may also be one of the important reasons for the small influence coefficient.
Sub-region
Insertion of each region’s enterprise data in the econometric model revealed that the influence direction of each variable is basically consistent with the national sample data; however, there are a few differences, as shown in Table 3. For example, during 2000 to 2013, the number of enterprises in the eastern, middle, and western regions was 630,238, 124,750, and 69,275, respectively. That is, the more developed the region, the better is the enterprise’s ecological environment.
Econometric Results of the National Population Sample.

Note. p-value is in the bracket. The following takes the same treatment.
Based on the core variables: The subsidy policies and their interaction terms in the three regions all passed the significance test of 1%. The subsidy policies in the three regions are positively correlated with export innovation capacity, but the difference of the influence coefficient is small, for example, the eastern, middle and western regions is 1.480, 1.470, and 1.470, respectively. From the perspective of the influence coefficient of the interaction term with long-term investment, the eastern region is obviously larger than those of the middle and western regions. It can be considered that the long-term investment of enterprises in the eastern region is relatively large, but it does not effectively promote export innovation, which might be directly related to the extensive development of manufacturing enterprises in this region. The changing trend of the coefficient of the interaction term with firm size is the same as that of the interaction term with long-term investment. It is also characterized that the dominance of the eastern is greater than that of the middle and western, that is, the expansion of firm size is more conducive to promoting export innovation, which is consistent with the research conclusion of Luo et al. (2005). If we simply add the value of β1, β2, β3, in the three regions, the added coefficients of the eastern, middle, and western regions is .29, −.27, and −.28, respectively, that is, there is basically no difference in the overall effect, but there are corresponding differences among different variables. In fact, there is little difference between the long-term investment level and enterprise size of manufacturing enterprises in the middle and western China, which demonstrates that the coefficients are basically the same in the econometric results. The above econometric results show that hypothesis 1, hypothesis 2, and hypothesis 3 are in line with each other, and there are regional differences in the impact of subsidy policies on export innovation.
Based on the non-core variables: In more developed regions, enterprises—regardless of longer or shorter duration—pay more attention to the improvement of export innovation ability, thus making the impact of duration variable relatively small, which is also shown by empirical results, such as χ as 0.030, 0.040, and −0.002 for the eastern, middle, and western regions, respectively. Thus, the impact on export innovation in the eastern is less than that in the middle region, but the influence on the western is negative and the coefficient is comparatively small. In other words, the survival duration of enterprises in different regions would directly affect export innovation, but compared with the subsidy policy and its interaction coefficient, we could detect that this effect is quite limited. From the influence direction, the econometric results partially support hypothesis 4.
Industrial Attributes
The manufacturing industry in China is divided into four categories: the resource-intensive, the labor-intensive, the capital-intensive, and the technology-intensive. The econometric results, presented in Table 4, show that regardless of the category of manufacturing industry, Hypotheses 1, 2, 3, and 4 are confirmed. Moreover, there are obvious differences in the influence of subsidy policies on the industrial attributes of enterprises, especially those of the core variables. From the perspective of the policy support index, the positive effects on the four categories of manufacturing are basically the same and the impact on the capital intensive is larger. In terms of interaction with long-term investment, it has the greatest impact on the technology-intensive (the coefficient is −4.350) and the least impact on the labor-intensive (the coefficient is −3.280). Seen from the interaction term with firm size, the impact degree on export innovation of the four categories of manufacturing industries is consistent with the interaction term of long-term investment, which is the technology intensive > the resource intensive > the capital intensive > the labor intensive. From the perspective of enterprise survival duration, its influence on enterprise export innovation is different in industrial attributes, but the coefficients are all small in general. For example, the coefficient of the resource intensive, the labor intensive, the capital intensive and the technology intensive is .028, .028, .032 and .019, respectively.
Econometric Results by the Region.

After comparative analysis of Tables 4 and 5, we could detect that the relationship is represented as: β1 > β2 > β3. That is, the econometric results of the sub-regions and the sub-industries are all shown in this way. Therefore, it could be demonstrated that the impact of subsidy policies has been significantly enhanced after the addition of relevant interaction terms (e.g., the long-term investment, the enterprise scale) to some extent. In fact, the innovation-driven strategy implemented since the 21st century, and the relatively high level of economic development would provide an opportunity for regional realization of coordinated development and industrial transformation and upgrading, which require to realize robustly stable adjustment, either for the underdeveloped region or the extensive manufacturing industry. In particular, the emergence of the “Lewis turning point” would drive manufacturing industries in different regions and with different attributes to achieve corresponding adjustments. Admittedly, there exists enormous debate in academic circles about when or whether China has entered the “Lewis turning point” (Cai & Du, 2011; Kwan et al., 2018; Zhang et al., 2011), but there owns an indisputable fact that the price of labor, namely the rise of wage level, has become a hot topic of relevant research in China.
Econometric Results by Sector.

Robustness Test
To test the robustness of the model of Table 6, a method for replacing the core variables is used, and the calculation method of the core variable, namely policy support Sub, is transformed into subsidy income/industrial output value. In this case, the main business income of the enterprise is changed to the industrial output value of the enterprise, whereas other variables or variables remain unchanged. The detailed results of the econometric analysis conducted using Stata17.0 are shown in Table 5. Seen from the econometric results, other variables in relevant model have passed the significance test of 1%, except for the variable of enterprise duration of operation in the western, which fails 5% but passes the significance test of 10%, and the variable of policy support as per the capital-intensive, which fails 1% the economic implications of corresponding representations. Therefore, it could be considered that the overall effect is better after replacing the core index.
Robustness Test Results.
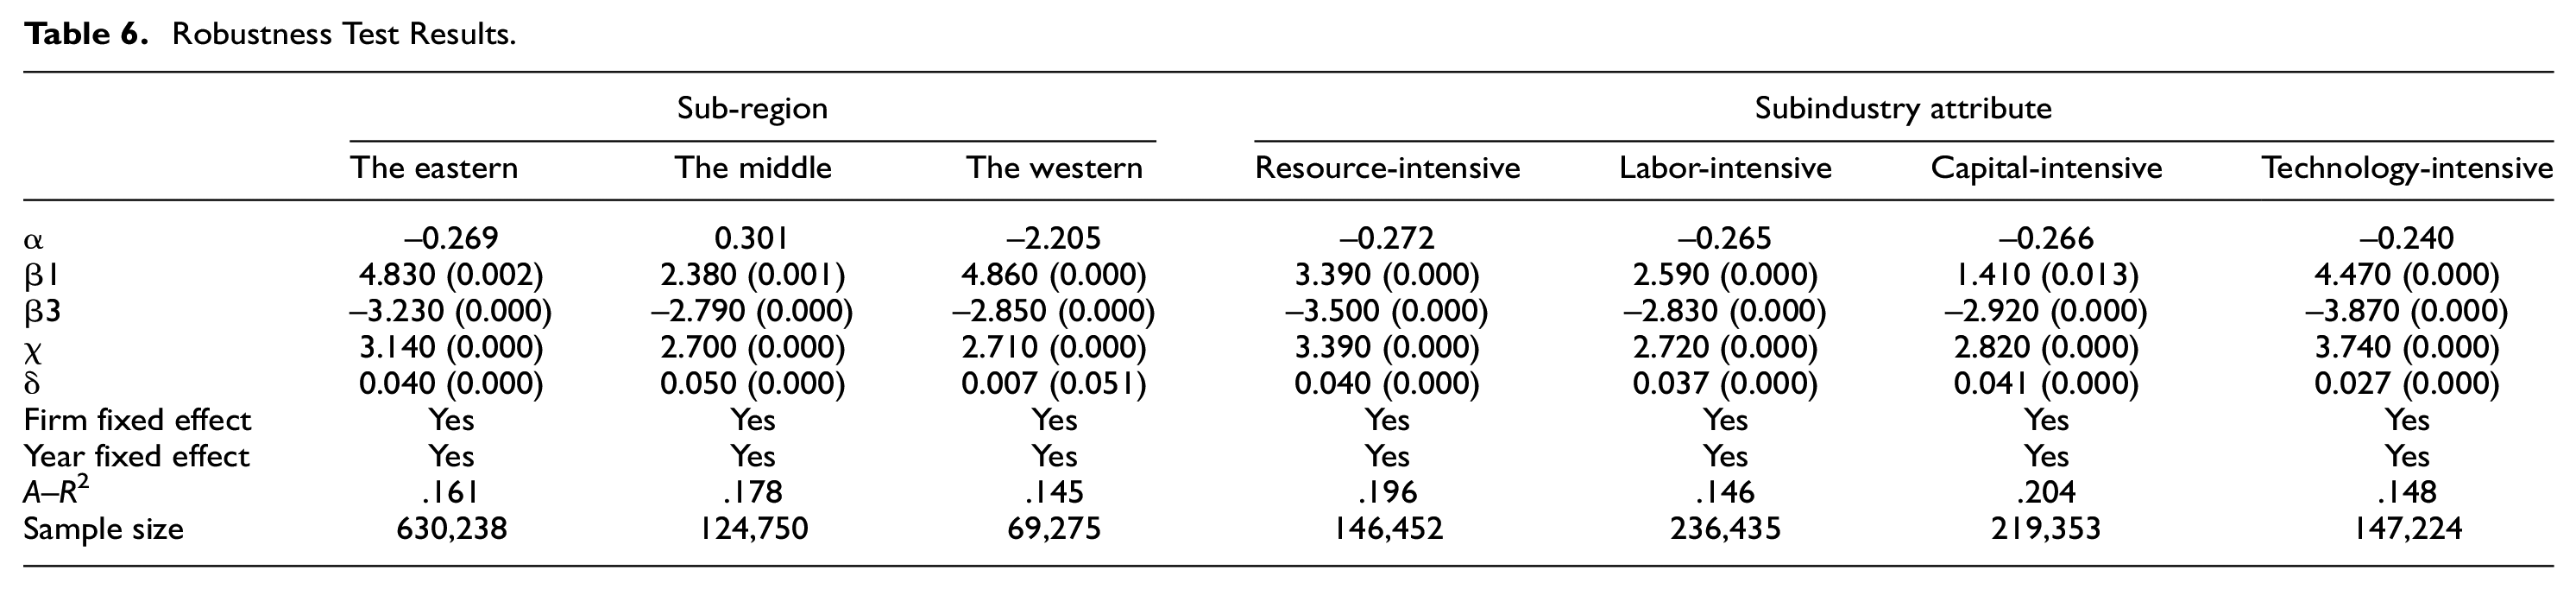
From the perspective of the subregion, the fitting coefficients in the eastern, middle and western regions decreases from .168, .376, and .171 to .161, .178, and .145, respectively, that is, the correlation shows a corresponding decline. At the same time, considering that the p-value of the variable of business duration of enterprises in the western is larger than the corresponding value in Table 4, it could be deducted that the original variable is better than the replaced one.
In terms of the attributes of different industries, the coefficients of the resource-intensive, the labor-intensive, the capital-intensive and the technology-intensive is adjusted from .177, .176, .169, and .163 to .145, .196, .204, and .148, respectively, that is, the increase or decrease of correlation coefficients are the same. However, from the perspective of stationary, the coefficients calculated by the original index are generally smooth, that is, maintained at .16 to .17, while the volatility of the alternative index is relatively obvious. However, the overall difference of the above correlation coefficients is relatively small.
The above research clarifies that the core variables selected by the econometric model passed the robustness test, and the empirical analysis was conducted based on the data of 827,471 manufacturing enterprises in the Chinese Industrial Enterprises Database. The results show that the subsidy policy is conducive to the improvement of Chinese enterprises’ export innovation ability, and there are regional and industry attribute differences in the impact on performance; in particular, there are obvious differences among the three regions. This requires that the implementation of industrial subsidy policy be more targeted to effectively enhance the export innovation capacity of Chinese enterprises.
Conclusions and Discussions
Conclusions
Based on the Chinese Industrial Enterprise Database, it takes relevant 827,471 enterprises in 2000 to 2013 as data resource, and makes theoretical model to empirically analyze the impact of subsidy and its interactions on export innovation for detecting corresponding hypotheses. Among which, attitude to subsidy policy, attitude to subsidy policy, and long-term investment interaction items, and the interactive item between attitude to subsidy policy and enterprise size are treated as the core variables, and the duration of business and the ratio of fixes assets are treated as non-core variables; the region is divided as the eastern, the middle, and the western, respectively; the industry is divided as the labor-intensive, the labor-intensive, the capital-intensive, and the capital-intensive, respectively. The econometric result generally are coincided with the hypotheses brought, and there are regional and industrial differences in the impact of subsidy policies on export innovation, especially that on the regional difference, and the impetus of subsidy on export innovation could be enhanced after consideration of interaction terms. In addition, the robustness test demonstrated the former index indicating subsidy is better than the latter, and passed the test.
Discussions
The limitations and further research of this article are mainly the following three aspects.
Subsidy policy would not only affect enterprises’ export innovation by itself, but also have a direct impact through the corresponding interaction terms. The empirical results also show this, which is caused by the policy transmission and delay effects. However, no systematic research has been conducted on the selection of interaction items, and scare literature has been retrieved on the interaction factors of subsidies affecting enterprises’ export innovation. Therefore, only the influence of two interaction items: fixed investment and enterprise size, is considered. However, if other possible core interactions are included in the analysis, the strength and direction of their influence may show corresponding changes, especially for the two interactions that have been measured. Therefore, If a thorough theoretical analysis could be made to detect the interaction items of the impact of subsidy policy on export innovation and makes corresponding econometric result, the empirical analysis could be more convincing, and this would be one further research point.
To examine the impact of industrial policies on export innovation at the micro level, based on the existing data sources in China, it is best to adopt the panel matching data of the Chinese Industrial Enterprises Database and the China Customs database; however, considering the dependent variable, namely, the export innovation index, the relevant indexes in the Chinese Industrial Enterprises Database can be directly used to ensure that they are not matched. At this point, the export innovation level is measured by the percentage value of the output value of new products and the total export value. However, if the China Customs database is needed in other variables to measure enterprises’ export innovation, the change in evaluation variables will lead to a corresponding adjustment of empirical results, and this will be another further wok for study.
Policy support indicates that all three core variables need to be adopted, which is the key to characterizing the impact of subsidy policies on enterprises’ export innovation. In a specific empirical study, it is not controversial to consider subsidy income as the index of export enterprises to obtain subsidy dividends, but it is debatable whether to take enterprise main income as part of the factor to measure the degree of policy support. Indeed, in the robustness test, the industrial output value of enterprises is used to replace the main business income of enterprises, and the results show that the empirical effect of the original variables is better. This is due to the relatively few alternative variables available for selection in the Chinese Industrial Enterprises Database. If other variables of relevant enterprises can be obtained for substitution, the econometric results may be changed or reversed even if the econometric model remains unchanged, especially for the manufacturing industry with different regions and industry attributes, and this would be the third aspect for further research.
Footnotes
Declaration of Conflicting Interests
The author(s) declared no potential conflicts of interest with respect to the research, authorship, and/or publication of this article.
Funding
The author(s) disclosed receipt of the following financial support for the research, authorship, and/or publication of this article: Philosophy and Social Science Planning Project of Zhejiang Province (20NDJC074YB). Doctoral Research Foundation of Jiangxi Science and Technology Normal University (2019BSQD024). Key Base Project of Humanities and Social Sciences in Colleges and Universities in Jiangxi Province (JY19120). National Social Science Foundation of China (18AJY023).