
Abstract
In this study, we use six dimensions (i.e., firm strategy; government, structure, and rivalry; demand conditions; chance; factor conditions; and related/supporting industries) based on Porter’s diamond model to identify critical development indicators to enhance the competitiveness of Taiwan’s solar photovoltaic industry. Our proposed industry evaluation model uses the decision-making trial and evaluation laboratory (DEMATEL) technique to establish an influential relationship between indicators, the DEMATEL-based analytic network process to obtain influential weights, and the modified VIšekriterijumsko Kompromisno Rangiranje (VIKOR) method to assess industry development performance gaps. Through this analysis, current industry demands can be clarified, and operations of governments and photovoltaic firms can be improved by limiting developmental gaps and formulating robust policies and strategies. Furthermore, the influential network relationship map and influential weights can help explain the complex assessment system and suggest priorities for industry improvement. The results demonstrate that the six dimensions should be upgraded in the following order of priority: firm strategy; government, structure, and rivalry; demand conditions; chance; factor conditions; and related/supporting industries. We also discuss the implications for photovoltaic firm management.
Introduction
Nation building is often dependent on strong competition among national industries. In January 2016, the President of Taiwan Tsai Ing-Wen proposed an “Innovation, Research and Development Plan for Five Major Industries.” This policy became the foundation for a new economic development model centered on “integration, innovation, employment, and allocation” with ambitious goals of increasing corporate profitability, labor income, and new employment opportunities (Fang et al., 2018; Şengül et al., 2015). Competing in the new industrial market requires widespread reforms in industrial structure coupled with general economic progress.
Taiwan’s new “5+2” plan focusses on developing five major innovative industries, specifically, green energy technology, Asian Silicon Valley, biotechnology, smart machinery, and the defense industry, in the context of new agriculture and a circular economy. The 5+2 plan creates five industrial innovation ecosystems, spanning North to South Taiwan. Using innovation to drive an industrial upgrade and transformation should not only enhance corporate profitability and competitiveness but also increase employment opportunities, as well as labor income and benefits.
The demand for renewable energy has become an urgent policy issue worldwide due to climate change and resulting energy shortages. Taiwan faces the same energy crisis (Choudhary & Srivastava, 2019; Z. Y. Zhao et al., 2011). In a bid to counter the effects of greenhouse gases and ensure sustainable development for human survival, many governments are actively investing in research and development (R&D) in renewable energy. Taiwan’s predicament is particularly severe because it has no autonomous energy sources. As the country fulfills its energy needs through imports, coping with the environmental effect of fossil fuel use and acquiring an adequate, stable energy supply for continued economic growth and industrial advancement are understandably critical national issues.
Consistent with the principles of a green economy, Taiwan’s government first proposed the policy goal of creating a nuclear-free homeland by 2025. This policy is now part of the 5+2 industrial innovation plan under green energy technology, allowing the government to fully implement Taiwan’s niche skills in green energy technology. This policy is expected to drive the industry’s development and enhance the competitiveness of national industries. Hence, we expect safer energy use, green economic innovation, and greater environmental sustainability.
However, energy policies, such as the nuclear-free homeland policy or thermal power generation, have often faced public scrutiny and action. Despite the 2018 referendum during the 9-in-1 election and abolition of rigid goals in the 2025 nuclear-free homeland policy, Taiwan’s government has continued to introduce green energy policy goals, demonstrating its commitment to positive environmental transformation.
Indeed, Taiwan’s data suggest that the country would prosper in emulating Germany, which has been successful in achieving energy transformation. In particular, 1 kW h of electricity in Germany is priced at NT$10.60, which is three times the price of electricity in Taiwan. The difference in pricing is not the result of the high cost of renewable energy generation in Taiwan, but due to the implementation of renewable energy laws in Germany, that is, the difference between the feed-in tariff and the total cost of electricity is passed on to German taxpayers.
However, Germany has witnessed a recent decline in electricity consumption and increase in economic growth. The government has even converted public buildings, such as the Bundestag and Berlin Hauptbahnhof, into “green buildings.” Green energy is now the third-largest industry in Germany after machinery and automobiles, with wide acceptance among Germans of high electricity prices in exchange for energy transformation (INSIDE, 2016). In the context of Taiwan, the public’s social democratic literacy is a necessary element to implementing substantive industrial and infrastructural measures, such as upgrade and reforms of industries, green energy buildings, and decentralized power grids. We thus focus on the initial development of Taiwan’s solar photovoltaic industry to construct a set of evaluation models to influence future development (Irfan, Zhao, Ahmad, & Mukeshimana, 2019b; Irfan, Zhao, Ahmad, & Rehman, 2019). We then review the primary indicators for such improvements. The resulting analysis can serve as a reference for governments to formulate strategies.
The international attention on climate change, energy conservation, and carbon reduction is only growing. Against this backdrop, green energy development has become a key economic goal in many countries, which is why, this industry is part of the 5+2 innovation cluster. Green energy involves the overall economic development of a country and the quality of life of its residents. Green energy polices significantly affect industries, livelihoods, consumption, and employment. We thus examine how the government can promote Taiwan’s development of its green energy technology industry. Our in-depth analysis is conducted in two stages; the research structure is detailed in the next section.
The ability to be progressive, mobile, and resilient in the local environment helps determine the success of an industry within a nation. We illustrate the theoretical framework of the diamond model proposed by Porter (1990). Stretched by the market mechanism at the macro level and government policy level, chance and four other basic factors affect one another to determine the overall competitiveness of a nation or region. In the literature, Chung (2016) discussed logistics cluster competitiveness among Asian countries, evaluated its indicators based on Porter’s diamond model, and computed the weight of each indicator using the analytical hierarchical process. Y. Wu et al. (2017) used the same model for a competitiveness analysis of China’s coal industry, finding it leads to excess capacity, low coal price, and clean energy substitutes. Fang et al. (2018) developed a revised Porter’s diamond model for assessing the international competitiveness of the renewable energy industry among G20 (Group of Twenty) members. Their study can serve policymakers and industrial end users as a useful reference for international efforts toward sustainable global energy use.
In summary, the diamond model is a comprehensive analytical method focusing on holistic competitive advantages that rely on integrating basic and associated factors (Castro-Gonzáles et al., 2016; Chung, 2016; Fang et al., 2018; Irfan, Zhao, Ahmad, & Mukeshimana, 2019a; Rashidin et al., 2020; Z. Y. Zhao et al., 2011). We therefore use the diamond model to construct an analytical framework that helps us evaluate the competitiveness of Taiwan’s solar photovoltaic industry. We conduct an in-depth investigation of the industry’s driving factors and present an assessment of the industry and its future.
Developing a solar photovoltaic industry policy is a multiple-attribute decision-making (MADM) problem (Chung, 2016; Kabak & Dağdeviren, 2014; Lee & Chang, 2018). MADM is a complex decision-making approach involving both quantitative and qualitative factors (Lee & Chang, 2018; Roy et al., 2019; Tsai et al., 2020; Tsai & Lin, 2016). There exist abundant studies using distinct MADM methods to assess the best industrial policy (Chung, 2016; Lee & Chang, 2018; Tsai & Lin, 2016). Within the energy field, MADM has solved problems involving e-store businesses (Chiu et al., 2013), financial performance evaluation (Chang & Tsai, 2016), museum business strategy (Tsai & Lin, 2016), web-based hotel evaluation and selection (Roy et al., 2019), retail banking industry (S. Wang et al., 2020), and green marketing (Tsai et al., 2020). However, previous studies on how the renewable energy industry can enhance countries’ competitiveness have tended to use statistical analysis methods (Lai et al., 2019; Maqbool, 2018); only few studies have used the MADM method. The MADM method differs from traditional statistical techniques wherein a minimum of 200 samples are required to verify the causality relationship among variables (Hoe, 2008); however, the MADM method only requires a minimum of only six samples (Cui et al., 2019; Jeng & Huang, 2015) to produce valid results. Using the MADM method, the average questionnaire included 10 to 15 experts (Jeng & Huang, 2015; Tsai, 2020; Tsai & Lin, 2016).
Owing to this gap in research, our study focused on the solar photovoltaic industry in Taiwan and asked the following four research questions: (a) What are the factors that influence the solar photovoltaic industry’s development? (b) Could an evaluation model that defines the networks of influence for these factors be constructed? (c) How would the factor weights be developed for such a model? (d) How should policy be improved based on the findings?
To answer these research questions, first, we develop a hybrid MADM model combining the decision-making trial and evaluation laboratory (DEMATEL) technique to construct an influential network relationship map (INRM) (Tsai, 2020; Tsai et al., 2020; S. Wang et al., 2020; Zhao et al., 2019). Second, we find the influential weights of the DEMATEL-based analytic network process (DANP) using dimensions and criteria from the influential relationship matrix (Tsai et al., 2020). Third, we determine the weightings of the modified VIšekriterijumsko Kompromisno Rangiranje (VIKOR) method by using the influential weights of the DANP to evaluate and integrate the criteria for performance gaps (Tsai, 2020). Finally, we explore ways in which such gaps can be reduced to improve Taiwan’s solar photovoltaic industry policy based on the INRM (Chiu et al., 2013; Lu et al., 2018; Tsai et al., 2020; Zhao et al., 2019). The hybrid MADM methods overcome the limitations of existing decision models, allowing us to analyze indicators influencing improvements to solar photovoltaic policy.
Accordingly, this study has several contributions. First, it investigates the factors that influence the solar photovoltaic policy of Porter’s diamond model, and it will provide holistic research in the competitiveness of the solar photovoltaic industry. Second, it develops a framework that includes six main factors, based on Porter’s diamond model, to enhance the creation of a theoretical framework. Third, it combines DEMATEL and analytic network process (ANP) to assess the influential weights of factors. Fourth, it then adopts the modified VIKOR method for a gap analysis. Consequently, the accuracy and practicality of its assessment are improved over those of previous studies.
The rest of the article is organized as follows. In section “Background and Literature Review,” we briefly introduce the literature on the links among factor conditions; demand conditions; firm strategy, structure, and rivalry; related and supporting industries; government; and chance (Porter’s diamond model). We also discuss the hybrid MADM evaluation model (DEMATEL, DANP, and modified VIKOR methods) and use it to build an evaluation model to solve problems of interdependence and feedback. In section “Method,” we present an empirical study of the development of Taiwan’s photovoltaic industry policy and demonstrate the proposed model. We then discuss the results and practical implications in section “Results: Empirical Case Analysis” and conclude our study in section “Conclusions.”
Background and Literature Review
Evaluation of the Photovoltaic Industry’s Development in Taiwan
This section discusses Porter’s diamond model (Porter, 1990) as the study’s research framework and compiles the trends affecting the evaluation model for Taiwan’s photovoltaic industry development indicators. We thus investigate the promotion of green energy technology and determine how competitiveness within innovative industries is evaluated. We also analyze and review the development of green energy using the MADM process.
The diamond model can identify the competitive advantage of nations—that is, whether a nation or a region can become a base for a particular industry’s development (Porter, 1990). The unit concerned is, in fact, industry; therefore, this theory provides an analytical model for industry competitiveness (Porter, 1990; Z. Y. Zhao et al., 2009). Since the diamond model was first proposed, scholars have used it to assess the competitiveness of the wind power industry (Irfan, Zhao, Ahmad, & Mukeshimana, 2019a; Z. Y. Zhao et al., 2009), the photovoltaic industry (Z. Y. Zhao et al., 2011), logistics clusters (Chung, 2016), Latin American economies (Castro-Gonzáles et al., 2016), and the coal industry (Y. Wu et al., 2017). This methodology was also used to evaluate the renewable energy competitiveness among G20 members (Fang et al., 2018). Porter’s (1990) theoretical framework can even be useful for examining the role and importance of enterprises in Taiwan’s market and as a tool for a comparative analysis of Taiwan’s international competitive advantages. Therefore, we use this model to construct an analytical framework that helps in the assessment of the competitiveness of the solar photovoltaic industry in Taiwan. We perform an in-depth investigation of the driving factors of the industry and present an assessment of the industry and its future. This model comprises four fundamental elements: factor conditions; demand conditions; firm strategy, structure, and rivalry; and related and supporting industries, plus two major variables—government and chance (Figure 1).
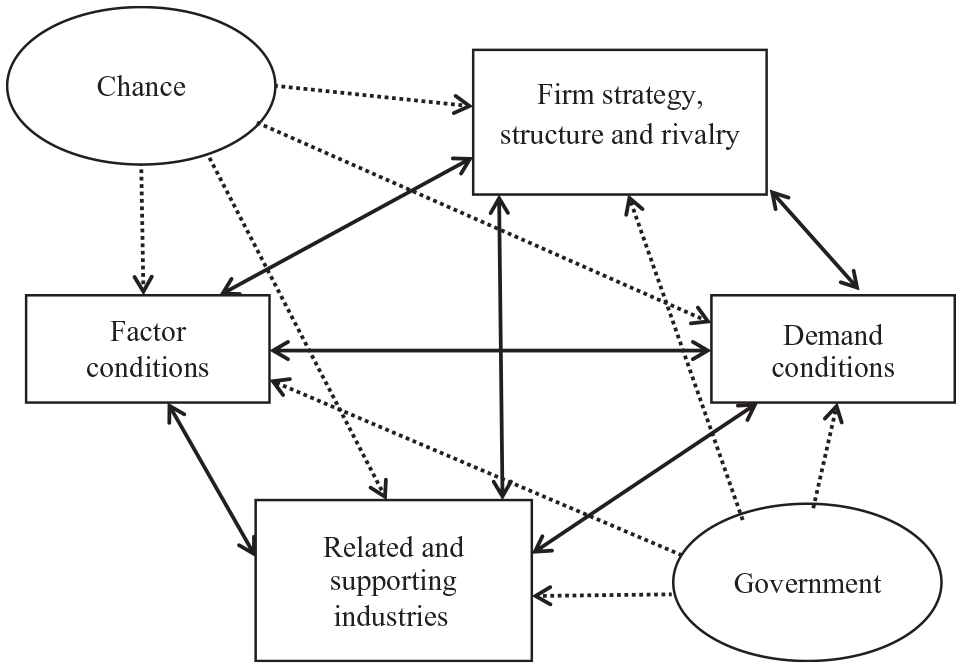
The Porter’s diamond model.
Factor Conditions
Factor conditions include general production resource advantages, such as labor, capital, infrastructure, and natural resources, including differentiated niche resources such as skilled labor and geographic location. Porter (1990) also believes that a country’s innate attributes are not the most important competitive advantages for most industries but that created factors, especially in highly productive industries, are. Even without certain advantages, competitive advantages can still arise from efficient marketing and innovation.
The dimension of factor conditions enhances the values and benefits of Taiwan’s photovoltaic industry. We consider the following possible measurements to assess this dimension: (a) resource endowment (F1), namely, the production factors owned by the industry, including the amount of resources such as labor, capital, land, technology, and management (Fang et al., 2018; Gosens, 2017); (b) capital investment (F2), namely, funds provided to achieve enterprise business goals, generally referring to the acquisition of long-term assets such as land, plants, and machinery (Fang et al., 2018; Lee & Chang, 2018; Nigim et al., 2004); (c) technologies (F3), namely, key technologies required to develop the photovoltaic industry (Fang et al., 2018; Lee & Chang, 2018); (d) labor (skilled labor) (F4), namely, high-tech professional R&D talent possessed by enterprises (Fang et al., 2018; Kahraman et al., 2009); and (e) land demand (F5), namely, location and amount of land required to set up photovoltaic equipment (Ahmad & Tahar, 2014; Jia et al., 2016; Lee & Chang, 2018; Nigim et al., 2004).
Demand Conditions
Demand conditions refer to various aspects of domestic market demand, including the quantity, quality, and degree of innovation of products produced. The similarities and differences between domestic and international demand may also affect a country’s competitiveness.
The dimension of demand conditions enhances the demand and benefits of Taiwan’s photovoltaic industry. We consider the following possible measurements to analyze this dimension: (a) market size (D1), namely, capacity for future photovoltaic market growth (Fang et al., 2018; Hermosilla & Wu, 2018); (b) environmental pressure (D2), that is, in an ecologically sensitive and crowded environment, assessments of environmental effects are usually difficult to implement, and operators in the agricultural, forestry, fishing, and animal husbandry sectors are reluctant to see their land being converted to solar power plants (Ahmad & Tahar, 2014; Fang et al., 2018; Yang et al., 2018); (c) substitution effect (D3), namely, the effect of demand changes caused by changes in solar power tariff rates when real income remains constant (Fang et al., 2018; Sun et al., 2019); (d) technology transfer (D4), namely, the provision of technologies, machines and equipment, technical information, process information, or other information and services from technology providers to technology users or recipients through technology transfer or contracts, allowing the latter to implement such technologies (Kirchherr & Urban, 2018; Talaei et al., 2014); (e) mastering market demand trends (D5), that is, enterprises can fully understand various factors that affect demand in the photovoltaic market (Rodrigues et al., 2018).
Related and Supporting Industries
Industrial clustering is a key measure of a country’s competitiveness, including the establishment of science parks or industry–academia collaboration. Along with spillover effects, upstream and downstream integration and innovation are highly productive external effects for a country or even an individual enterprise. If a domestic supplier is extremely competitive, its strong international performance will positively affect the enterprise.
The dimension of related and supporting industries also has the potential to benefit Taiwan’s photovoltaic industry. We consider the following measurements as part of this dimension: (a) investment industry competitiveness (R1), namely, the competitive abilities reflected by the photovoltaic industry, such as production efficiency, ability to meet market demands, and continued profitability compared with the same industry in other countries or regions (Fang et al., 2018; Stucki, 2019; Tagliapietra et al., 2019); (b) solar photovoltaic-related industry chain (R2), namely, the coordination, interaction, and cooperation between upstream, midstream, and downstream sectors of the photovoltaic industry that are mutually supportive and integrative, helping to achieve international competitiveness (Jia et al., 2016); (c) industrial clustering effect (R3), namely, competitive but interdependent and mutually beneficial relationships which exist among vendors in a specific field, as well as interactive relationships in a geographic location (Hidayatno et al., 2019; C. H. Lin et al., 2006); and (d) production equipment technology enhancement (R4), namely, technologies which enhance and improve solar production equipment to increase production efficiency (Faruqui et al., 2017).
Strategy, Structure, and Rivalry
The competitiveness of a nation in a particular industry also depends on benign competition among local enterprises. It can stimulate greater R&D and innovation capabilities among industries. Porter (1990) believes that the competitive advantages of a nation originate from continuous innovation and industrial self-enhancement. There is also, however, a need to face stronger pressure and challenges (benefiting from an intensely competitive domestic environment, demand for high-quality, support from related industries, and possession of special production factors) through which enterprises can achieve world-class competitiveness.
The dimension of strategy, structure, and rivalry enhances the competitive advantage of Taiwan’s photovoltaic industry. We thus consider the following measurements for this dimension: (a) managerial attitude (B1), that is, during the planning of new investments, enterprises require the support and participation of senior executives so new investment plans can be successful (Dibrell et al., 2011; Graham et al., 2013); (b) firm competitiveness (B2), namely, comprehensive ability of enterprises to realize their own value by creating customer value by cultivating resources and capabilities, acquiring externally available resources, and efficiently using them under competitive market conditions (Bodnaruk et al., 2016; Fang et al., 2018); (c) driving cross-industry strategy alliance (B3), that is, in cross-industry alliance, a community of common interests comprising different types and levels of market entities to increase scale, expand market share, and improve information and resource sharing (Tsai & Lin, 2016; Zhao et al., 2019); (d) technology R&D and innovation capabilities (B4), namely, technology R&D and an enterprise’s degree of product innovation in manufacturing (Bistline, 2016; Demirtas, 2013; Kaya & Kahraman, 2010; Lee & Chang, 2018); and (5) vertical integration capability (B5), namely, the use of investment, mergers, and acquisitions, diversification, and other methods to integrate activities at different stages of value production. The higher the degree of vertical integration, the higher the control and ownership of vendors’ upstream and downstream value chains (Simshauser et al., 2015).
Government
The government plays the role of an influencer in the diamond model; it influences other facets, such as how its policies affect other factors. Porter (1990) argues that the government should ideally be a catalyst or challenger. It can encourage, guide, and drive the ambitions and competitiveness of private enterprises. A government should strive to create an environment that prompts enterprises to achieve competitive advantages, rather than offering direct assistance or intervention.
This dimension enhances the competitiveness of Taiwan’s photovoltaic industry, and we consider the following measurements to determine it: (a) regulatory relaxation (G1) by the government to aid the industry’s development (Ren & Sovacool, 2015; Y. Wu et al., 2017; Z. Y. Zhao et al., 2011); (b) preferential policies (G2), namely, subsidies and preferential tax rates established by the government to encourage industrial development (Fang et al., 2018; Jia et al., 2016; Z. Wang et al., 2017; Y. Wu et al., 2017; Z. Y. Zhao et al., 2011); (c) preferential loans for key industries (G3) provided by banks to enhance technology and development (Jia et al., 2016; Mir-Artigues & Río, 2014; Z. Y. Zhao et al., 2011); and (d) appropriate solar power feed-in tariff rates (G4) set by the government (Hitaj & Löschel, 2019; Jia et al., 2016; Moore et al., 2013; Tongsopit, 2015; Ye et al., 2017).
Chance
Chance is usually an accidental event that an enterprise or government is unable to predict or control in advance. It may affect existing competitive positions in the market or other facets of the diamond model, thus affecting competitive advantage. Examples of chance include new inventions, fundamental technological breakthroughs, external political developments, and changes in foreign market demand.
This dimension has the potential to generate competitive and creative offerings in the photovoltaic industry, and we assess it by considering the following measurements: (a) industry advantages (O1), namely, complete industry chain, including engineers and technical staff with professional skills and motivation to maintain advantages (Kuik et al., 2019; Y. Wu et al., 2017; Z. Y. Zhao et al., 2011); (b) industry challenges (O2), such as poor market conditions, political environments, and competitive pressures (Carstens & Cunha, 2019; Choudhary & Srivastava, 2019; George et al., 2019; Z. Y. Zhao et al., 2011); (c) future development trends (O3) or undeveloped trends that require further improvements in efficiency and cost (Choudhary & Srivastava, 2019; J. Wu et al., 2019; Y. Wu et al., 2017); and (d) price reduction (O4); that is, in the future, the growing popularity of solar power generation will reduce its generation costs and improve efficiency, thereby reducing the tariff rates to previous average levels. In other words, the photovoltaic power supply’s cost will become consistent with the cost of the past power supplies. This is the last key indicator for photovoltaic industry growth (Antonietti & Fontini, 2019; Punzi, 2019). In addition, enterprises will actively develop and promote the industry, leading to (e) increasing employment opportunities (O5) (Kabak & Dağdeviren, 2014; Şengül et al., 2015; Stein, 2013); enhanced local development and social welfare through the development of solar power generation (O6) (Nigim et al., 2004; Tsoutsos et al., 2009); and, finally, social acceptance level (O7), which, through government promotion, is critical to achieving energy conservation, a green economy, and environmental sustainability (Choudhary & Srivastava, 2019; Demirtas, 2013; Kaya & Kahraman, 2010; Ren & Sovacool, 2015).
Based on the literature review and prior pretesting by professionals, we selected the dimensions and criteria for evaluating the industry’s competitiveness in Taiwan. This was made possible through 10 expert interviews with the government (energy sector), research fellows, and managers working in the industry. Finally, we propose a model for evaluating the industry’s competitiveness.
Method
Proposed Energy Policy Evaluation Model
The empirical analysis of the policy development of Taiwan’s photovoltaic industry is based on a hybrid MADM model with Porter’s diamond model. The analytic process includes five stages. In the first stage, we define the research problem and create an industry evaluation framework. In the second stage, we identify and measure cause and effect relationships among the dimensions and criteria based on the DEMATEL technique. In the third stage, we create the INRM and calculate the influential weights of the dimensions and criteria based on the DEMATEL and DANP analyses. In the fourth stage, we assess performance gaps using the modified VIKOR method. In the fifth stage, we discuss final empirical results and determine an improvement for industry policy. Figure 2 demonstrates the complete analytical process.

The analytic process of the study.
INRM Analysis Using DEMATEL
We use the DEMATEL technique to create the cause and effect relationships map (Gölcük & Baykasoğlu, 2016; Tsai, 2020; Tsai et al., 2020; Tsai & Lin, 2016; Zhao et al., 2019). This technique, proposed by the Geneva Research Center of the Battelle Memorial Institute, is especially effective in helping one visualize the structure of complicated cause and effect relationships (Fontela & Gabus, 1976; Gabus & Fontela, 1973). It is a comprehensive method for building and analyzing a network structural model involving causal relationships among multiple factors (Cui et al., 2019; Gölcük & Baykasoğlu, 2016; Tsai et al., 2020; S. Wang et al., 2020) and then distinguishing relationships when measuring a problem (Gölcük & Baykasoğlu, 2016). Scholars have used the DEMATEL analysis for green business failure, museum business strategy, banking service innovation, third-party service provider logistics, green marketing, service industry policy, and the hospitality industry (Cui et al., 2019; Govindan & Chaudhuri, 2016; Ocampo et al., 2018; Tsai, 2020; Tsai et al., 2020; Tsai & Lin, 2016; Zhao et al., 2019). The DEMATEL technique includes five steps: The first step defines the dimensions/criteria and determining relationships; the second step sets up the direct relationship matrix; the third step calculates the normalized direct relationship matrix; the fourth step calculates the total relationship (direct/indirect) matrix; and the final step draws and analyses the INRM. The details of each step are as follows Tsai and Lin (2018), Zhao et al. (2019), and Tsai (2020).
Using the DANP Analysis to Find the Influential Weights of the Indicators
Our hybrid energy policy improvement model combines both the DEMATEL and DANP analyses to effectively address the interdependence and feedback issues. To simplify, we create an INRM using the DEMATEL technique and obtaining the influential weights using the DANP technique through the ANP (Chen & Lin, 2018; Zhao et al., 2019). The DANP method can be described in the following studies Tsai and Lin, (2018), Zhao et al. (2019), and Tsai (2020).
Using the Modified VIKOR Method to Improve Policy
Opricovic (1998) developed VIKOR based on the compromised programming used in MADM. Here, the measure of “closeness” is compared with the “ideal” alternative (Opricovic, 1998; Opricovic & Tzeng, 2004). This method uses the class distance function based on the aspiration and worst levels solution and then orders the results (Zeng et al., 2019; Zhao et al., 2019). Under the modified VIKOR for the normalized class distance function, the preference should ideally be near the aspiration level and far from the worst level (Liu et al., 2017; Zhao et al., 2019). The compromise ranking algorithm is summarized in the following studies Tsai and Lin (2018), Zhao et al. (2019), and Tsai (2020).
Results: Empirical Case Analysis
This section discusses the current status and issues facing the policy development of Taiwan’s photovoltaic industry to demonstrate, as an example, the appropriateness of the proposed model in solving problems arising from complex real-world dynamics. Priorities for improvement are based on questionnaire survey results and the evaluation process.
Description of the Problem and Data Collection
Two separate questionnaires were designed based on the results of interviews with experts regarding evaluation indicators. The first questionnaire for influential relationships among evaluation indictors was distributed to 10 renewable energy experts (Yucesan & Kahraman, 2019). These experts, which include government, industry, and field experts, were expected to have experience within the renewable energy field. The questionnaires were sent to experts by post and email and rated the experts’ answers on a 5-point scale ranging from 4 (extremely strong influence) to 0 (completely no influence).
The second questionnaire was crucial, as it dealt with Taiwan’s photovoltaic industry policy development. It was distributed to 10 experts in government, industry, and related research institutions. The answers were rated on an 11-point scale, ranging from 0 (very unimportant) to 10 (very important).
We expected this study to help both the government and industrial development to satisfy the Taiwanese population and promote higher renewable energy use rates. Our goal is to formulate improvement strategies that will allow practitioners to develop effective policy by addressing gaps in renewable energy.
Using the DEMATEL Technique to Create the INRM
We developed the influential network structure and analyzed six dimensions and 30 criteria for assessing policy development in Taiwan’s photovoltaic industry. Through the DEMATEL questionnaire completed by the 10 experts, we obtained the initial matrix A by pairwise comparison. This allowed us to derive a normalized matrix D available for computing the total influence matrix T of the criteria (Table 1). The result reveals highly significant confidence (the 10 experts’ group consensus of significant confidence), with a high consistency ratio of 96.3% (marginally above 95%) and consistency gaps measured at 3.7% (marginally below 5%). This helps us derive the sum of influences given and received on the criteria (Table 2), as illustrated in the INRM in Figure 3.
The Total Influence Matrix of Criteria T.
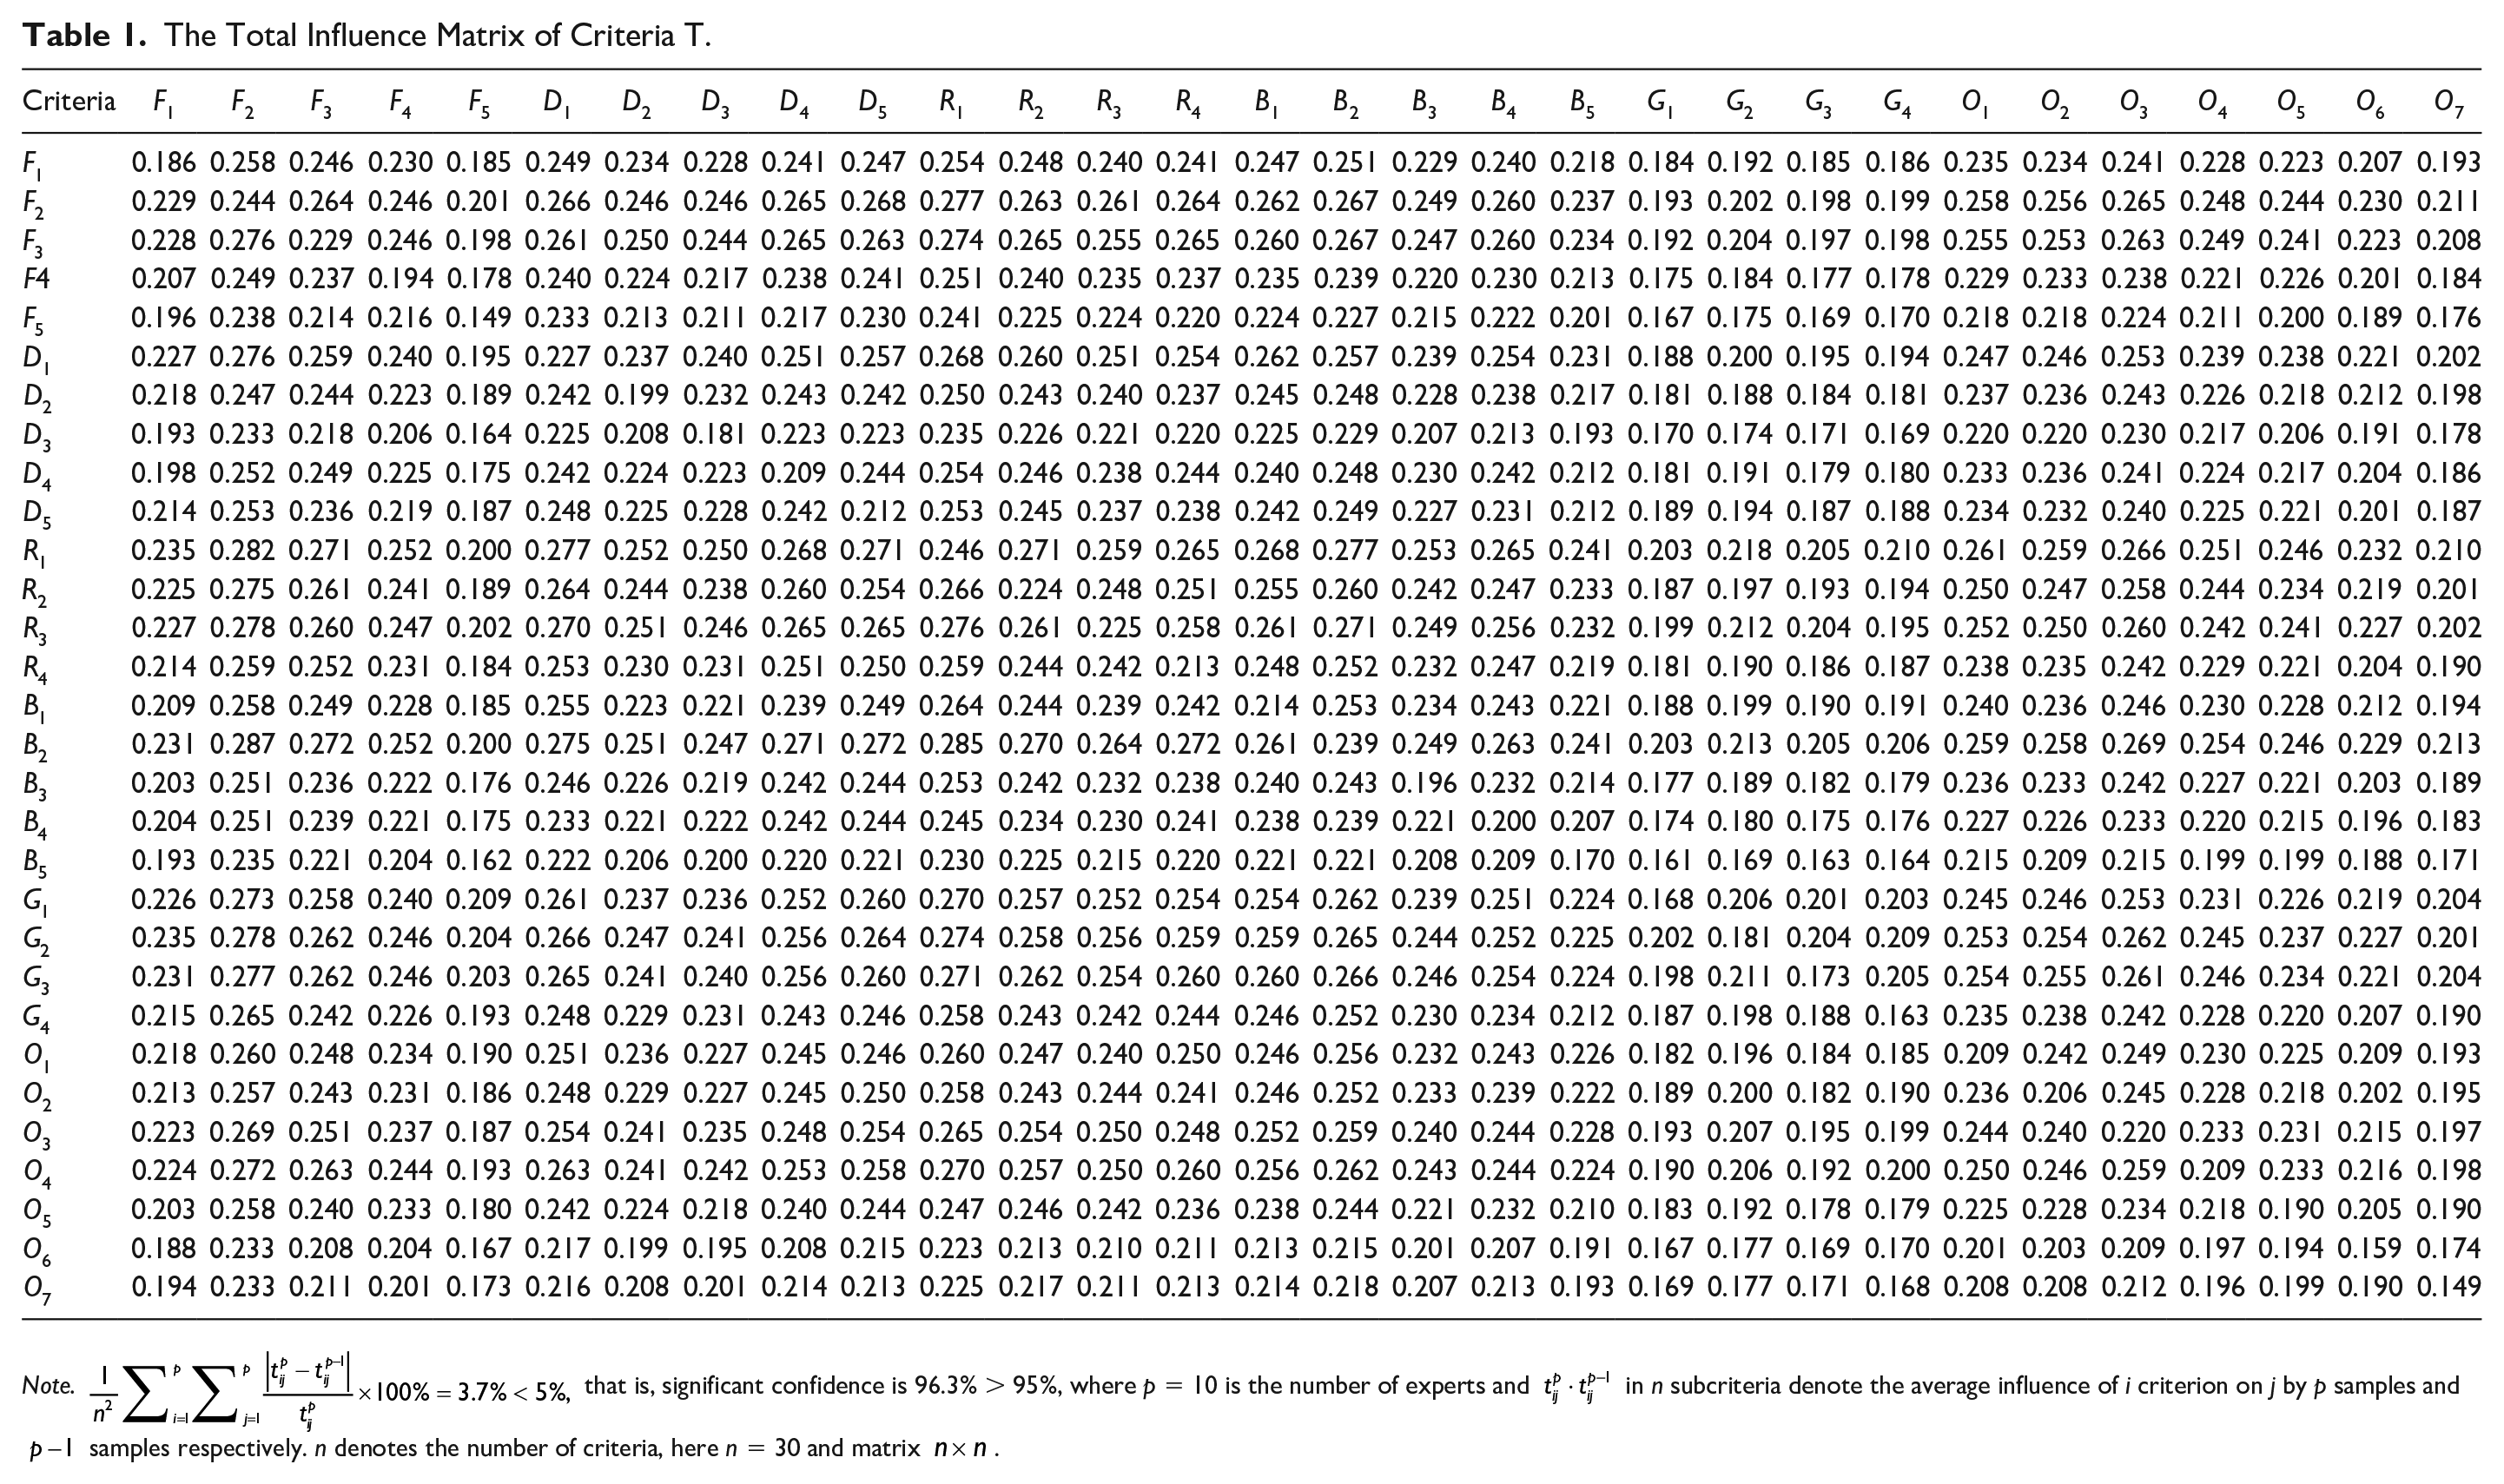
Note.
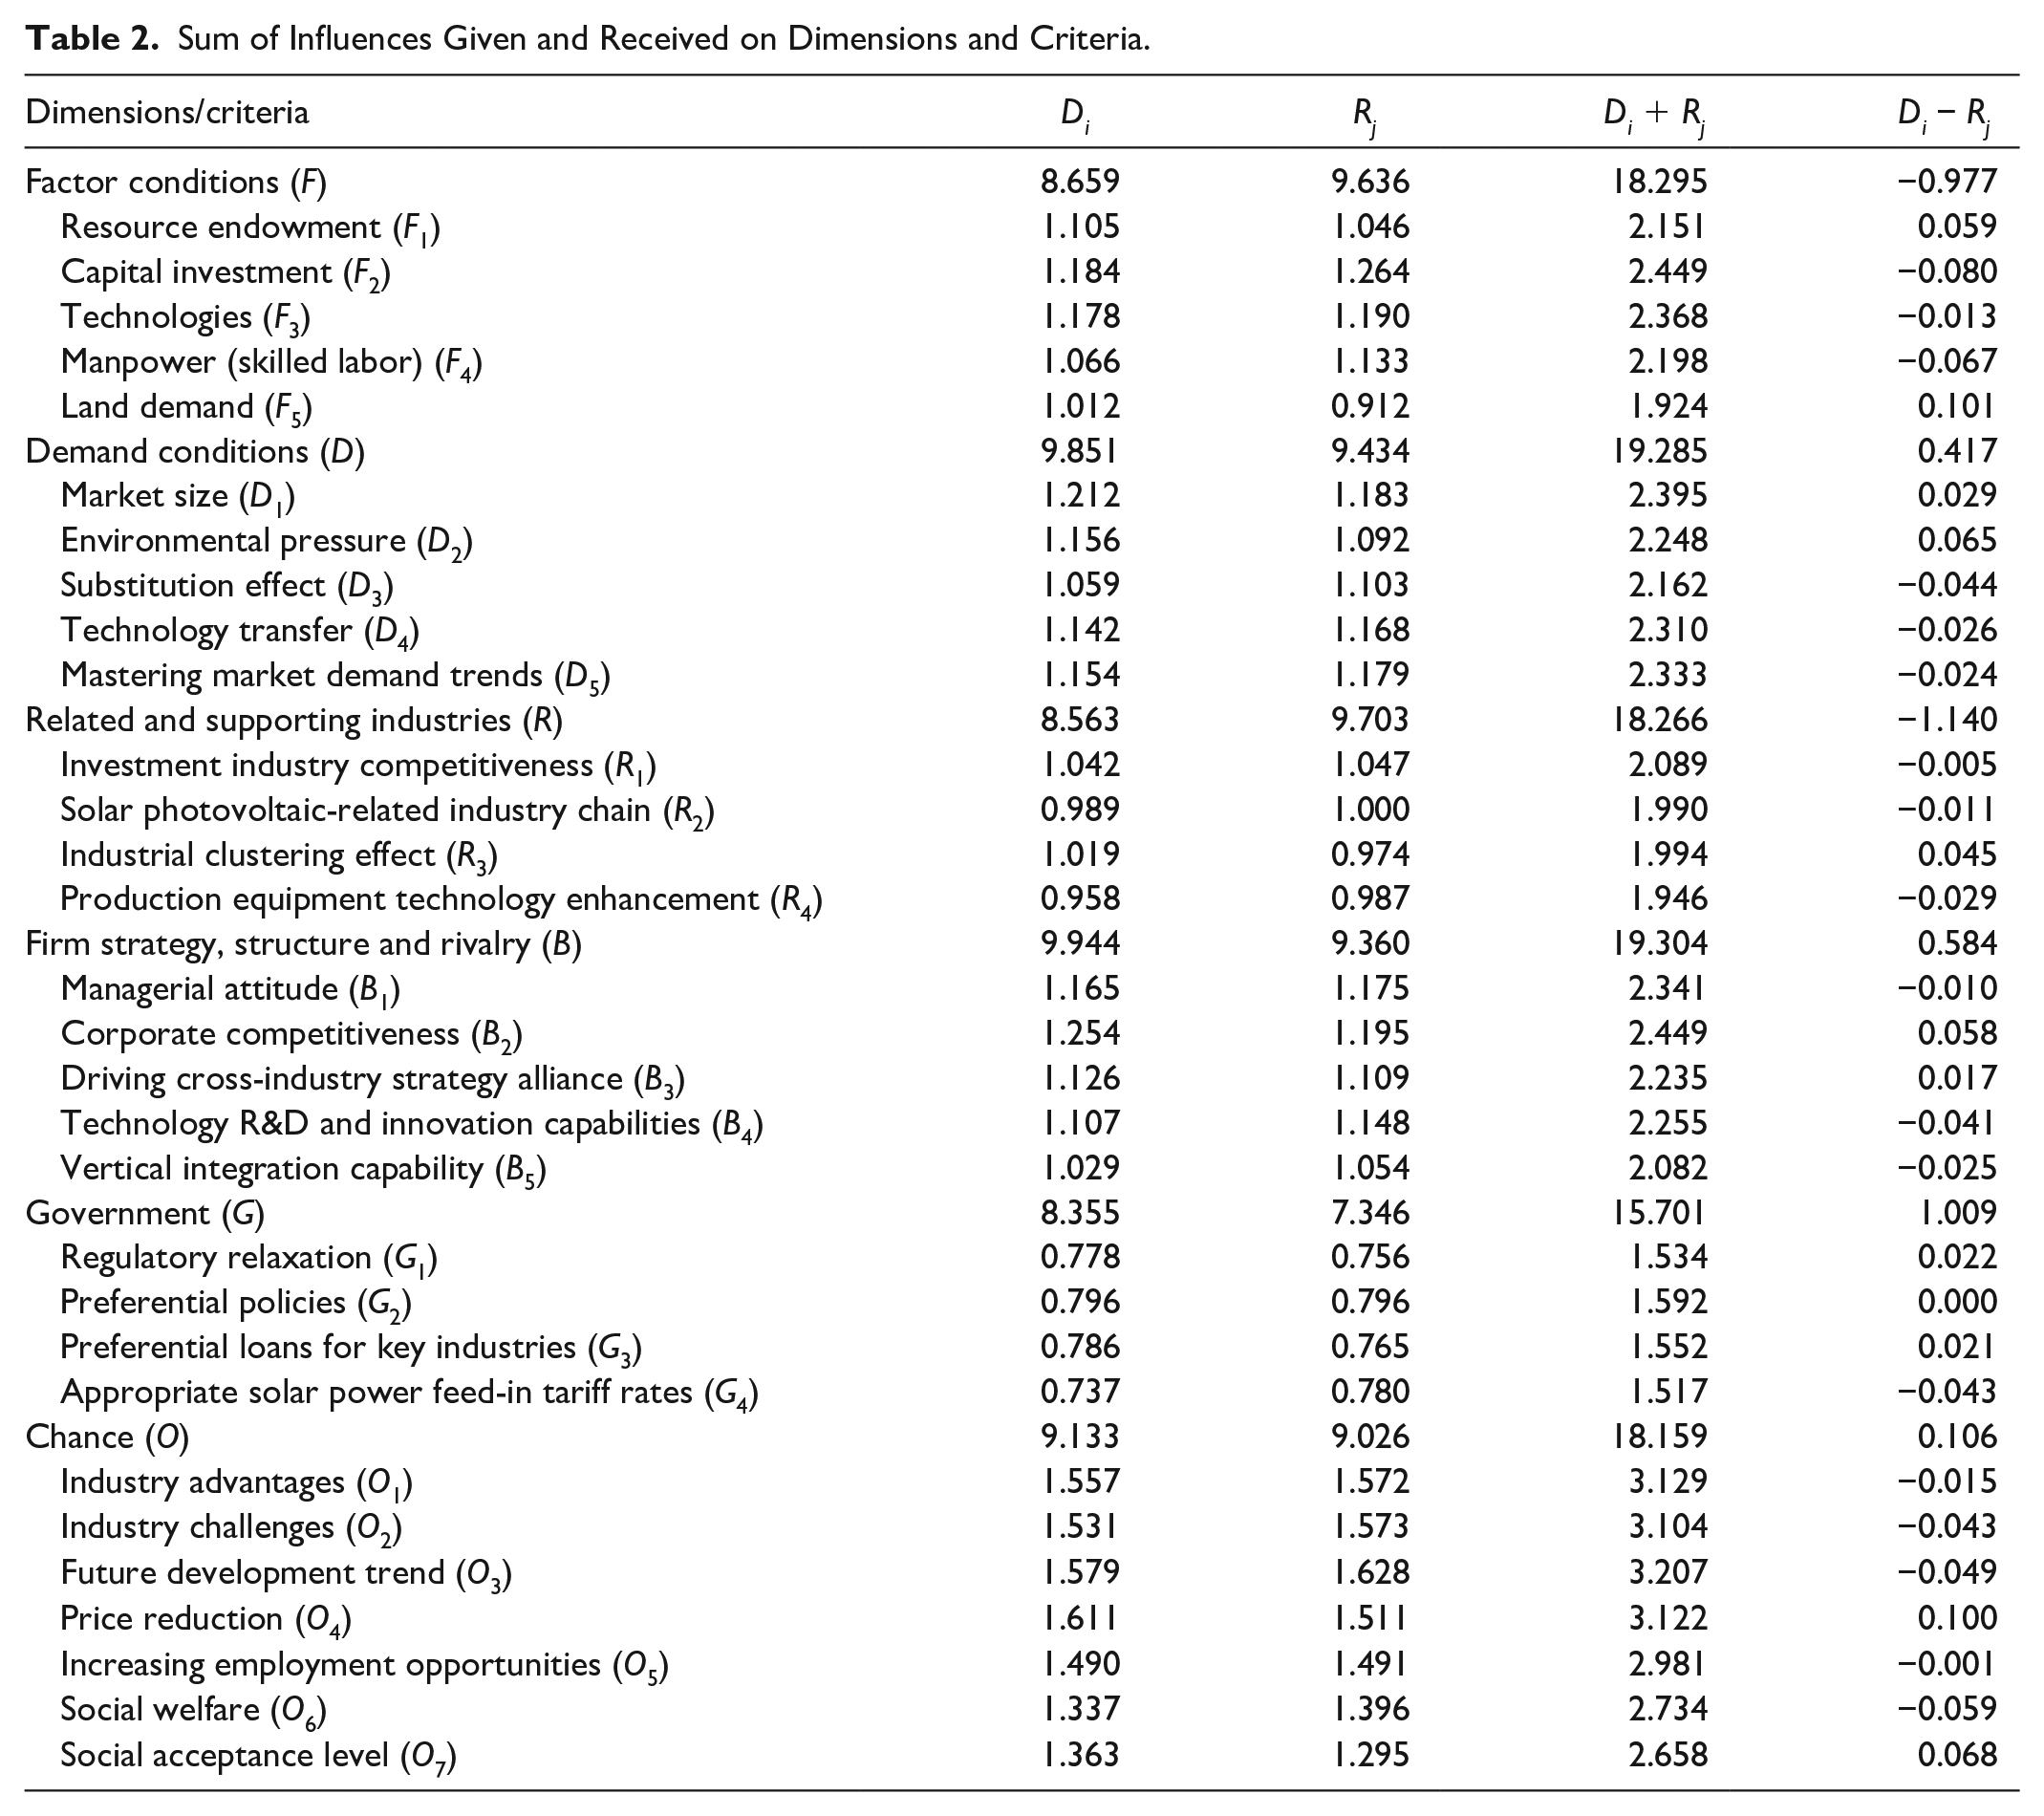
Sum of Influences Given and Received on Dimensions and Criteria.
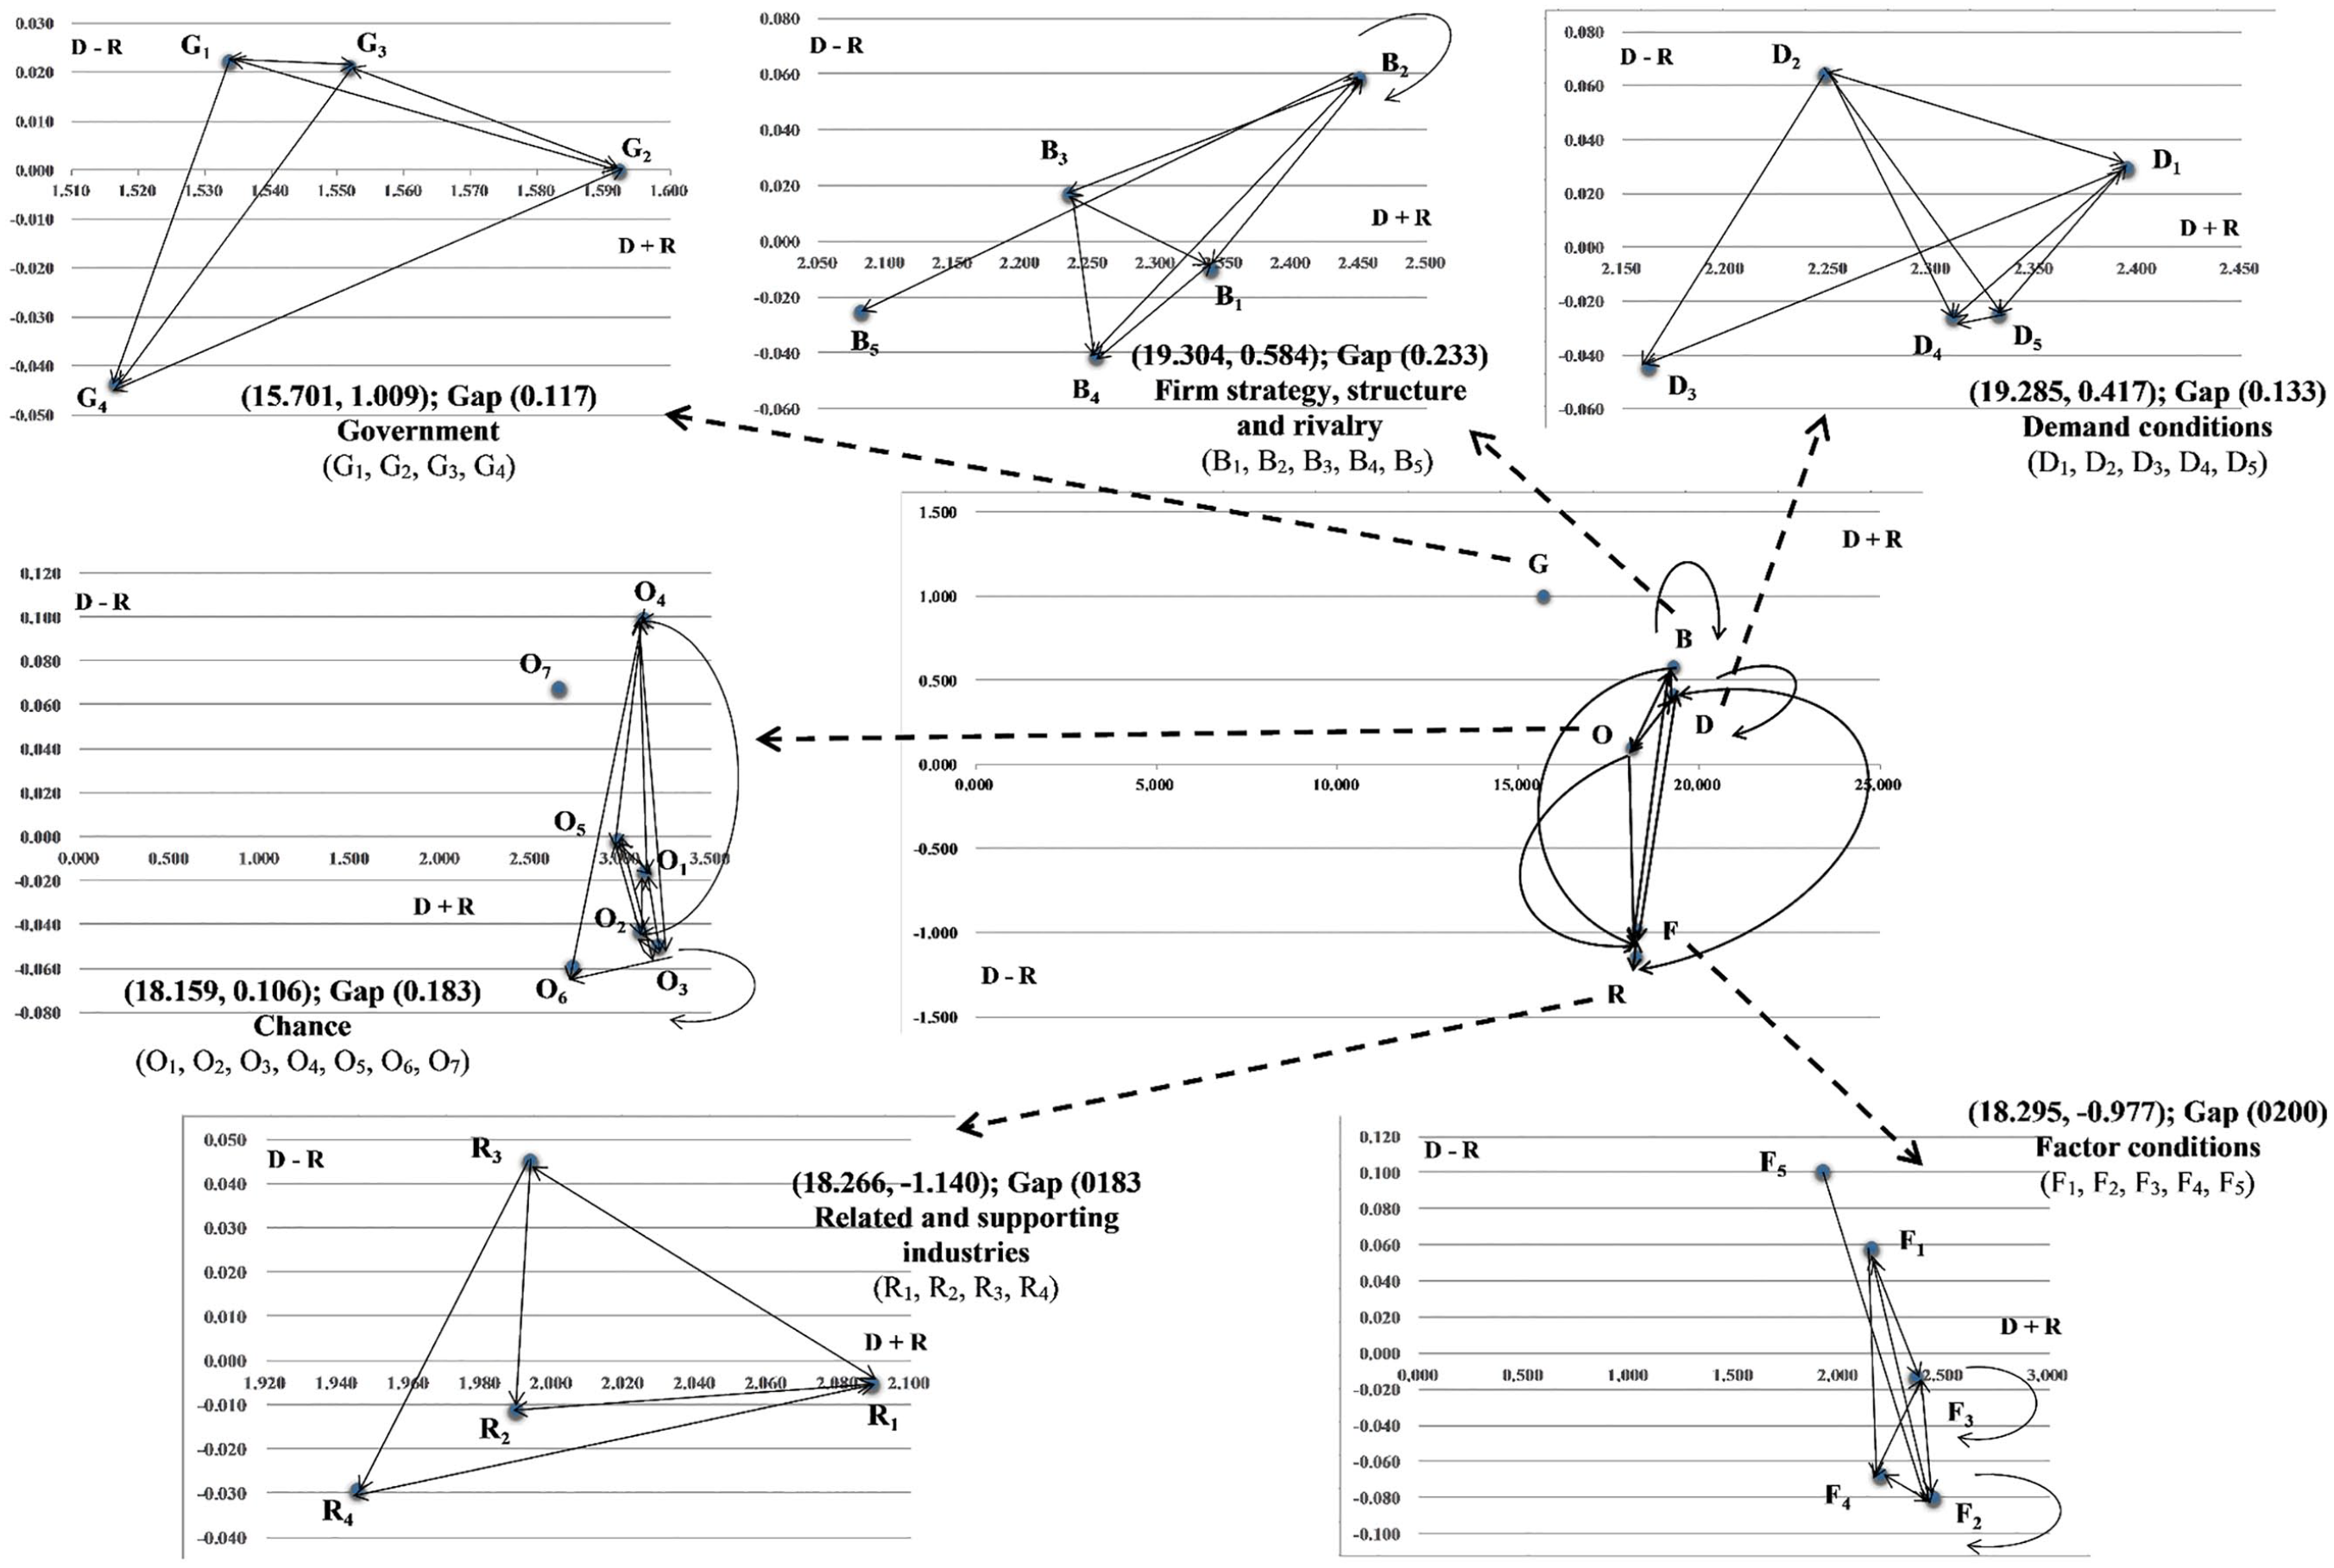
The influential network relationship map of each dimension and criteria for Taiwan’s PV industry.
In Table 2, the government (G) (Di−Rj) has the highest positive value of 1.009 but has no influence on the other dimensions (belong to individual). The firm strategy, structure, and rivalry (B) (Di−Rj) has the second-highest positive value of 0.584 and thus a stronger influence on the other dimensions. However, we observe the lowest negative value of −1.140 for related and supporting industries (R) (Di−Rj), indicating this dimension’s high vulnerability to influence. Accordingly, government (G) and firm strategy, structure, and rivalry (B) are crucial factors in the industry’s improvement policy development, while affected dimension includes related and supporting industries (R). Therefore, the improvement priorities can be sequenced as government (G); firm strategy, structure, and rivalry (B); demand conditions (D); chance (O); factor conditions (F); and related and supporting industries (R). The effect is further illustrated in Figure 3. In addition, the firm strategy, structure, and rivalry (B) (Di + Rj) dimension has the highest positive value of 19.304, exhibiting the most interactive relationship with other dimensions. It also has the most interactive dimension from the experts’ perspectives.
The network of relationships also influences each criterion. Overall, resource endowment (F1), market size (D1), investment industry competitiveness (R1), corporate competitiveness (B2), preferential policies (G2), and price reduction (O4) have a stronger influence on the other criteria. For instance, in the factor conditions (F) dimension, resource endowment (F1) exerts a direct effect on the remaining criteria, including capital investment (F2), technologies (F3), and labor (skilled labor) (F4). Thus, experts agree that the industry owning various production factors (including the amount of resources, such as labor, capital, land, technology, and management) is the most influential way to improve industrial development. In contrast, capital investment (F2) is most vulnerable to influence and should be improved last. As the improved visual service will also enhance responsible problem-solving abilities and guarantee the industry development process, photovoltaic firms can more readily attend to industry needs and become trustworthy and credible in their delivery of the promised service. Therefore, the general improvement priority can be sequenced as F1, F5, F3, F4, and F2 for factor conditions (F).
The government and related firm managers can reference the INRM network relationship map to prioritize improvement dimensions and criteria when constructing policies and strategies.
Using the DANP Technique to Find the Indicators for Influential Weights
We can confirm the influential relationships between the dimensions and criteria based on the DEMATEL results and thus obtain the influential weights using the DANP. Based on pairwise comparisons of the unweighted and weighted supermatrix, we obtain the limiting power of the weighted supermatrix and reach a steady-state condition which shows the weights of each criterion for further analysis by the modified VIKOR.
In Table 3, results indicate that the related and supporting industries (R) dimension has the largest influential weights, followed by factor conditions (F); demand conditions (D); firm strategy, structure, and rivalry (B); chance (O); and government (G). The investment industry competitiveness (0.046), photovoltaic-related industry chain (0.044), production equipment technology enhancement (0.044), and industrial clustering effect (0.043) criteria are the four most significant, followed by capital investment (0.040) and technologies (0.038). On the contrary, price reduction (0.024), increasing employment opportunities (0.024), enhancing local development and social welfare (0.022), and social acceptance level (0.020) are the least important criteria in the new model.
The Policy Development Evaluation of Taiwan’s PV Industry by Modified VIKOR.
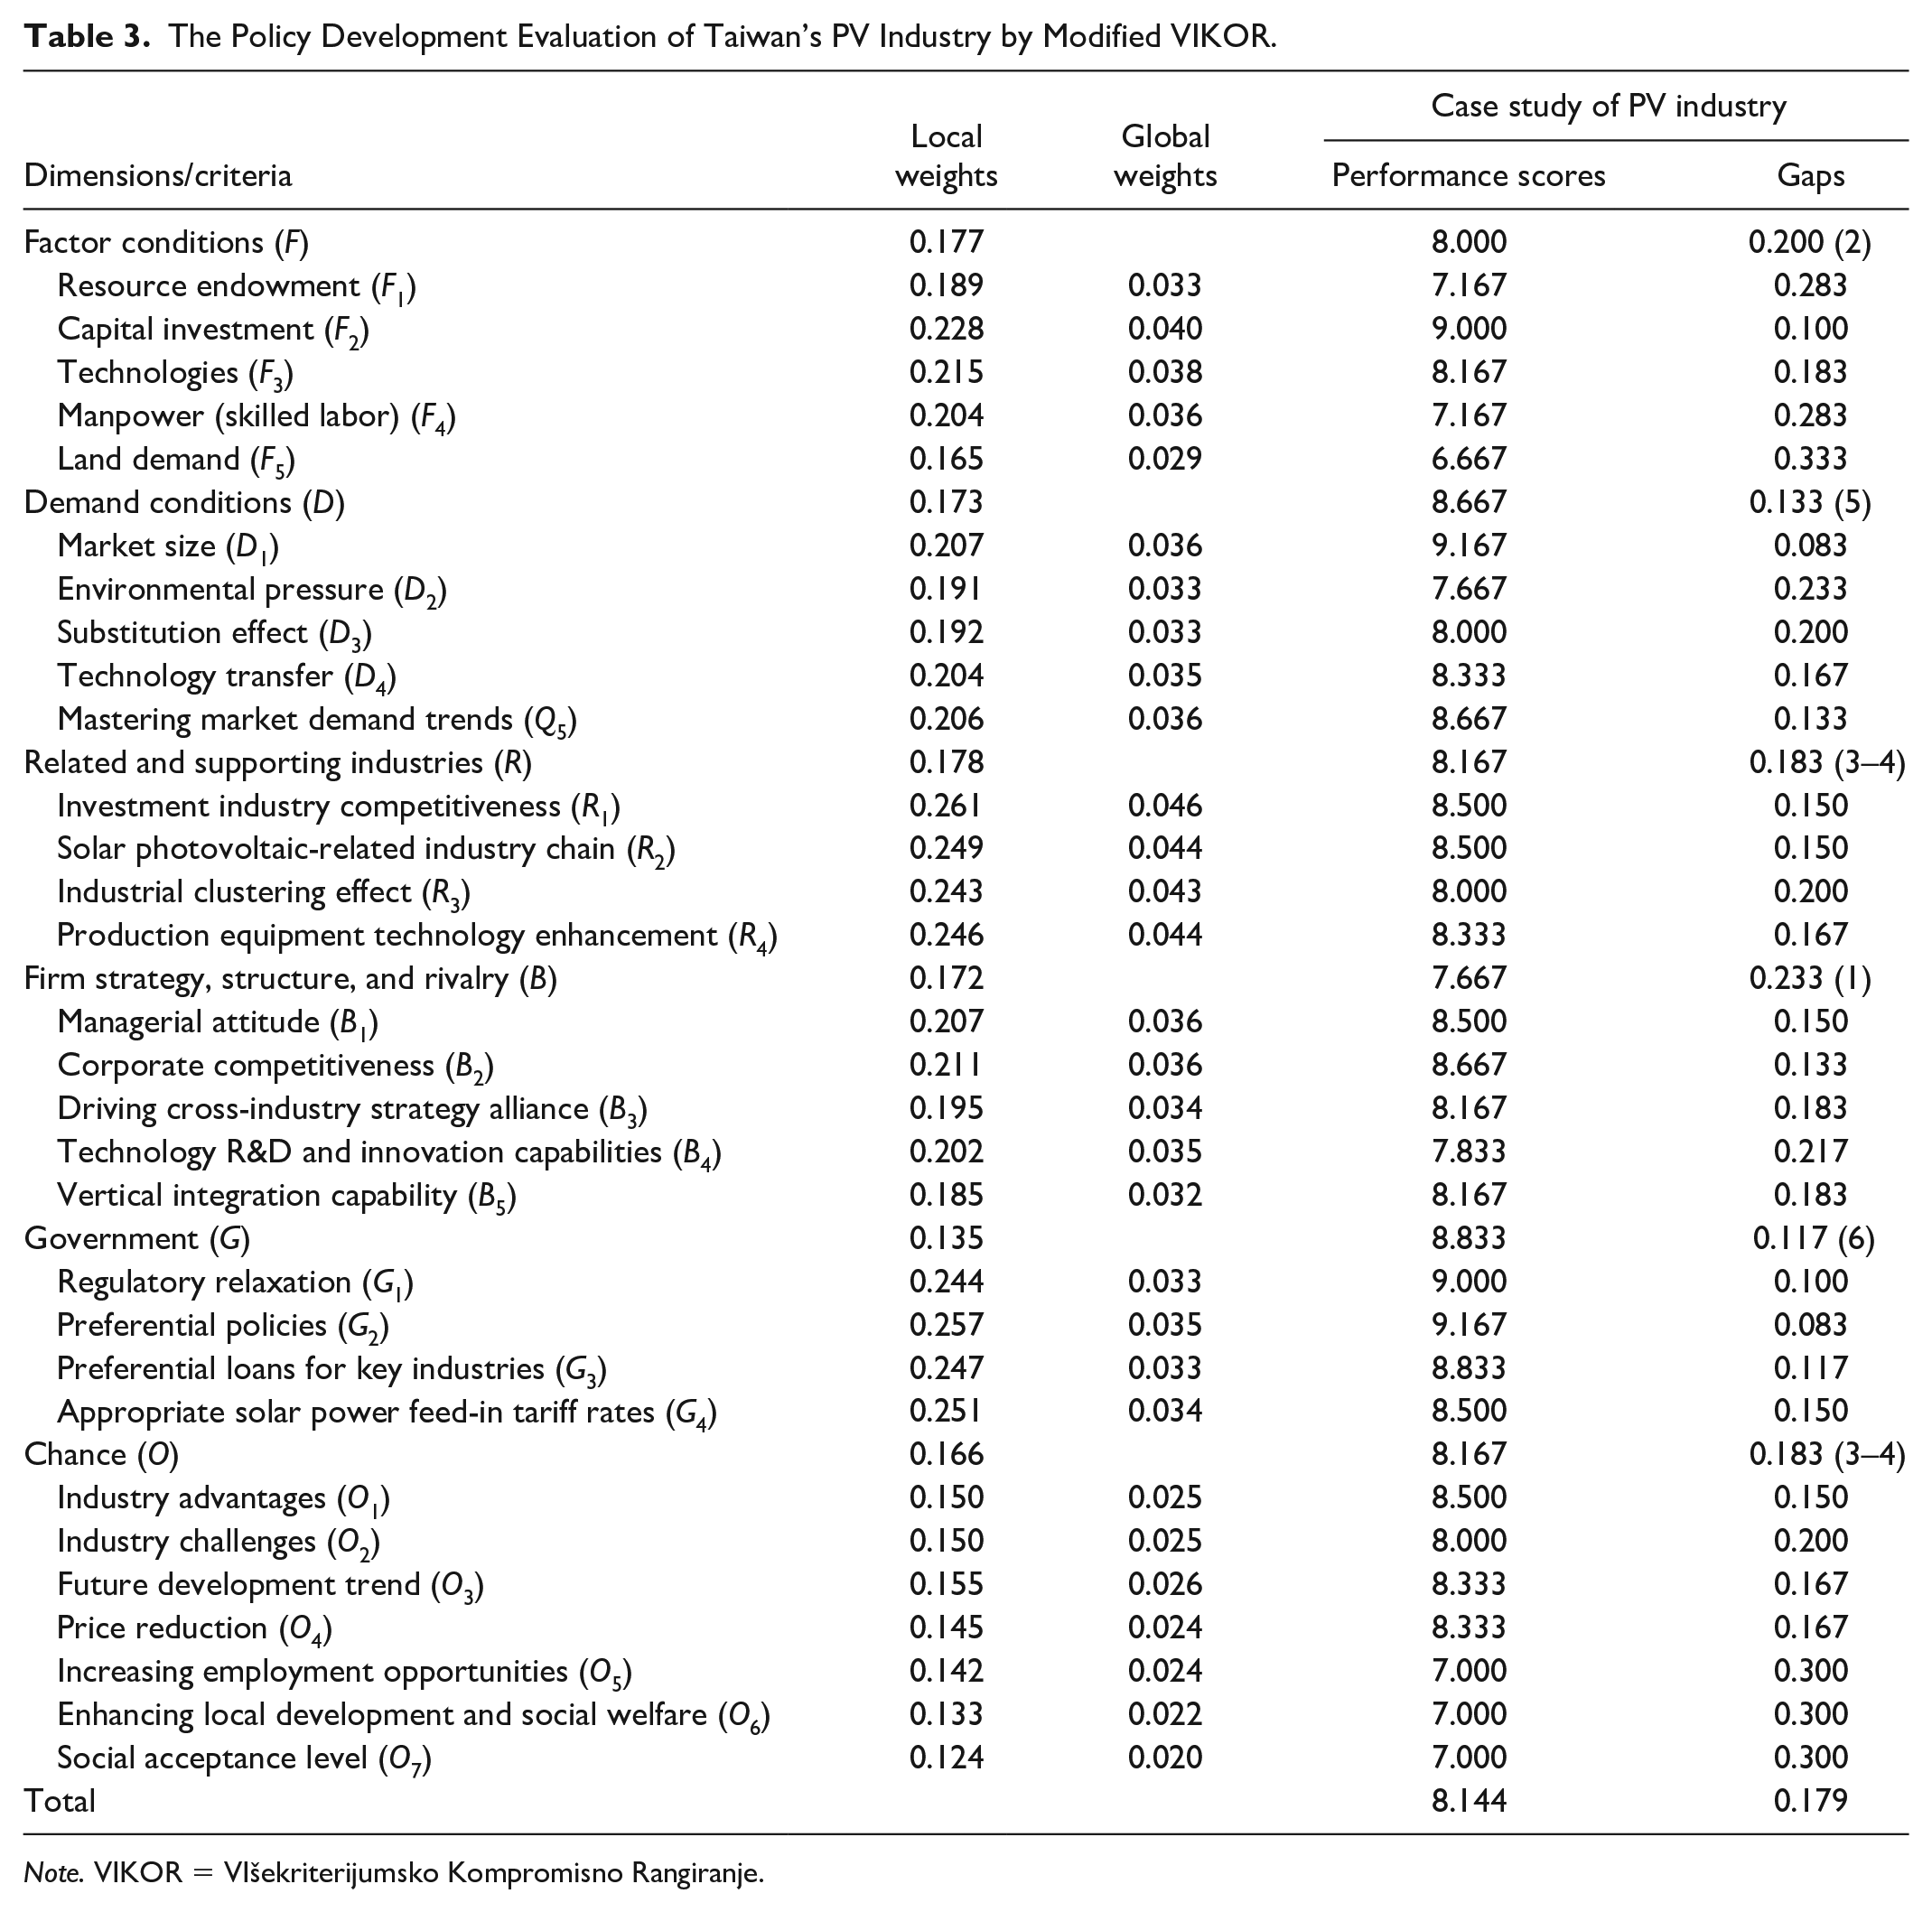
Note. VIKOR = VIšekriterijumsko Kompromisno Rangiranje.
Using the Modified VIKOR Method to Evaluate Gaps in the Photovoltaic Industry
In the second questionnaire dealing with Taiwan’s photovoltaic industry policy development, the modified VIKOR method obtains the overall industry performance (Table 3). The integrated index—either from the perspective of an overall dimension, an individual dimension, or complete criteria—allows government and firm managers to identify and solve problems. We can determine priority sequence for reaching the desired level based on the weights of the performance and gap values, from high to low.
The government (G) dimension shows the highest performance value of 8.833 and the lowest gap value of 0.117, and it is thus the most importance criterion. Comparatively, the dimension of firm strategy, structure, and rivalry (B) is the least importance dimension; it should thus have the lowest priority in terms of improvement because it shows the lowest performance value of 7.667 and the largest gap value of 0.233. If the development target is to reach the desired level, the priorities are ordered as follows: firm strategy, structure, and rivalry (B); factor conditions (F); related and supporting industries (R); chance (O); and government (G). All performance values averaged at 8.144, with 10 being the desired level. Furthermore, the gap for improvement averaged at 0.179 (to 0), indicating the scope for the industry to improve.
This principle can also be used for each individual indicator. For instance, in the factor conditions (F) dimension, the land demand (F5) criterion has the lowest performance value of 6.667 and the highest gap value of 0.333. It is thus the first criterion that must be improved to reach the desired level. This criterion is followed by resource endowment (F1), labor (skilled labor) (F4), technologies (F3), and capital investment (F2). Thus, skilled labor, key technologies required to develop the photovoltaic industry, and funds for achieving business goals such as acquisition of long-term assets (e.g., land, plants, and machinery) are crucial for improving policy development.
According to the same principle, we can sequence the priority of the criteria. Among all criteria, land demand (F5), increasing employment opportunities (O5), enhancing local development and social welfare (O6), social acceptance level (O7), and labor (skilled labor) (F4) criteria demonstrate higher gap values (0.333, 0.300, 0.300, 0.300, and 0.283, respectively). These five criteria should be improved first for the government and firm managers to achieve the desired level by reducing gaps among each dimension/criterion and then developing appropriate improvement policies and strategies.
Implications and Developing Policies and Strategies
This study has both theoretical and managerial implications. For instance, the cause and effect analysis could allow government and firm managers to improve performance based on the indicators that most significantly influence the performance of other indicators.
In Figure 3, which illustrates the dimensions and criteria of influence based on INRM, the improvement priorities are sequenced according to their degree of influence, namely, firm strategy, government, structure and rivalry, demand conditions, chance, factor conditions, and related and supporting industries. The experts interviewed in this study emphasize that the government must be assigned the highest priority because such efforts will produce network effects on industry development and positively influence competitiveness.
We then discussed the criteria in each dimension based on an INRM, as illustrated in Figure 3. For the influence relationships among the 30 criteria, resource endowment (F1) was the most influential in the factor conditions (F) and should be improved first, followed by land demand (F5), technologies (F3), labor (skilled labor) (F4), and capital investment (F2) (refer to Figure 3 for more details on the causal relationship among factor conditions; demand conditions; related and supporting industries; firm strategy, structure, and rivalry; government; and chance). Each evaluation dimension and criterion has the capacity to induce improvements in Taiwan’s photovoltaic industry. Therefore, the government and firm managers should evaluate all the dimensions and criteria for enhancing industry competitiveness using the proposed model (Figure 3).
In Table 3, improvements to the status of the industry was measured at 0.179, indicating a gap (the distance to 0). Among the six major dimensions, the firm strategy, structure, and rivalry (B) dimension had the largest gap value of 0.233; thus, it should become the first priority for improvement should the desired level be the goal of enhancing the industry. For long-term improvements, the motivation for internal operations should be managed more efficiently.
Our analyses and empirical findings formulated in Table 4 thus fulfill the study’s purpose. We suggest government and firm managers prioritize improvement policies and strategies based on these schemes and according to the order priority of the influence or gap values.
Policy and Strategic Planning for Improving Taiwan’s PV Industry Development.

Previous studies have used a combination of Porter’s diamond and DEMATEL models to explore how the competitiveness of Taiwan’s solar photovoltaic industry can be enhanced based on interactions between industrial development factors (G. T. R. Lin, 2011). G. T. R. Lin (2011) proposed a cause and effect relationship technique to assess the competitiveness of the solar photovoltaic industry using Porter’s diamond model. The researcher used six perspectives—factor conditions; local demand conditions; government support; related and supporting industries; and firm structure, strategy, and rivalry—as the framework for establishing the competitiveness evaluation indicators. Furthermore, DEMATEL was introduced within this framework to obtain the cause and effect relationships map. As indicated in the empirical results, demand conditions, government support, and related support industries are the three main factors that affect the competitiveness of the country’s solar photovoltaic industry.
However, G. T. R. Lin’s (2011) study does not include indices’ weights or gap analysis, nor does it consider important issues, for example, how to enhance the solar photovoltaic industry’s competitiveness from a chance perspective. Therefore, we are currently developing a more comprehensive approach to assess the competitiveness of the solar photovoltaic industry using a hybrid MADM model (Tsai, 2020; Tsai et al., 2020). Thus, in this study, we adopted a more comprehensive assessment approach using the MADM hybrid model, which combines the DEMATEL-based ANP that detects influential weights and the modified VIKOR method. The proposed model can assess the solar photovoltaic industry’s competitiveness while facilitating the development of improvement polices that reduce gaps in dimensions and criteria to enhance the industry’s competitiveness. Our results demonstrate that the six dimensions should be upgraded in the following order of priority, which differ from G. T. R. Lin’s (2011) results: firm strategy; government, structure, and rivalry; demand conditions; chance; factor conditions; and related and supporting industries.
In summary, the analysis of literature on the solar photovoltaic industry’s competitiveness assessment clearly shows that different criteria, techniques, and methods can be used in this field. Hence, our proposed framework based on Porter’s diamond model and the combination of the DEMATEL-based DANP with a modified VIKOR approach considers these factors. This method offers a more complete decision-making model specifically designed to solve the problems of competitiveness assessment for the solar photovoltaic industry after the COVID-19 pandemic crisis.
Therefore, this study provides practitioners who manage solar photovoltaic firms with a process involving the use of an algorithm. Using this algorithm, they can identify the real important dimensions and criteria for assessing the competitiveness of the solar photovoltaic industry based on Porter’s diamond model and 30 indices, rather than using their experiences or a traditional assessment angle. Furthermore, with this more accurate assessment, they can formulate the best policy for improvement, especially in the aftermath of the COVID-19 pandemic crisis.
Conclusions
There are significant benefits to addressing the needs of photovoltaic firms and encouraging investments in them. We thus proposed a hybrid evaluation model for industry policy development that could help identify key performance indicators that could enhance this industry’s international competitiveness.
To explore the causal relationship between the six dimensions of industry development performance as well as their key criteria, we adopted a hybrid MADM model combining DEMATEL, DANP, and modified VIKOR. Among all our evaluations, those provided by the experts produced the most useful results, yielding the following improvements in priority order: firm strategy; government, structure, and rivalry; demand conditions; chance; factor conditions; and related and supporting industries. The average gap between the actual and desired levels of industry development performance was 0.179, illustrating the gaps in performance. The implications of these results for improvement policies and strategies are reported in Tables 3 and 4.
This study provides three major contributions: First, the evaluation of Taiwan’s photovoltaic industry development performance is an MADM problem with dependence and interaction indicators. We reviewed the literature and interviewed experts to construct six dimensions and 30 criteria as a result.
Second, we adopted three MADM approaches—DEMATEL, DANP, and modified VIKOR—to construct a hybrid evaluation model of industry development performance that prioritizes the influential weighting of dimensions and criteria. It also shows gaps in the industry development performance. The proposed hybrid technique not only handles the causal relationships within a set of dimensions and criteria but also produces more valuable information with which to create an INRM for efficient decision-making by relevant parties.
Finally, the findings indicate that the analysis results are valid. Analyzing the evaluation results can help the government and firm managers identify key criteria, facilitating weighting, or gap evaluations. These results are thus useful for determining the best approaches to improve the photovoltaic industry’s development performance.
There are, however, some limitations in this study. First, the evaluation indicators were selected from the literature on renewable energy. Other approaches, such as qualitative analysis, could have been used to identify other possible indicators.
Second, future researchers can use different MADM models to evaluate the relative weights of influence on the evaluation of industry development performance.
Finally, we hope that this study will contribute to enhancing the international competitiveness of the photovoltaic industry by improving its policies and strategies. We believe these results can help experts decide how to implement their strategic operations more effectively. Thus, we provide a good practical reference model to help Taiwan’s photovoltaic industry develop its international competitiveness.
Footnotes
Acknowledgements
The authors wish to thank three anonymous referees and the editors for their valuable comments and suggestions which helped in improving the quality of this paper.
Declaration of Conflicting Interests
The author(s) declared no potential conflicts of interest with respect to the research, authorship, and/or publication of this article.
Funding
The author(s) disclosed receipt of the following financial support for the research, authorship, and/or publication of this article: This research received specific grant from the Ministry of Education of Taiwan (grant no. 107 G 0049).