
Abstract
The aim of this study was to explore the association between travel mode choice and individual sociodemographic characteristics among urban city dwellers, as the selection of daily travel modes is influenced by several factors. The study collected 1,290 short daily trips data from 415 respondents living in Klang Valley using a random sampling technique. Logit regression models were utilized to identify the impact of sociodemographic traits on travel mode choices. Men, low education levels, students, and households without children and do not own private vehicles are more likely to choose active transportation. Besides, the study examines the potential for greenhouse gas (GHG) emission reduction. Based on Life Cycle Assessment (LCA), 142 kgCO2e or 108 kgCO2e/km of GHG were released by automobiles from the collected travel trip data. The result shows that active transport could potentially achieve 14.52% GHG emission reduction by stated preference and nearly 17% GHG emission reduction by criteria fulfillment. These findings could provide valuable information for developing practical planning policies aimed at reducing GHG emissions from the road transport sector.
Plain Language Summary
The purpose of this study was to investigate how individual sociodemographic traits influence travel mode choices among urban residents in Klang Valley, Malaysia. The study collected data from 415 participants regarding their daily short trips. It discovered that men, individuals with lower education levels, students, and those without private vehicles tended to prefer active transportation like walking or cycling, whereas women, highly educated individuals, and vehicle owners were more inclined to drive. Additionally, the study examined the environmental impact of different travel modes, revealing that cars produced the highest greenhouse gas emissions, followed by motorcycles and buses. In contrast, cycling generated the least emissions. Notably, active transport, such as walking and bicycling, had the potential to reduce emissions by 14.52% for short car trips and 3.66% for short walking trips. The findings suggest the importance of considering sociodemographic factors when planning transportation policies. Policymakers can encourage those who drive to shift to more sustainable modes of transport, like public transportation or active travel, especially for short distances. This shift has the potential to reduce carbon emissions and benefit both individuals and the environment.
Keywords
Introduction
The global road transportation sector contributes significantly to greenhouse gas (GHG) emissions, with a share of 11.9% in total GHG emissions (Ritchie, 2020). Despite the focus of transportation sustainability on technological innovations and pollutant-reducing policies in previous studies on (Y. Yang et al., 2017), there is a growing recognition of the importance of shifting toward more sustainable modes of transportation, such as active transport, to effectively address the problem of pollutant emission (Creutzig et al., 2018; Kwan et al., 2017). In response, a substantial amount of research has been conducted to explore the substitution of short car trips with active transportation in order to inform policymakers in developing effective mitigation policies (Castro et al., 2019; Li et al., 2018; Neves & Brand, 2019).
Prioritizing short-distance active transportation, such as walk and bicycling, in cities like Klang Valley is imperative to address pressing concerns related to public health and environmental sustainability, as well as to overcome the challenges posed by urban growth and car dependency (Shokoohi & Nikitas, 2017). Despite the fact that short distance trips are responsible for a significant portion of trips in major cities, they have received limited attention in urban transportation planning practices in recent decades (J. Yang et al., 2015; Zhu, 2022). As a result, comprehensive research on this topic is considered essential (Zhu, 2022).
The study of travel mode choice has gained popularity among researchers and planners, and it is crucial to estimate travel demand in order to plan and develop transportation policies (Qian et al., 2021). While previous studies on low-carbon development in the transportation industry have focused on technological advancements and emission-reducing regulations (De Gennaro et al., 2016; Y. Yang et al., 2017), there is a growing emphasis on the effectiveness of shifting toward less-polluting modes of transportation, such as active and public transportation, in reducing transportation-related carbon emissions (Kwan et al., 2017; Macioszek & Cieśla, 2022). This has led to an increased focus on travel mode choice research to better inform policymakers (Kunhikrishnan & Srinivasan, 2018; Li et al., 2018). Understanding the key variables that affect travel mode choice is crucial for developing effective carbon mitigation policies and initiatives (Kotval-K & Vojnovic, 2015).
Several studies have explored the relationship between travel mode choice and built environment factors, such as land use density, street design, distance, destination accessibility, and sociodemographic factors (Ali, de Azevedo, et al., 2021; Chen et al., 2022; Kotval-K & Vojnovic, 2015; Motomura et al., 2018; Ton et al., 2019). However, the complexities of travel mode choice, which can also be influenced by individual sociodemographic characteristics, are not fully understood through studies of the built environment alone (Ali, Dharmowijoyo, et al., 2021; Li et al., 2018; Mytton et al., 2016; Saigal et al., 2021; Tao et al., 2022). The choice of transportation mode is significantly impacted by individual sociodemographic characteristics (Wójcik, 2019), making it important to recognize the factors that influence different subgroups of the population in their travel mode choice. This is essential in promoting a shift toward more sustainable modes of transportation, which can improve air quality, reduce traffic congestion, and enhance quality of life.
Over the years, numerous studies have been conducted on travel mode choice and its relationship with sociodemographic characteristics (Dėdelė et al., 2020). Past literature has examined this relationship in various countries, including developed countries such as the United States (Yum, 2019), the United Kingdom (Keyes & Crawford-Brown, 2018), and Sweden (Hagberg & Holmberg, 2017), as well as developing countries such as Brazil (Henning et al., 2020), China (Zhang et al., 2017), and India (Saigal et al., 2021), and even least developed countries such as Ghana (Siiba, 2020). However, there is a need for more research on this topic in the Malaysian context, as the impact of specific sociodemographic characteristics on travel mode choice can be specific to the study area (Motomura et al., 2018; Papaioannou & Martinez, 2015).
This research is conducted to bring valuable insights into urban transportation in Klang Valley, Malaysia. Its distinctive feature lies in the fusion of sociodemographic analysis with environmental assessment, making it an invaluable resource for policymakers and urban planners. By understanding how individual characteristics influence travel mode choices and quantifying the potential for greenhouse gas emission reductions, this study equips decision-makers with practical knowledge to develop tailored, effective policies for sustainable urban mobility. In doing so, it addresses critical urban challenges, enhances environmental sustainability, and improves the overall quality of life for residents in the region.
In the field of transportation research, two widely used methods for collecting data on travel mode choice and developing models to represent travel behavior in various situations are the revealed preference (RP) and stated preference (SP) surveys. The aim of RP-based travel mode choice models is to describe and predict travel behavior based on actual data and current travel mode choices of survey participants (Cumming et al., 2019). On the other hand, SP-based travel data is based on presenting participants with hypothetical scenarios and asking them to choose from a set of options (Louviere & Woodworth, 1983). This method offers more control and flexibility as the investigated settings are constructed using designated statistical approaches, which allows for the derivation of significant design components that RP-based models cannot (Louviere & Hensher, 1983).
In addition to that, according to the theory of planned behavior (TPB), intention as a personal motivation is a crucial predictor of behavior and mediates the influence of attitude, subjective norms, and perceived behavioral control (Ajzen, 1991). Therefore, it is important to understand the public’s intention and predisposition toward a shift to sustainable travel modes (Rybarczyk & Gallagher, 2014; Zavareh et al., 2020). Despite its significance, the intention to use a particular mode of transportation has received little attention in previous research (De Vos et al., 2022). However, previous findings suggest that the intention to use a specific mode of transportation has a significant impact on travel mode choice (Jing et al., 2019; Pojani et al., 2018) and is influenced by the attitude toward that mode of transportation (Jia et al., 2018; Jing et al., 2019; Ru et al., 2018). As mode shift is a cost-effective approach to decarbonize the transportation sector (Salvucci et al., 2019). Recent studies have quantified the environmental benefits of mode shifts to active transport (Delso et al., 2018; Neves & Brand, 2019), car-sharing (Carrone et al., 2020; Ceccato & Diana, 2021), e-bikes (Bieliński et al., 2021), and rail transport (Kwan et al., 2018) using mode substitution.
Furthermore, mode-specific emission factors are important for accurately assessing the environmental impact of different transportation modes because they consider the unique energy and emission characteristics of each mode. The study uses Life Cycle Assessment (LCA) as a sustainability tool to track and assess the global environmental impacts of a product from a systems perspective (Hellweg & Canals, 2014). The LCA, following the ISO 14040 (LCA principles and framework) and ISO 4044 (LCA requirements and guidelines), consists of four main steps: goal and scope definition, Life Cycle Inventory (LCI) assessment, Life Cycle Impact Assessment (LCIA), and results and interpretation (Goh et al., 2022). This study uses LCA to compare the GHG emissions of different travel modes, such as bicycle, bus, car, and motorcycle.
This research aims to investigate the influence of individual sociodemographic characteristics on travel mode choice among urban city dwellers in Klang Valley, assess the potential for reducing greenhouse gas emissions from the road transport sector through mode shifts, and provide insights for the development of effective policies to mitigate emissions in urban environments. The hypotheses include expectations that sociodemographic factors like gender, education level, occupation, and household composition will significantly impact travel mode choices, as well as the potential for substantial greenhouse gas emission reduction through mode shifts, assessed using both stated preference and criteria fulfillment methods.
The methodology of the study is first presented in Section 2. Followed by the results and discussion of the descriptive statistics output and logistic regression models of active transport mode choice, public transport mode choice, and private transport mode choice. Section 3.5 presents the pattern of short car trips in the study area and results of the LCA of each travel mode choice. This is followed by an evaluation of the potential for short car trips to be substituted with walking and biking, based on distance, stated travel time preference, and the intention of adopting a sustainable travel mode. The GHG emission avoidance resulting from the potential substitution of short car trips is then examined using data collected from travel diaries. Section 3.11 presents the potential GHG emission avoidance by fulfilling sociodemographic criteria. The paper concludes with a review of the key results and a discussion of how walking and biking may contribute to making the Klang Valley a low-carbon transportation city.
Materials and Methods
Case Study Site
Located near the equator, Malaysia experiences a hot, humid, and rainy climate year-round. According to the United Nations Development Programme (UNDP, 2020), Malaysia has a Gross Domestic Product of 336.7 billion USD and a Human Development Index (HDI) score of 0.810. Figure 1 shows the map of Klang Valley. The choice of Klang Valley as the case study is well-founded as it offers a comprehensive snapshot of transportation dynamics in Malaysia’s metropolitan areas. This region encapsulates the Federal Territory of Kuala Lumpur, the Federal Territory of Putrajaya, and several populous towns and cities in Selangor state. As Selangor accounts for a substantial 21.6% of the nation’s population, and with Klang Valley featuring highly urbanized and densely populated areas, it serves as an ideal representation for studying the impact of ongoing motorization trends, urbanization, and their associated challenges on transportation and energy consumption patterns within Malaysia’s metropolitan landscapes (Department of Statistics Malaysia, 2022).

Map of Klang Valley, Malaysia.
The motorization trend continues unabated in Malaysia. According to the latest transportation statistics, the total number of registered in-use motor vehicles increased by 2.52% in 2020. Specifically, the number of passenger vehicles increased by 2.57%, while the number of taxis declined by 5.11%. Meanwhile, motorcycles increased by 2.25% and freight vehicles increased by 4.35%, while the number of buses decreased by 8.09% (Department of Environment Malaysia, 2020; Ministry of Transport Malaysia, 2021). The transportation sector remains a significant contributor to energy consumption, responsible for 38.5% of the national energy consumption and emitting 61.0 Mt of carbon dioxide into the atmosphere annually (Suruhanjaya Tenaga, 2019).
The questionnaire was distributed among the respondents to investigate their modes of transportation for daily commutes to nearby neighborhood amenities such as local markets, places of worship, public transportation stations, workplaces, or schools. Based on their travel mode choice, the respondents were categorized into three different groups: active transportation users, public transportation users, and private transportation users. The active transportation category includes only human-powered modes of transportation, such as walking and cycling. The public transportation category encompasses local group travel systems, such as buses and trains. Meanwhile, the private transportation category includes modes of transportation that are exclusively for personal or individual use, such as cars, motorcycles, and hired taxis.
Questionnaire Survey
In this study, both revealed preference (RP) and stated preference (SP) methodologies were employed. RP survey was used to gather the sociodemographic characteristics and current travel mode choices of the survey participants. As the research evaluates the potential for avoiding greenhouse gas (GHG) emissions by examining the road users’ intention to switch to active transport in an urban neighborhood setting, the latter part of the questionnaire employed an SP survey of diversion factors (Fearnley, Flügel, & Killi, 2018). The focus of the study was on the diversion of travel mode choice from cars to active transport modes such as walking and biking, resulting from improved infrastructure scenarios. A simple hypothetical question, such as “Imagine that the active transport infrastructure was improved, would you consider shifting to active travel from your current car mode?” was used. The analysis of the responses to this SP question provides insight into GHG emission avoidance concepts.
Overall, a quantitative approach was employed. Microsoft Excel was used for emission calculations and the Statistical Package for Social Science (SPSS) was utilized for descriptive analysis. The questionnaire consisted of three sections, as summarized in Table 1. The study’s target audience was city dwellers in Klang Valley, Malaysia, and data was collected through a combination of hardcopy and online surveys. Hardcopy surveys were distributed to local neighborhood representatives and members of parliament, while the online survey was administered via Google Form. A simple random sampling method was used for the study, and the sample size was determined using the Raosoft digital sample size calculator. Based on the population of Klang Valley, which is approximately 9.08 million people (Department of Statistics Malaysia, 2022), and with a margin of error of 5% and a confidence level of 95%, the minimum survey sample size was calculated to be 385.
Section of the Questionnaire.

The sample was segmented based on several sociodemographic traits, as listed in Table 2. These traits include gender, age, ethnicity, body mass index (BMI), marital status, education level, occupation status, socioeconomic level, presence of children in the household, private motorized vehicle ownership, and public transport subscription. The descriptions for each trait can be found in Table 2.
Description of Explanatory Variables.

Statistical Analysis
Previous research has indicated that the discrete choice model is the most widely used and suitable approach for studying similar topics (Henning et al., 2020; Li et al., 2018; Saigal et al., 2021; Wójcik, 2019). To investigate the effects of distinct sociodemographic traits on the urban travel mode, this research employs a logit regression model. Logistic regression analysis is a widely used method for studying travel mode choice (Li et al., 2018; Masoumi, 2019; Saigal et al., 2021; Yum, 2019). Prior to logistic regression analysis, a univariate analysis is conducted using the Pearson’s chi-square test to assess the bivariate dependency between the categorical datasets of travel mode choice and specific sociodemographic characteristics (Dėdelė et al., 2020; Li et al., 2016). The logistic regression model, which aims to identify the impact of individual sociodemographic characteristics on travel mode choice, includes active transport mode choice, public transport mode choice, and private transport mode choice as independent outcome variables, entered as dichotomous variables (1 if the travel mode was chosen, and 0 if not). Logistic regression is used to examine the relationship between a binary response variable, and one or more independent variables are called covariates (Dėdelė et al., 2020; Saigal et al., 2021). The logistic regression model can be written as equation (1) (Li et al., 2018; Saigal et al., 2021).

where P is the probability of the outcome variable being equal to 1 (if the studied travel mode was chosen), β0 is the model constant, Xi is categorical explanatory variable, and βi is the regression coefficient to be estimated.
Adjusted odds ratio (aOR) controls for other predictor variables in a model and indicates how predictors interact with one another. A factor is considered preventive if its aOR is less than 1, and a risk factor if aOR is greater than 1. Confidence intervals (CI) are ranges of values that likely include the actual odds ratio values. CI is calculated using the normal distribution. An odd ratio greater than 1 that does not fall within the 95% CI indicates a risk factor. Nagelkerke R Squared measures the strength of the relationship between the model and the dependent variables on a scale of 0 to 1. Deviance, or -2 log-likelihood (-2LL) statistic, indicates the degree of unexplained variation in the logistic regression model. Higher deviance values indicate less accurate models, but there is no set formula or rule for the value since it depends on the sample size.
In this study, the thresholds for statistical significance were set at 0.1, 1, and 5%. Any correlation with a p-value higher than 5% is considered non-significant. The goodness of fit for logistic regression models was assessed using Hosmer-Lemeshow statistic, which tests whether the observed event rates match the expected event rates in subgroups of the model population. A significance value of less than 0.05 indicates a poor model fit (Nattino et al., 2020). Statistical Package for the Social Sciences (SPSS) was used for all statistical analysis.
Life Cycle Assessment of Different Travel Mode
The study employed SimaPro LCA software, version 9, which utilizes the Ecoinvent database libraries version 3.6 to conduct LCA. The functional unit for the analysis was passenger-kilometer and kilometer of travel for each mode of transportation. The corresponding Ecoinvent LCI for the various modes of transportation, consistent with this functional unit, is provided in Table 3.
Ecoinvent LCI Selected for the Analysis.

Estimation of GHG emission
When developing the mathematical model of GHG emission avoidance, four intervention scenarios ranging quarterly from 25 to 100% were simulated. Walking emissions were categorized as zero (Abdallah et al., 2019; Bel & Rosell, 2015), and the GHG emission factor derived from the LCA was subsequently adapted for this study. The total passenger kilometers (pkm) by transportation mode served as the basic indicator for calculating GHG emissions throughout the study. GHG emissions were calculated by summing the distance travelled by each travel mode type with its corresponding emission factor. The following formula was used to calculate GHG emissions (Brand et al., 2013; Y. Yang et al., 2018):

where the subscript m denotes the transport mode type m.
Distance Threshold
Travel distance had the highest impact on the active travel mode choice (Neves & Brand, 2019). Previous studies suggested that for every additional 1 km, the possibility of active transport would decrease (Hagberg & Holmberg, 2017; Wójcik, 2019). However, the precise distance thresholds of a short trip are unclear. When examining the possibility of replacing short car trips with active transport, some estimates imply that individuals are willing to walk between 1.6 km (Neves & Brand, 2019) and 2 km (Castro et al., 2019; Delso et al., 2018; Pérez-Neira et al., 2020). Meanwhile, bicycling can vary between 4 km (Pérez-Neira et al., 2020) to 4.5 km (Delso et al., 2018), 4.8 km (de Nazelle et al., 2010; Neves & Brand, 2019), 5 km (Castro et al., 2019), and 5.2 km (Raser et al., 2018). However, there is no clear definition of a definite distance threshold that constitutes a short trip. Thus, the distance threshold of this study will be based on the stated preference of active travel time duration obtained from the questionnaire. Table 4 shows the adopted standard speed of active transport across previous studies.
Standard Speed of Active Transport.

As travel distance is influenced by travel time which indirectly influences travel mode choice, it is crucial to understand the distance threshold of active transport in a local context. According to the theory of planned behavior (TPB), intention is a significant predictor of travel mode choice (Ajzen, 1991). Therefore, it is crucial to comprehend the public’s intentions and propensity for switching to sustainable travel mode choice (Rybarczyk & Gallagher, 2014; Zavareh et al., 2020). With the understanding of intention of travel mode choice, the estimation of GHG emission avoidance could be computed from the stated preference cross-modal diversion factor (

Results and Discussion
Sample Description
The minimum recommended sample size of the study is 385. Hence, the total collected respondents of 438 were sufficient. Table 5 summarizes the characteristics of the study population, which includes 415 respondents for data analysis. Individuals who lived outside of Klang Valley or did not answer most of the questionnaire survey were excluded from the sample. After compensating for invalid and missing data, 415 survey respondents with 1,290 trip data were collected. The sample had an even distribution of males (52.8%) and females (47.2%), with most responses from young adults aged 20 to 39 years old (40.5%). The Malay ethnicity accounted for the highest percentage of responses (72.8%), followed by Malaysian Chinese (18.1%), Malaysian Indian (6.0%), and others (3.1%). Respondents with a normal BMI of 18.5 to 24.9 made up the majority (45.8%), followed by overweight people with a BMI of more than 25.0 (41.4%) and underweight people with a BMI of less than 18.5 (12.8%). Most of the respondents were single (47.7%), highly educated with at least a diploma or higher education degree (65.8%) and employed full-time (57.8%). Most respondents (71.8%) did not have any children living in their home. A quarter of the respondents (23.6%) used public transportation services, and 80.2% of the respondents’ households owned at least one private motorized vehicle.
Summary of the Study Population (N = 415).

Table 6 presents the individual sociodemographic characteristics categorized by different travel mode choices. To determine the significance between the different categories of travel mode choice and the independent variables of sociodemographic characteristics, Pearson’s chi-square tests were used. All independent variables were found to be significant for active transport, although at different significance levels. For public transport, the independent variables of age, ethnicity, marital status, education level, presence of children in a household, and public transport subscription were found to be significant. On the other hand, for private transport, all independent variables except public transport subscription were found to be significant at p < .001.
Sociodemographic Characteristics Categorized by Different Travel Modes Choice.

Note. Statistically significant.
p < .05. **p < .01. ***p < .001.
Logic Regression Models of Travel Mode Choice
The previous section provides descriptive information on the relationship between sociodemographic traits and transportation modes. To complement this exploratory analysis, explanatory travel mode choice models are presented. These models aim to investigate the influence of individual sociodemographic characteristics on urban travel mode choices among city dwellers in Klang Valley, Malaysia.
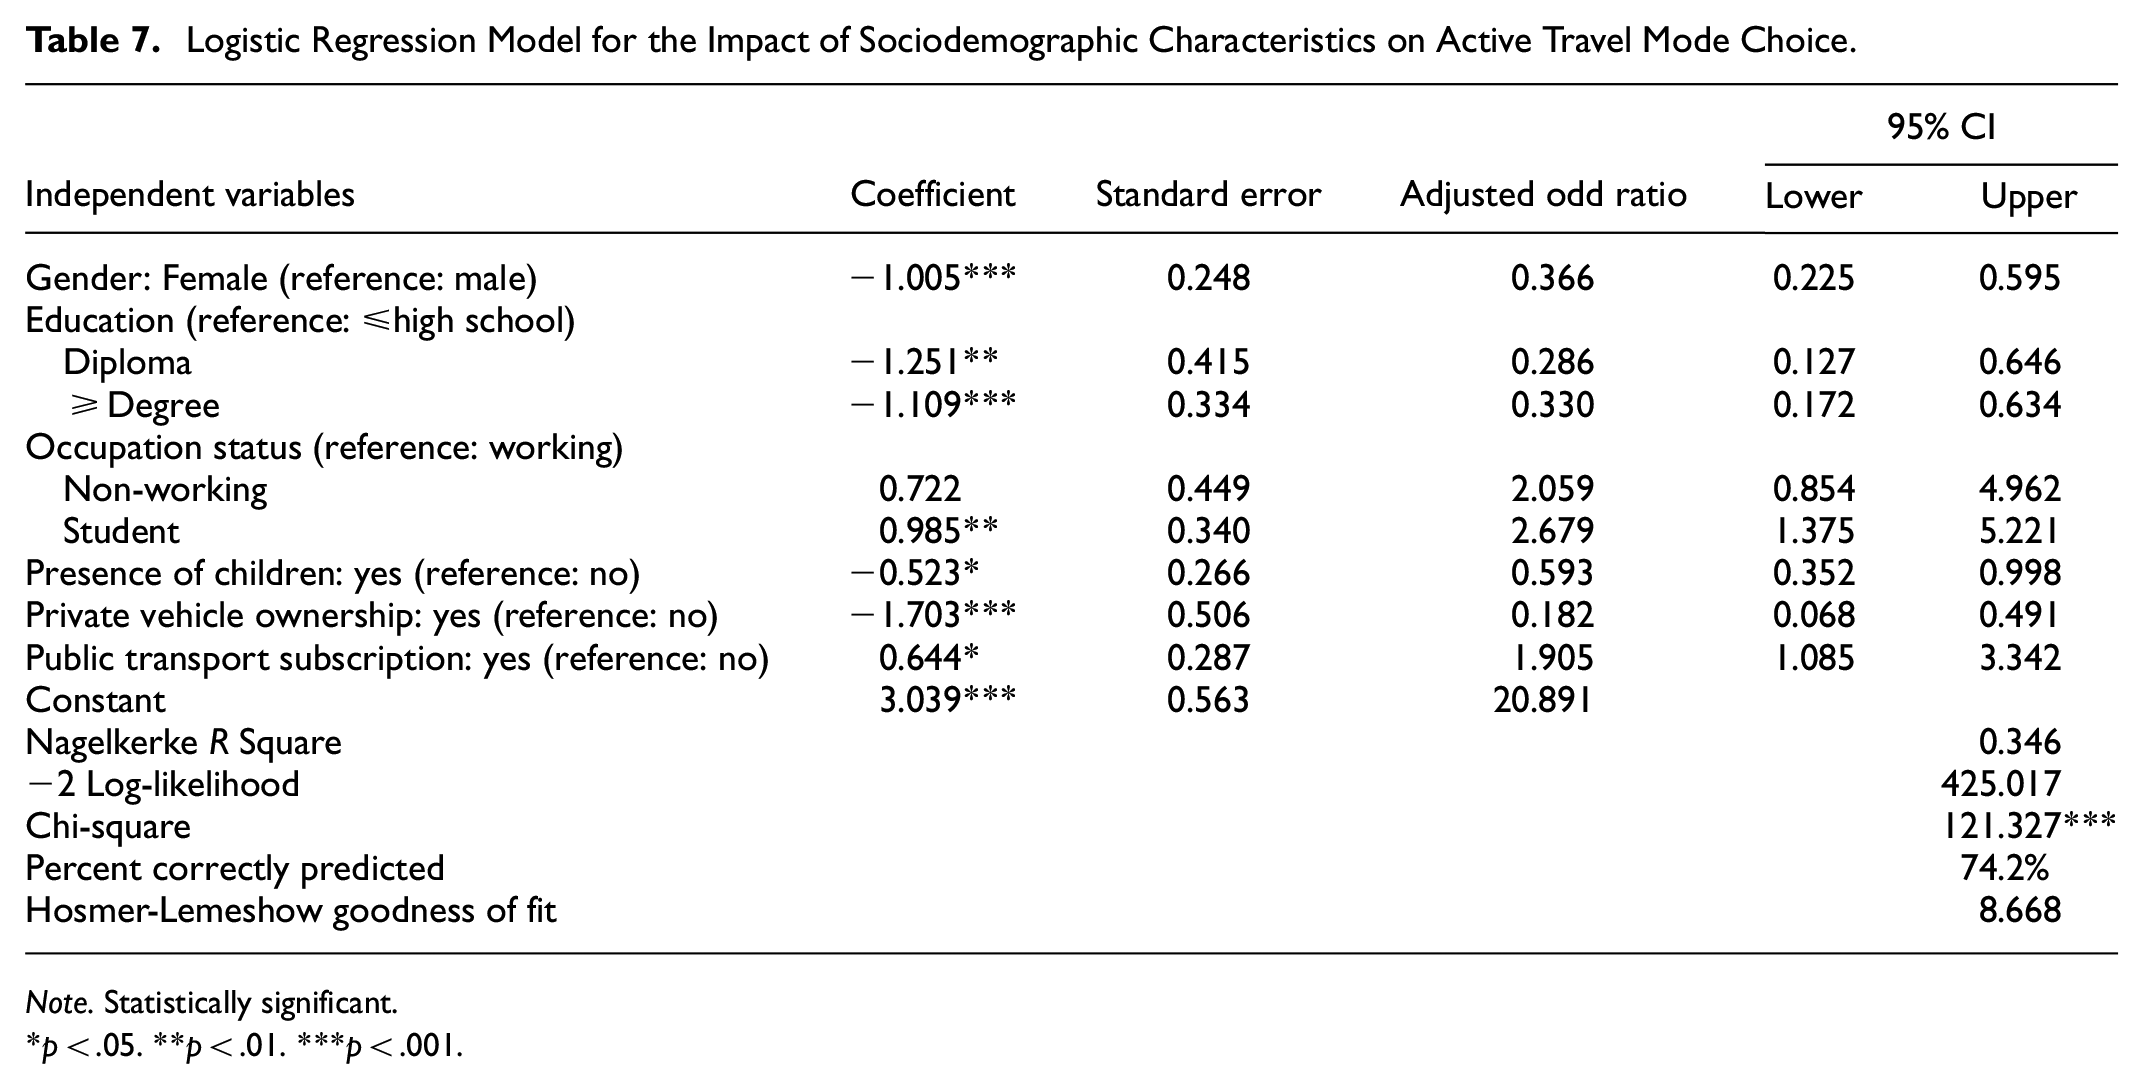
The logistic regression model of active travel mode choice is displayed in Table 7, where male is the gender reference category. The results reveal that women are 63.4% less likely (aOR 0.366; 95% CI [0.225, 0.595]) to use active transportation for their daily trips compared to men. Conversely, males have at least two times higher odds of active travel than females. These findings are in line with the research from Lithuania (Dėdelė et al., 2020), but the Netherlands reveals the opposite result (Ton et al., 2019). These disparities in gender equity and transportation mode may be attributed to cultural norms. Moreover, women tend to prioritize comfort and safety over men (Dėdelė et al., 2020). To encourage female travelers to switch to more active modes of transportation, public awareness should focus on safety measures, such as dedicated lanes for bicycles and pedestrians. Overall, cultural norms and safety concerns could explain the gender inequity and travel mode choice.
Logistic Regression Model for the Impact of Sociodemographic Characteristics on Active Travel Mode Choice.
Note. Statistically significant.
p < .05. **p < .01. ***p < .001.
Previous research has indicated a correlation between education levels and the adoption of active transportation (Biernat et al., 2018; Dėdelė et al., 2020; Hagberg & Holmberg, 2017; Ko et al., 2019). Similarly, we found that a person’s level of education has a significant influence on their decision to use active transportation in our study. When compared to individuals with a diploma, those with less education were 71.4% less likely to choose active transportation (aOR 0.286; 95% CI [0.127, 0.646]). Correspondingly, individuals with less education were about 67% less likely to opt for active transportation when compared to those with at least a degree (aOR 0.330; 95% CI [0.172, 0.634]). In simpler terms, these findings indicate that as a person’s level of education decreases, their likelihood of using active transportation significantly decreases as well. This underscores the important relationship between education and the choice of active travel.
Regarding occupation status, students have at least two times higher odds of actively traveling (aOR 2.679; 95% CI [1.375, 5.221]) than those in the workforce. These results are consistent with a prior study (Schubert et al., 2020), which found that studying young adults had a significant positive influence on active transportation. Additionally, contrary to (Dėdelė et al., 2020), no statistically significant correlation between active transportation and unemployment status was found.
On the other hand, having kids in the house reduces the likelihood of active travel by 40.7% (aOR 0.593; 95% CI [0.352, 0.998]). However, the odds of choosing an active mode of transport are 1.69 times higher when a child is not present in the home. Furthermore, owning a private motor vehicle in a household is associated with a statistically significant decline in the likelihood of choosing active travel. Specifically, it suggests that individuals or households with a private car are about 18.2% as likely to engage in active travel compared to those without a car (aOR 0.182; 95% CI [0.068, 0.491]). Conversely, the likelihood of active travel is approximately 5.5 times higher for individuals without a private vehicle. Finally, individuals who frequently use public transportation are 90.5% more likely to engage in active travel (aOR 1.905; 95% CI [1.085, 3.342]).
Besides, earlier research found that children and teenagers use active transportation more frequently (Hagberg & Holmberg, 2017; Saigal et al., 2021; Schubert et al., 2020). Walker had a markedly higher likelihood of being older (Dėdelė et al., 2020). Age, however, played no significant role in this study.
Table 8 shows the logistic regression model of public transport mode choice. This model aimed to investigate the impact of sociodemographic factors on the use of public transport. The findings indicate that age is a significant predictor of public transport mode choice. Specifically, young adults aged 20 to 39 have significantly higher odds of choosing public transport, with at least three times the odds compared to youth (aOR 3.887; 95% CI [1.579, 9.572]). In contrast, individuals over 40 years of age have the lowest preference for public transport compared to other age groups, with 80.8% lower odds of choosing public transport compared to youth (aOR 0.192; 95% CI [0.038, 0.972]). This difference may be due to factors such as health issues, dissatisfaction with public transport facilities, and lack of information and awareness (Luiu et al., 2018).
Logistic Regression Model for the Impact of Sociodemographic Characteristics on Public Transport Mode Choice.

Note. Statistically significant.
p < .05. **p < .01. ***p < .001.
Ethnicity was found to be a significant predictor of public transport mode choice. Individuals belonging to ethnicities other than Chinese Malaysian or Indian Malaysian were at least 20 times more likely to use public transport than the reference group, Malay (aOR 20.014; 95% CI [3.668, 109.205]). Surprisingly, the study did not find any significant association between travel mode choice and the three major ethnic groups in Malaysia, namely Malay, Chinese Malaysian, and Indian Malaysian. The discovery contrasts with previous research suggesting that racial or ethnic affiliations play a crucial role in travel mode choice (Yum, 2019). These findings highlight the complexity of the factors that influence transportation behavior and underscore the need for further research to understand the role of ethnicity in travel mode choice.
Moreover, the presence of children in the household was significantly associated with public transport mode choice. Households with children were 91.6% less likely to use public transport than those without (aOR 0.084; 95% CI [0.019, 0.380]). Conversely, households without children were 11.9 times more likely to choose public transport. These findings suggest that the presence of children may pose a barrier to using public transport and could have implications for promoting sustainable transportation options among families with children.
On the other hand, the study found that subscribing to public transport services was significantly associated with public transport mode choice. Individuals who subscribed to public transport services were over 4 times more likely to use public transport than those who did not (aOR 4.043; 95% CI [1.923, 8.500]). This result is consistent with prior research, which highlights that having a public transport subscription increases the likelihood of using local transit and trains while reducing the probability of using private transport (Ton et al., 2020). Therefore, subscribing to public transport services could be an effective strategy for promoting sustainable transportation choices and reducing reliance on private vehicles.
After conducting an analysis of the correlation between individual sociodemographic factors and the choice of private transport modes (as shown in Table 9), it was identified that five specific characteristics are linked to this relationship. The results indicated that women (aOR 3.616; 95% CI [1.995, 6.554]) were significantly more likely to travel with private transport. Females had at least 3 times higher odds of traveling by private transport compared to males. This relationship between travel mode choice and gender aligns with the results of previous studies conducted by (Simons et al., 2017). However, it is contrary to most previous studies, which have suggested that males are more likely to travel by car than females (Basarić et al., 2016; Dėdelė et al., 2020; Saigal et al., 2021; Simićević et al., 2016; Wójcik, 2019).
Logistic Regression Model for the Impact of Sociodemographic Characteristics on Private Transport Mode Choice.

Note. Statistically significant.
p < .05. **p < .01. ***p < .001.
On the other hand, the study found that individuals who attained at least a degree are at least 5 times more likely (aOR 5.254; 95% CI [2.727, 10.125]) to travel with private transport compared to those who have the lowest education levels. This finding is consistent with (Dėdelė et al., 2020; Saigal et al., 2021; Wójcik, 2019), who found that achieving a higher level of education increases the probability of using private transport. However, contrary to the common belief that more educated people tend to rely on private transport, (Clark et al., 2016) observed that highly educated individuals in England tend to travel with public transport rather than private transport for their trips to work.
Socioeconomic status is also significant in private transport mode choice. Individuals belonging to the highest socioeconomic status have nearly 5 times (aOR 4.874; 95% CI [1.661, 14.305]) higher odds of traveling by private transport compared to those in the lowest socioeconomic status. The finding is in line with previous research which concluded that as the socioeconomic status of individuals improves, their usage of private vehicles also increases (Dėdelė et al., 2020; Ko et al., 2019; Saigal et al., 2021; Simons et al., 2017). However, these findings contradicted a study conducted by (Keyes & Crawford-Brown, 2018) in England, who discovered that higher incomes would increase the odds of public transport and active travel mode choice compared to private transport.
Individuals with the presence of children in their household had at least 4-fold higher odds (aOR 4.330; 95% CI [1.970, 9.520]) to travel with private transport. The finding is similar to a previous study by (Ko et al., 2019) which concluded that travellers with children tend to choose private transport. A possible explanation for this could be linked to the importance of travel time savings as travelers with children prioritize time management and efficiency, tending to choose rapid and instantaneous travel modes such as the car, which is the most convenient mode of transportation for getting from one location to another (Ko et al., 2019).
Individuals who owned at least a private motorised vehicle in their household are at least 5 times more likely (aOR 5.321; 95% CI [2.685, 10.546]) to travel with private transport. The finding is in line with previous studies that private motorised vehicle ownership will significantly stimulate the use of private transport (Zhang et al., 2017) and decrease the probability of using public transport at the same time (Wójcik, 2019).
Despite its established application in the travel behavior analysis (Delso et al., 2018; Haggar et al., 2019; Xu, 2020), gender did not produce significant results in earlier studies by (Keyes & Crawford-Brown, 2018). However, a correlation between gender and the preference for private or active travel was discovered in this study. On the other hand, age was found a significant in active transport mode choice and private transport mode choice in previous studies, however, no significance was found in this study. According to (Wójcik, 2019), as age increased, the likelihood of using private transport on regular basis also increased. Individuals in the age group of 26 to 39 years are dominant motorized travel modes (Saigal et al., 2021). However, (Wójcik, 2019) reported that up to a certain age, a decline in the usage of private motorised vehicles was observed. This finding is similar to what was reported by (Dėdelė et al., 2020). According to (Dėdelė et al., 2020), private motorized vehicle users are more likely to be younger.
In this study, BMI as a health-related variable is not significant for all mode selections. This finding is contrary to earlier findings that were documented in the literature. According to (Dėdelė et al., 2020), an increase in BMI will lead to less active travel. A study conducted by (Dons et al., 2018) discovered that higher BMI is linked to private transportation while lower BMI is linked to active transportation.
Previous research revealed that single people were more likely to choose public transportation than married people (Hagberg & Holmberg, 2017). Contrarily, married people prefer to travel in their own private motor vehicles (Henning et al., 2020; Wójcik, 2019). The findings of this study, however, are similar to those of (Keyes & Crawford-Brown, 2018), which found that marital status had no significant impact on the topic of travel mode choice.
Public transport was the most prevalent mode among those with a lower level of education (Dėdelė et al., 2020). However, education level had no significant effect on public transport in the study. On the other hand, employment status is significant to active transport but not significant to both public transport and private transport in this study. Previous research has found that employed individuals were more likely to increase the probability of choosing private vehicles than non-working people (Dėdelė et al., 2020; Saigal et al., 2021; Schubert et al., 2020). However, this finding is contradicted by a study conducted in Poland, where active employment status showed a stronger propensity toward public transportation than private vehicles (Wójcik, 2019). On the other hand, public transport is highly correlated to unemployed status (Dėdelė et al., 2020). Furthermore, it is worth highlighting that studying young adult had a significant impact on the regular usage of public transportation was reported (Schubert et al., 2020; Wójcik, 2019). These findings underscore the complex interplay between socioeconomic factors and transportation choices, shedding light on the multifaceted nature of public transportation preferences in different demographic groups.
Distance Threshold
A stated preference survey is a common method to elicit the preferences of travel mode choice from potential travelers. Figure 2 presents data on time allocation preferences for active transport, obtained from such a survey. Most respondents (44.6% for walking and 24.0% for bicycling) were willing to spend over 30 minutes during active travel, which is comparable to real-life data showing that the average time spent walking or bicycling to work by active transport users is 36 minutes (Guzman et al., 2020).

Stated preference of time allocation for active transport.
Previous literature has set a narrow standard speed range for walking, ranging from 1.2 m/second (Duim et al., 2017) to 1.4 m/second (Pérez-Neira et al., 2020). In contrast, the standard speed range for bicycling has been found to be much higher, ranging from 2.3 m/second (Dubbeldam et al., 2017) to nearly double that speed, such as 4.2 m/second (Olmos et al., 2020) and 4.8 m/second (Pérez-Neira et al., 2020). To remain conservative, this study adopts the walking and bicycling speeds of 1.2 and 2.3 m/second, respectively, based on previous study records (Dubbeldam et al., 2017; Duim et al., 2017).
Using the standard speed range adopted from previous studies and the stated preference data collected from the mobility survey, this study defines short trips as those that are less than 4 km in length. Short car trips under 2 km will be substituted with walking, while trips between 2 to 4 km will be substituted with bicycling. In comparison with other studies, Mizdrak et al. (2019) defined short walking trips as under 1 km and short bicycling trips as less than 5 km, while Neves and Brand (2019) defined short walking trips as under 1 mile (approximately 1.6 km) and short bicycling trips as under 3 miles (approximately 4.8 km).


General Travel Activities
Figure 3 illustrates the details of urban travel mode share distribution of short trips among the sample population. The study recorded 1,290 trips from 415 people, with 82.2% being short-distance trips (less than 4 km) and 17.8% being long-distance trips (more than 4 km). For short trips, walking was the most common mode of transportation (44.6%), followed by car (28.5%) and motorcycle (17.5%). Buses and bicycles had similar mode shares, constituting 5.4 and 4.0%, respectively.
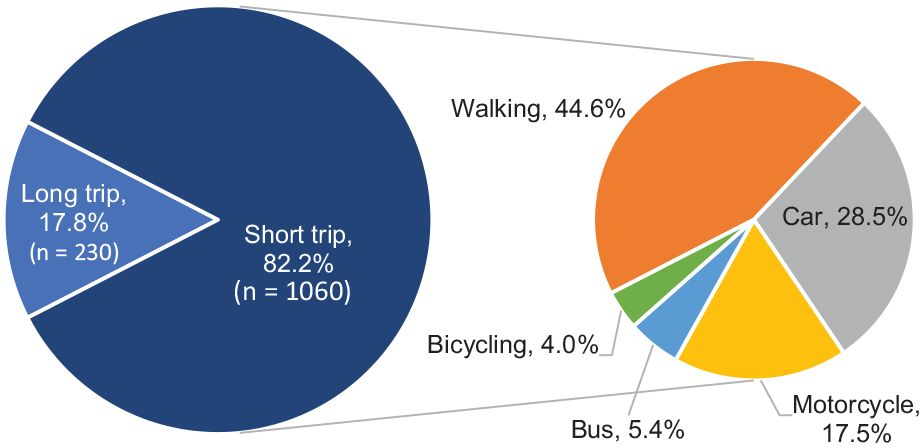
Distribution of urban travel mode share of short trips (n = 1,290).
Table 10 presents data on the cumulative proportion of trips by travel mode choice and trip distance. Walking was the most common mode of transportation for trips less than 1 km (26.2%), while bicycling was less popular for trips longer than 1 km. Car trips dominated for distances greater than 4 km, accounting for 12.6% of all recorded trips. Overall, 82.2% of recorded trips were less than 4 km.
Distribution and Cumulative Proportion of Trips by Travel Mode Choice and Trip Distance (n = 1,290).

Existing Patterns of Short Car Trips
Figure 4 displays data on the trip purpose of short car trips from a sample of 415 individuals, with a total of 1,290 trips recorded. Among the short car trips (less than 4 km), accessing public transport stations was the most common purpose, accounting for 55.3% of all trips. Schools or workplaces were the second most common purpose, comprising 41.7% of trips. A small proportion of trips (3.0%) were taken to access neighborhood facilities such as local markets, places of worship, and playgrounds.

Trip purpose of short car trips (n = 302).
Life Cycle Assessment of Different Travel Mode
The IPCC 2013 GWP 100a V1.03 impact assessment methodology was used in this study. The result of the LCIA represent the effect of the material flows, energy consumption, and emissions of each traveling mode on the global warming potential in term of gCO2e GHG emissions. The Table 11, below shown the LCIA results of carbon footprint in term of GWP (Global Warming Potential) for each traveling mode. Per passenger kilometer travel, bicycle produced 11.3 g of CO2e/pkm of GHG emissions, travel with bus produced 109.1 g of CO2e/pkm of GHG emissions, travel with motorcycle produced 124.0 g of CO2e/pkm of GHG emissions and travel with car produced 371.1 g of CO2e/pkm of GHG emissions.
Impact Assessments Results.

Estimation of Transport GHG emission
The estimation of transport GHG emission was generated from the 1,290 sample trip data is as shown in Table 12. The results of total GHG emissions from a total of 1,290 sample trip data is 396.1
GHG Emission Without the Intervention of Travel Mode Shift.


GHG emissions by transportation mode in Klang Valley.
Intention of Travel Mode Shift
This study estimated the potential GHG emission reduction based on a stated preference survey asking respondents about their intention to adopt active travel modes. Table 13 displays the results for car users, with 46.3% intending to shift to walking and 51.7% intending to adopt active travel for short car trips. Other studies have reported varying estimates of the frequency with which short car trips can be replaced by active travel modes, ranging from 25 to 86% for utilitarian trips (Piatkowski et al., 2015) and 30 to 40% for short car trips (Delso et al., 2018). (Neves & Brand, 2019) found that active transport could feasibly replace 41% of short car trips, while (Loh et al., 2022) reported that 8% of short car trips could be replaced with walking and 44% with bicycling. These differences may be due to variations in measuring substitution, including trip chain, time horizon, travel activity, indirect inference, and direct inquiry.
Intention of Active Travel Mode Choice Shift and Cross-Modal Diversion Factor Among Car Users (n = 294).

Modelling of Potential GHG Emission Avoidance
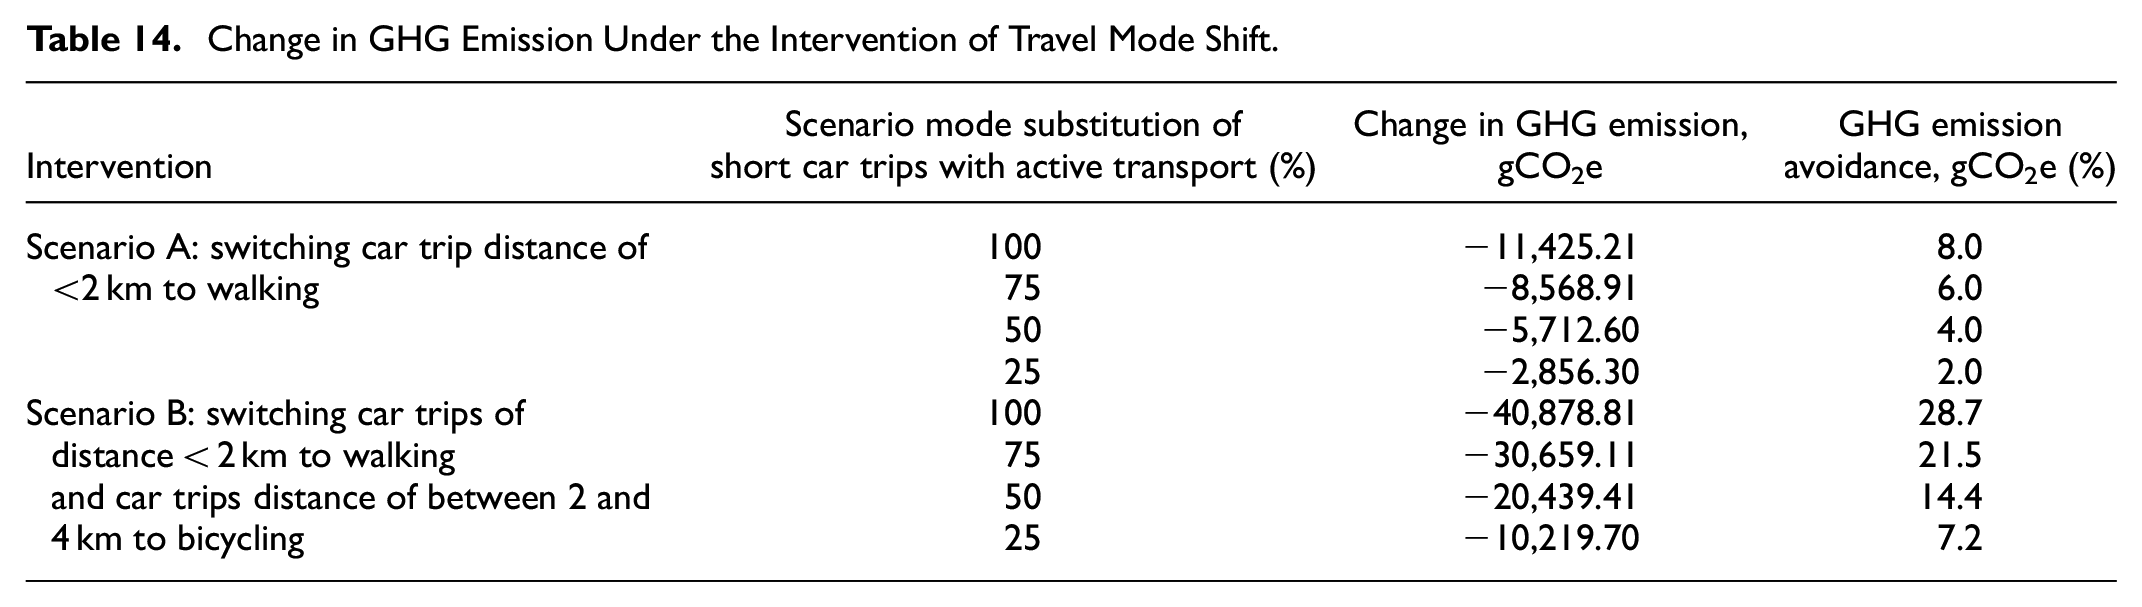
Table 14 show the estimated potential GHG emission avoidance through travel mode shift from car to active transport mode, with two simulated scenarios: Scenario A involves substituting short car trips under 2 km with walking only, while Scenario B involves substituting short car trips under 4 km with both walking and bicycling. The study uses the scenario mode substitution method to project GHG emission avoidance, ranging from 25 to 100% quarterly, as shown in Figure 6.
Change in GHG Emission Under the Intervention of Travel Mode Shift.

GHG emission avoidance under modelled interventions.
Potential GHG Emission Avoidance by Stated Preference
Table 15 summarizes the estimated GHG emission avoidance in different scenarios based on cross-modal diversion factors from the stated preference survey. Scenario A involved only walking, with a cross-modal diversion factor of 46.3%, resulting in a GHG emission avoidance of 3.66%. Scenario B targeted short car trips of 4 km or less and included both walking and bicycling as active transport modes, with a cross-modal diversion factor of 51.7%, resulting in a GHG emission avoidance of 14.52%.
Result Summarization of GHG Emission Avoidance.

The findings in this study are consistent with prior research that suggests replacing short car trips with active transport can have environmental benefits (Mizdrak et al., 2019; Neves & Brand, 2019). The study found that switching short car trips of less than 2 km to walking can reduce GHG emissions by 3.66%, while switching to walking and bicycling for car trips between 2 to 4 km can reduce GHG emissions by 14.52%. These findings are similar to those of a recent study in Spain, which estimated that substituting cars with bicycles (50% in < 4 km distance) for university commuting could potentially reduce GHG emissions by 17.5% (Pérez-Neira et al., 2020).
From the results, significant difference was discovered in the reduction of greenhouse gas emissions between walking and cycling as modes of active transport. When bicycling was added as an intervention, the GHG emission avoidance improved almost 4 times, from 3.66 to 14.52%, compared to walking alone. The results suggest promoting bicycling as a mode of transportation in the country, as the bicycling mode shares in the study sites were particularly low, which constituted merely 4.0%.
Potential GHG Emission Avoidance by Criteria Fulfillment
Table 16 provides a summary of the findings related to the cross-modal diversion factor derived from a stated preference survey. The survey asked respondents about their willingness to switch from driving to walking or cycling in a hypothetical scenario where active transport infrastructure is improved. The cross-modal diversion factor of 51.7% was adopted from the survey results.
Carbon Emissions Avoidance Based on the Fulfillment of Sociodemographic Criteria.

The study found that the fulfillment of sociodemographic criteria is positively correlated with carbon emissions avoidance through active transport. With just two criteria fulfilled, at least 12.5% of carbon emissions could be avoided. These results are comparable to a recent Spanish study that calculated the environmental effects of increasing active travel (Pérez-Neira et al., 2020). The authors calculated the potential for university commutes to reduce carbon emissions by adopting a life cycle analysis and found that replacing 50% of car trips with active transport could reduce carbon emissions by 17.5%.
To conclude, the findings showed a noteworthy reduction in carbon emissions avoidance through the improvement of active transport infrastructure. Along with upgrading infrastructure, it is suggested that innovative practices like bike-sharing schemes be implemented to encourage sustainable travel mode choices (Kou et al., 2020; Sharmeen et al., 2021). Furthermore, improving accessibility, walkability, and bikeability in neighborhoods through the concept of residential mobility and neighborhood can effectively enhance lifestyles and preserve the environment (Saghapour & Moridpour, 2019). It is recommended that schools and job opportunities be located within local neighborhoods to reduce carbon emissions and promote a healthy environment.
Conclusion
This research paper analyzes the travel mode choice and the intention for active travel mode shifts in short distance trips among 415 respondents in a case study of Klang Valley, Malaysia. The study defines equations to estimate Greenhouse Gas (GHG) emissions derived from the functional parameters of the stated preference of the diversion factor. It has been proven that emissions are directly proportional to the intention of adopting sustainable travel behavioral change. The paper adopts a methodological technique based on the following interrelated indicators: a) travel mode distribution (walking, bicycle, bus, car, and motorcycle); b) travel speed (kilometers); c) stated preference of travel time (minutes); d) intention to adopt sustainable travel mode shift; and e) GHG emission (gCO2e) associated with travel mode choice focusing on short-distance trips.
This study emphasizes the significance of identifying sociodemographic traits that influence the mode of urban travel to develop policies and interventions that promote sustainable transportation. The research reveals that male individuals, low education levels, students, and those who do not own private motorized vehicles are more likely to actively travel, whereas females, individuals with high education and socioeconomic status, and those who own private motor vehicles are more likely to drive daily. The study recommends targeting the latter group for mode-shifting from private to public transportation or active transportation for shorter distances. The study suggests that public transport subscription will significantly encourage active travel and public transport use. It recommends the development of pedestrian and cycling infrastructure, as well as improvement of public transport services to cater to the disabled and elderly. By comprehending the relationships between travel mode choices, policymakers can plan and implement effective strategies to shift from motorized transportation toward active mobility, meeting transportation needs for different social groups.
On the other hand, the Life Cycle Assessment (LCA) of the corresponding travel mode revealed that the car produced the highest GHG emissions (371.1 g of CO2e/pkm), followed by the motorcycle (124.0 g of CO2e/pkm), and the bus (109.1 g of CO2e/pkm). Cycling generated the least greenhouse gas emissions (11.3 g of CO2e/pkm). The study discovered that active transport, namely walking and bicycling, could potentially lower GHG emissions by 14.52% for short car trips under 4 km and by 3.66% for walking trips under 2 km, as per the LCA’s GHG emissions. These findings confirm that active transport can aid in reducing carbon emissions in the transportation system, in addition to providing other advantages like less traffic congestion and better air and noise quality.
Promoting active transport, such as walking and bicycling, can reduce transport-related emissions, but few studies have examined the GHG emission outcomes based on intention or stated preference. The study recognizes certain limitations, notably the reliance on lower limits when collecting travel distance data due to cost, time, and logistical constraints. Despite these constraints, the research underscores the potential for future investigations to refine enhance the findings of the model and improve its utility. These inquiries may encompass evaluating sustainable transport options, such as low-emission and electric vehicles, for their greenhouse gas emission reduction potential. By scrutinizing the dynamics and effectiveness of policies and initiatives that encourage active transport, these research avenues promise to augment our comprehension of sustainable transportation solutions and their national impact.
Research Data
sj-sav-1-sgo-10.1177_21582440241228644 – for Urban Mobility Mode Shift to Active Transport: Sociodemographic Dependency and Potential Greenhouse Gas Emission Reduction
, sj-sav-1-sgo-10.1177_21582440241228644 for Urban Mobility Mode Shift to Active Transport: Sociodemographic Dependency and Potential Greenhouse Gas Emission Reduction by Kah Mun Ng, Choon Wah Yuen, Chiu Chuen Onn and Nik Ibtishamiah Ibrahim in SAGE Open
Footnotes
Acknowledgements
All authors made substantial contributions to the study conception, analysis, and interpretation of data. In addition to that, all authors read and approved the final version of the manuscript.
Declaration of Conflicting Interests
The author(s) declared no potential conflicts of interest with respect to the research, authorship, and/or publication of this article.
Funding
The author(s) disclosed receipt of the following financial support for the research, authorship, and/or publication of this article: This work was funded by the Ministry of Higher Education of Malaysia and the Universiti Malaya, under grant number IIRG009A-19SAH (research project “Promoting active transport as a way to reduce carbon emissions, improve health and enhance social well-being”).
Ethics Statement
This study was approved by the University of Malaya Research Ethics Committee (UMREC) under protocol number UM.TNC2/UMREC-681. All participants provided informed consent before participating in the study.
Informed Consent Statement
Informed consent was obtained from all subjects involved in the study.
References
Supplementary Material
Please find the following supplemental material available below.
For Open Access articles published under a Creative Commons License, all supplemental material carries the same license as the article it is associated with.
For non-Open Access articles published, all supplemental material carries a non-exclusive license, and permission requests for re-use of supplemental material or any part of supplemental material shall be sent directly to the copyright owner as specified in the copyright notice associated with the article.