
Abstract
Previous studies have primarily focused on the carbon footprint of physical products, resulting in the oversight of the carbon footprint of digital translation products, particularly the computer-aided translation (CAT) products. However, reducing the carbon emissions of these products is pivotal to controlling the emissions of greenhouse gases. Based on life cycle assessment theory, this study aims to construct a carbon footprint model of CAT products. The modeling findings reveal that the stage of data processing of CAT products presents the lowest sensitivity, while the usage stage of CAT products showcases the highest sensitivity. Overall, the current model demonstrates comparatively high stability. More significantly, CAT products are characterized by reproducibility, non-loss and similarity of raw materials with other digital translation products. Therefore, compared with other extant models, the model in this study demonstrates broader applicability, along with greener translation ideas and more flexible strategies to stakeholders in translation processes. Hopefully, this study can cast light on the calculation of carbon footprint of digital translation products, facilitating the reduction of carbon emissions in China and abroad.
Keywords
Introduction
In recent years, the real-time and automatic terminology and memory banks derived from translation tools have blurred the boundaries between human translators and computer technologies, dramatically enhancing translation efficiency and reducing translation costs (Shadiev et al., 2024a; Wang & Xie, 2023). Given this, computer-aided translation (CAT) has caught the attention of a host of researchers, and is endowed with two mainstream connotations. Primarily, CAT denotes translation technologies that can improve translation efficiency by matching translation memories and terminology banks (Kay, 1997; Kenny, 1999). However, with the advancement of generative artificial intelligence (GenAI), CAT refers to diverse information technologies and tools that are utilized to enhance translation speed and cut translation costs during the translation process (Bowker, 2014; Shadiev et al., 2024a, 2024b), such as Google translate, ChatGPT, and Déja Vu. In this sense, CAT products refer to those generated through these technological means.
Subsequently, due to the prevalence of neural network technology in Chinese translation industry, CAT has evolved into machine translation post-editing (MTPE) and later into interactive machine translation (IMT). For instance, some prevailing CAT tools like SDL Trados Studio, Déja Vu, Wordfast and memoQ have installed neural MT plug-ins. This trend has led to the research agenda in the existing literature, which focuses on the functions of tools such as bilingual dictionaries and translation memory (e.g., Bundgaard et al., 2016; Rothwell et al., 2023), and their applications in teaching (e.g., Lin, 2020; Wu, 2021; Yang & Su, 2022; Zhang et al., 2024) and translator training (e.g., Al-Rumaih, 2021; Almusharraf & Bailey, 2023; Kim & Oh, 2023). This demonstrates the widespread influence of CAT tools and relevant technology in different translation-related fields. However, it should be noted that these technologies and tools based on large language models (LMMs) usually consume energy, such as electricity, fossil fuels and raw materials for paper-making, when producing final translation products. These power sources contribute to carbon emissions (Lakim et al., 2022), hints at the substantial carbon footprints scattered everywhere. Although in the context of global warming, the calculation of these carbon footprints is of great importance for stakeholders in translation processes to recognize and help lessen the carbon dioxide (CO2) concentration in the air, little scholarly attention has been paid to this phenomenon.
To fill this void, the study aims to compute the carbon footprint of CAT products via life cycle assessment (LCA) model. Meanwhile, to enhance the universality of the model, this study will adopt sensitivity analysis (Christopher & Patil, 2002; Zheng et al., 2017) in addition to the 1/3 carbon emission rule (European Commission, 2012) to enhance the quality of model data, and to judge and quantify their uncertainties. Hopefully, the model can accurately reflect the carbon footprint trails of CAT products, and promote the awareness of green translation and the achievement of carbon neutrality in current translation service market.
Literature Review
Carbon footprint, a widely used indicator of greenhouse gas emissions, encompasses two distinct components. The direct footprint is quantified as the CO2 emissions resulting from the combustion of fossil fuels in domestic energy utilization and transportation. In contrast, the indirect or secondary footprint is gauged by the CO2 emissions generated throughout the entire lifecycle of products or services (Tukker & Jansen, 2006). Yet, given the complexity and limited operability associated with direct measurement, a substantial body of extant literature has focused on the indirect carbon footprint of products or services (e.g., Abagnato et al., 2024; Z. Li et al., 2024; Moura et al., 2025). Specifically, in the measurement of product carbon footprint, three prominent methods have been widely recognized in the user community. These are the LCA, input-output analysis, and hybrid analysis (Muthu, 2015). Of the three methods, LCA is the most commonly used, due to its higher scope accuracy and more reliable evaluation results.
Therefore, a vast reservoir of existing literature attempts to investigate the carbon footprints of diverse products via LCA methods in order to advocate the low-carbon consumption behavior in the economic market (e.g., Z. Li et al., 2024; Zhao et al., 2024). As a case in point, within the purview of LCA framework, Z. Li et al. (2024) posit that consumers can curtail the carbon footprints associated with jeans, a representative fast-fashion item, across scenarios of second-hand trading, recycling, and renting. Importantly, with the advancement of AI technologies, the number of estimation methods of carbon footprint is increasing. For example, there are machine learning (Dong & Zhang, 2023), system generalized method of moments (Fu & Zhou, 2023), Monte Carlo simulation (Kwon & An, 2024), and geographical information system (Deka et al., 2025).
Nonetheless, the incomplete transparency of the supply chain causes the persistence of uncertainty of carbon footprint data, although these advanced statistics measures try to address this issue. Uncertainty, when present, tends to precipitate erroneous decision-making and misdirected environmental protection measures. Moreover, a significant and intricate connection exists between uncertainty and sensitivity. That is, sensitivity functions as a means to quantify the communication effect of uncertainty and identify the specific sources thereof (Igos et al., 2019). For instance, in the production, unreported intermediate steps or variable input sources can introduce fluctuations in the data, thereby giving rise to the carbon footprint data’s uncertainty and making it highly sensitive to any minor change in the underlying, yet untransparent, production factors. In this sense, reporting the uncertainty and sensitivity simultaneously is conducive to bolstering the stability of hypothetical models and the credibility of decision-making values when computing carbon footprint, particularly for emerging AI products with special production properties (Popowicz et al., 2024).
In addition, extant carbon footprint models are actually applicable to special products with unique characteristics, suggesting that subsequent studies still need to develop a specific carbon footprint model for different digital services products because of their distinct production processes, such as smart phones and Bluetooth headsets. Otherwise, the influence of parameter uncertainty on environment variables leads to low communication validity of proposed models, resulting in invalid implementation of environmental protection policies. In fact, as regards digital translation products like CAT tools and machine translation (MT) texts, their production processes are analogous, lossless, highly transparent, and replicable compared with the production processes of other physical products. These traits demonstrate that the carbon footprint calculation method of a specific translation product can be popularized to other products, thereby displaying substantial economic value.
However, little scholarly attention has been paid to this point, resulting in the neglect of carbon emissions of digital translation products. To fill the aforementioned gaps, this study, informed by PAS 2050 (British Standards Institution, 2011), ISO 14044 (ISO, 2006a) and taking into account the current workflow of CAT projects, endeavors to construct a fresh calculation model of carbon emissions of emerging CAT products in China using the LCA method.
Methodology
Life Cycle Assessment
As outlined earlier, LCA, as a mainstream carbon footprint computation tool, can evaluate the environmental impacts and resource use throughout the life cycle of products. It is classified into three sub-paths: process analysis focusing on the carbon emissions of a specific product from raw materials to finished product stages; input-output analysis evaluating all carbon emissions of various products from cradle to grave in the large-scale organization; hybrid analysis combining the above two ways (Klöpffer & Grahl, 2014; Nakamura & Nansai, 2016). Compared with emerging prospective life cycle assessment (pLCA) (Erakca et al., 2024), LCA still presents significant advantages due to the three distinct paths, although it is subject to the scale of technology and dynamics of production systems. To date, numerous scholars have shown a strong interest in this product LCA, ranging from daily necessities to national resource products (e.g., Ehigiamusoe et al., 2023; Espinoza-Orias & Lundquist, 2025; Ribeiro et al., 2024; Kwon & An, 2024).
In addition, within the LCA framework, the computation of carbon footprints is divided into four separate stages: goal and scope definition, inventory analysis, impact assessment, and interpretation (Michael et al., 2018). These four phases consider most aspects related to the natural environment, resources, and human health (ISO, 2006a, 2006b). Notably, to the best of our knowledge, considerable prior studies have looked into these four steps to warrant the comprehensive examination of carbon emissions (e.g., Curth et al., 2024; Mazzucco et al., 2023; C. Li et al., 2024). In this sense, to avoid heterogeneity of external factors, this study still abides by these LCA conventions to count the carbon footprints of CAT products in line with the actual production flow. This adherence, undoubtedly, can guarantee the reliability and validity of the assumed model.
Life Cycle Definition and Data Collection
The carbon footprint of products is defined as the greenhouse gas emissions associated with a product throughout its life cycle, commencing from the extraction of raw materials and extending to the utilization of the finished product (British Standards Institution, 2011). Given the uncertainties of CAT products information and their vital impacts on sustainable manufacturing, it is imperative to calculate products’ carbon footprint according to their actual life cycle. Based on a process-based LCA, this study quantifies the greenhouse gas emissions from CAT products life cycle, including acquisition of original manuscript data (data of source-language texts), CAT data processing, storage and transportation, and finished products use (target-language texts). Considering that translators finally transfer the used CAT products into translation memory databases and translation terminology banks, the stage of waste disposal and waste recycling won’t be taken into account. Hence, combining LCA requirements in ISO 14044 international standards, the calculation process in the present study primarily involves four key steps, goal and scope definition, functional unit selection, system boundary definition, and input data collection.
Goal and Scope Definition
Currently, in CAT projects, CAT-processed products include original texts, target texts, translation memory databases and translation terminology banks, which occur in different phases of a CAT project. Moreover, for Chinese translators, most translation activities are completed by computer software, such as SDL Trados, Déja Vu, and memoQ. These tools consume much electricity, thermal energy, and other energy resources during operation. This study proposes the use of the carbon emission factor (CEF) from the Intergovernmental Panel on Climate Change (IPCC) (Table 1) to measure carbon emissions within the life cycle of CAT products. The measurement is carried out in line with the product’s specifications, taking into account its manufacturing and use processes, as per the IPCC guidelines (IPCC, 2006). This approach is adopted because the CEF statistical methods in China are consistent with those of the IPCC, as noted by the National Development and Reform Commission of the People’s Republic of China (2011a). First, the present study meticulously discerns the characteristics of carbon emissions in each life-cycle stage and uncovers the underlying significant causes. This understanding empowers translators to deliberately curtail the utilization of software modules with high power consumption. As has been well-established in the field, such targeted actions can lead to a reduction in the overall carbon footprint associated with translation processes.
The Carbon Emission Factor in this Study.

Source. Strategic Alliance of Carbon Peaking & Carbon Neutrality in China.
Furthermore, the present study utilizes sensitivity analysis to pinpoint factors exerting a more substantial impact on carbon emissions. As posited by Saltelli (2002), this approach enables the identification of key influencers, thereby guiding designers in implementing low-carbon design enhancements and effectively reducing the product’s carbon footprint. Finally, in the context of the entire life cycle, there exist certain phases characterized by uncertainties, as well as components and parts that generate minimal carbon emissions. For instance, the actions of closing and opening translation documents can be considered as such cases. Drawing on the methodology proposed by ISO (2006a), this research advocates the use of uncertainty analysis to exclude these elements. By doing so, it is anticipated that the integrity of the data can be safeguarded, thereby streamlining the calculation of the carbon footprint of CAT products.
Functional Unit Selection
The functional unit is defined as the quantified performance of a product system for use as a reference unit (ISO, 2006a). It is the basis for calculation of the carbon footprint of CAT products. As Weidema et al. (2004) pointed out, the functional unit should relate as closely as possible to the product's functions rather than the physical product itself. For example, in a CAT project, the functional unit is the support from translation memory databases for a translator who has worked with Trados for one year rather than the Trados software itself. Similarly, the functional unit is the capacity to translate 100 manuscripts simultaneously rather than one Trados software that can handle 100 manuscripts. By doing so, all obligatory properties of CAT products as well as the duration of the product performance are addressed (Weidema et al., 2004). Consequently, to standardize both the input and output data, this study proactively selects specific units of CAT products before the calculation process.
System Boundary Definition
System boundary acts as a determinant, setting a set of criteria that define which unit processes are part of a product system (ISO, 2006a). Based on the criteria stipulated by the system boundary, researchers are clear about which life cycle is to be included and what data in each phase will be collected. In alignment with the prevailing international standards regarding carbon emissions, namely PAS 2050 and ISO 14044, and in conjunction with the current workflow of CAT projects in China (Wang & Wang, 2016), the present study delineates the system boundary across four dimensions. These aspects encompass the acquisition of original manuscript data, the processing of CAT data, the storage and transportation of CAT data, and the utilization of CAT products. Note that this delineation of the boundary is not arbitrary. It takes into account both the LCA characteristics inherent to a CAT product and the computational convenience required for the present study. By considering the LCA characteristics, a comprehensive view of the environmental impact associated with the entire lifespan of the CAT product is ensured. Simultaneously, factoring in calculation convenience enables more efficient and accurate quantification of relevant parameters within the scope of this research.
Input Data Collection
Collecting carbon footprint data is essential for establishing the full life cycle database of CAT products. For instance, it is necessary to calculate in a scientific manner the amount of fossil fuel consumed in paper manufacture and the quantity of electricity consumed during the operation of CAT software. In recent years, China has built some databases and specifications related to the calculation of carbon footprint. For example, Guidelines for the Preparation of Provincial Greenhouse Gas Inventories (Trial), Average emission factor of regional power grid, and average emission factor of national power grid (National Development and Reform Commission in the People’s Republic of China, 2011a). However, on Chinese official websites, certain detailed data, such as the standard—coal conversion coefficient, carbon concentration per unit calorific value, and average low—calorific value, are noticeably absent. Therefore, this study considers using the carbon factor data from IPCC to calculate our CAT products carbon footprint so as to guarantee the authority and validity of research data. On the basis of functional units and system boundary in the above research, the detailed input data collection sources are shown in Figure 1.
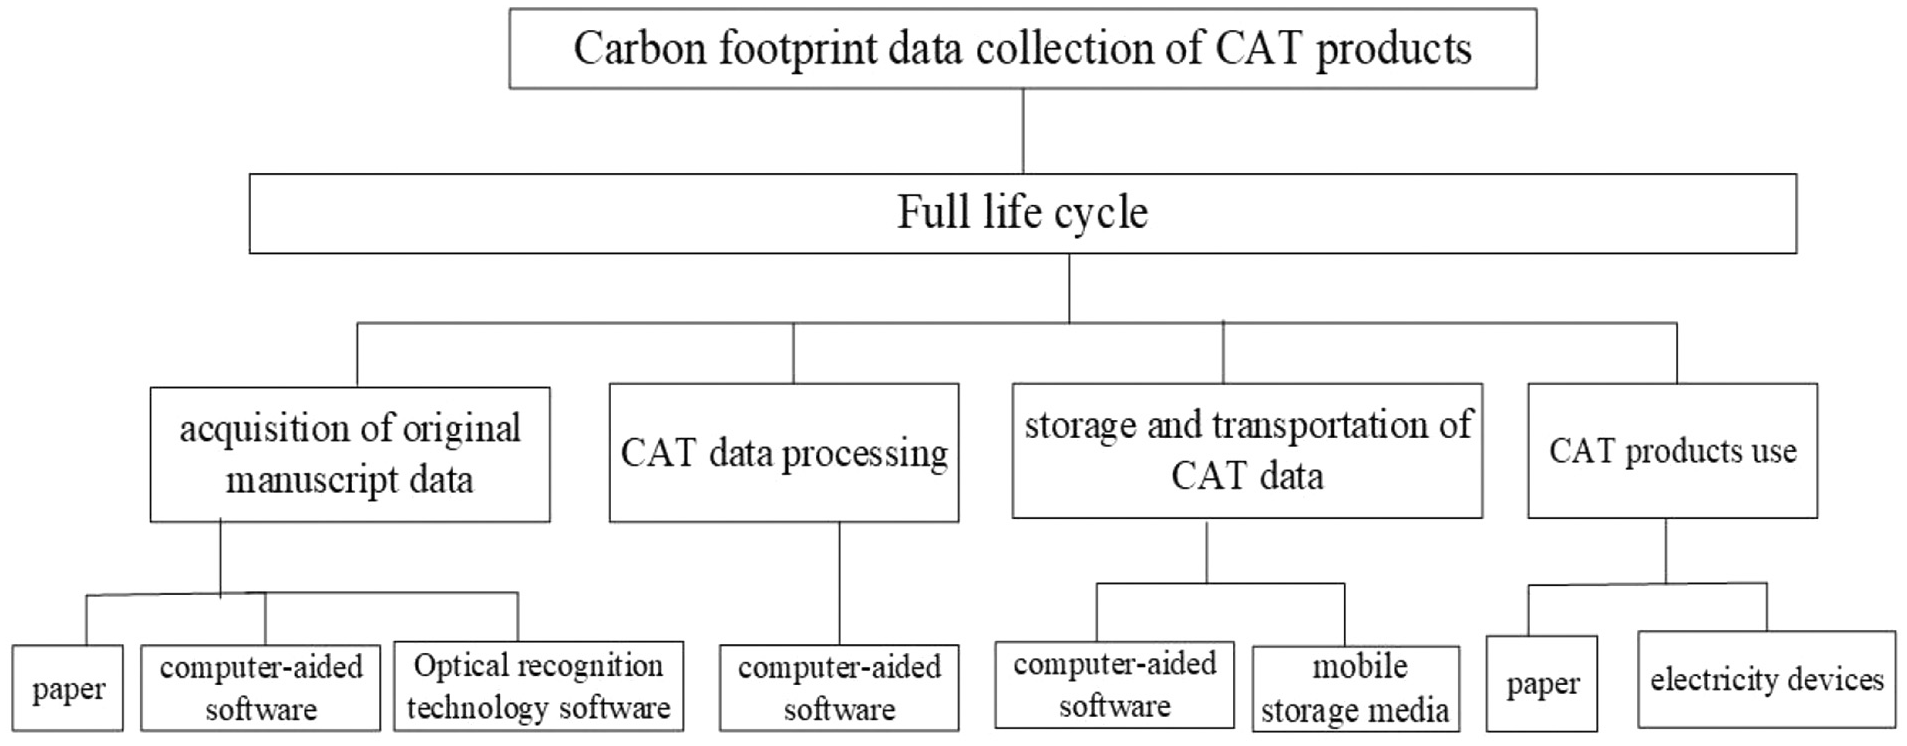
The data sources of carbon footprint of CAT products.
Model Construction
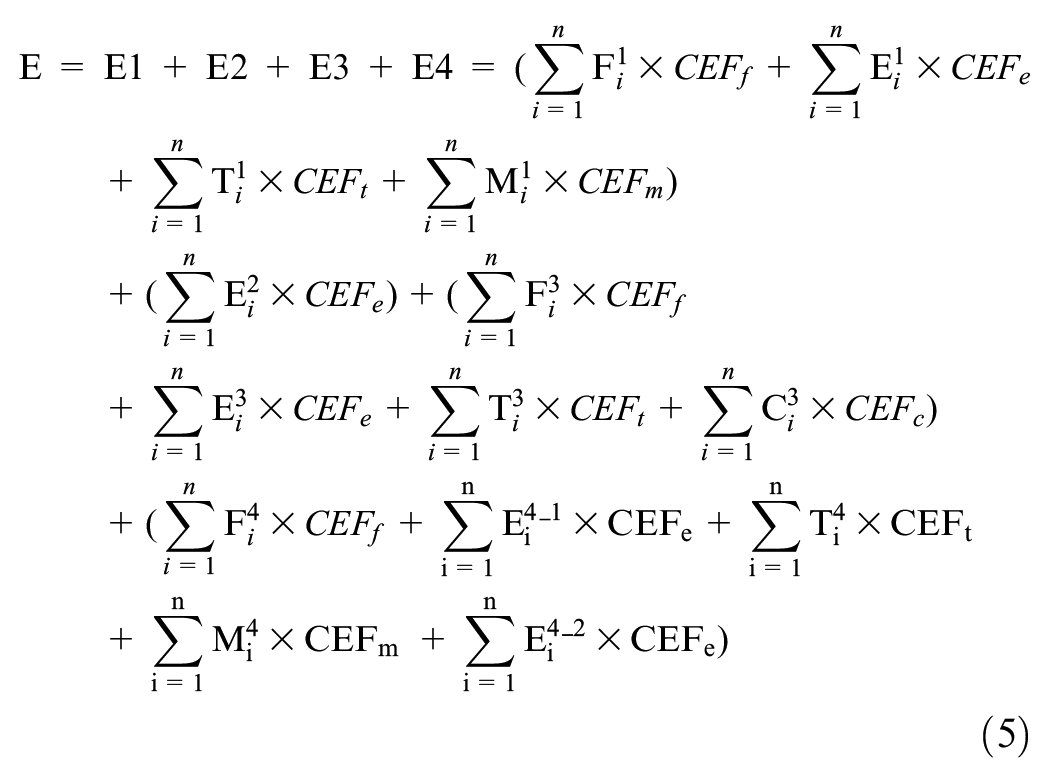
As previously explained, input-output analysis, process analysis and hybrid analysis are the key analytical approaches for calculating carbon footprint in LCA. Nevertheless, these methods need long-term experience and demonstrate limited applicability in subsequent research design (Zheng et al., 2017). Therefore, the current study incorporates the concepts of LCA and the definition of system boundary in the above research to decompose the life cycle of CAT products. That is to say, in this study, there are four phases in CAT products: acquisition of original manuscript data, CAT data processing, storage and transportation of CAT data, and utilization of CAT products. Subsequently, in accordance with PAS 2050 and taking into account the actual carbon emission situation of translation products in China, the study formulates the calculation formulas for the carbon footprint in each phase of CAT products.
Phase of Acquisition of Original Manuscript Data
At the commencement of a CAT project, the translator typically receives the manuscript either from the project manager or directly from the client. Initially, this manuscript is often in hard copy form. Thus, at the original manuscript stage, the manufacture of CAT products primarily makes use of raw materials such as wood, reed, sugarcane bagasse, rice straw, wheat straw, cotton straw, hemp straw, and cotton for paper production (He, 1990). In the process of paper manufacturing, the Chinese paper industry predominantly relies on the thermal energy generated by fossil fuels, such as coal and natural gas, which are utilized in pulp and paper production. Therein, fossil energy accounts for about 80% of total consumption energy, while biomass energy accounts for less than 20%. 1 As a result, during the phase of acquiring original manuscript data in CAT products, the present study posits that the carbon footprint primarily stems from the combustion of fossil fuels, electricity consumption, thermal energy consumption and methane emissions resulting from anaerobic treatment of wastewater (National Development and Reform Commission in the People’s Republic of China, 2011b).
Phase of CAT Data Processing
In the context of a CAT project, the translator typically resorts to CAT tools such as Trados and memoQ for the translation of manuscripts. Prior to translation, some translators or project managers may utilize optical character recognition (OCR) technology (IBM, 2022) to convert the document format, thereby ensuring compatibility with the requirements of CAT software. For example, a translator may employ ABBYY ABROAT DC, a format transfer software, to convert a document in .pdf format into .docx before translating the manuscript. A large amount of electricity will be consumed in this process. Subsequently, CAT software, translation memory databases and translation terminology banks emerge as the primary tools enabling translators to complete manuscript translation (Bowker, 2002). In this process, electricity serves as the principal driver.
Phase of Storage and Transportation of CAT Data
During the storage and transportation stage of CAT data, within the same translation team, project-sharing serves as the primary means for the exchange, transport and storage of manuscript data. Specifically, translators working on the same project are able to share their translation progress, translation terminology, translation memory, and revision traces within the web-based client-server architecture (Koehn, 2009). For instance, the translator undertakes the translation of a sentence on a per-sentence basis. Meanwhile, the context, encompassing both the preceding and following paragraphs, is presented to other translators for their reference (Koehn, 2009). Hence, during the CAT product processing, the processing phase, along with the storage and transportation phases, occur simultaneously within the computer system. This concurrent nature is a fundamental characteristic of CAT operations, as it allows for the seamless integration of translation tasks. Additionally, to safeguard against potential data loss resulting from computer malfunctions, the utilization of mobile storage media such as compact discs (CDs), cloud disks, and storage cards is essential. These storage options serve as reliable backups for storing and updating translation data. Their importance lies in the fact that they provide an additional layer of security, ensuring the integrity of the translation corpus even in the face of system malfunctions.
Drawing on the carbon emission inventory of the Chinese electronic equipment manufacturing industry (National Development and Reform Commission in the People’s Republic of China, 2011c), in the production of mobile storage media, carbon emissions, on one hand, originate from the combustion of fossil fuels in the presence of oxygen. On the other hand, the greenhouse gas emissions are from the chemical reactions or gas leaks during etching and chemical vapor deposition (CVD) chamber cleaning processes in semiconductor production. Also, electricity and thermal energy produce carbon dioxide. On the other hand, the greenhouse gas emissions in the semiconductor production sector originate from two primary sources. First, they are released during chemical reactions or gas leaks that occur in the etching and chemical vapor deposition (CVD) chamber cleaning processes. Second, the generation of electricity and thermal energy, which are integral to semiconductor manufacturing, also results in the production of carbon dioxide.
Phase of CAT Products Use
When CAT products are being utilized, the study focuses on two mainstream applications: the provision of paper-based target texts and electronic target texts for clients. Building upon the foregoing analysis, within the contexts of the paper’s target texts, fossil fuels, electricity generation, thermal processes and methane emerge as the main sources of greenhouse gases. However, within the context of electronic target texts, electricity serves as the primary source of greenhouse gas emissions. Since clients need to use relevant electronic devices to access and utilize these electronic target texts that are stored in electronic hard drives. Furthermore, in the national electricity grid in China, the electricity CEF is the same, and the statistical methods in IPCC (2006) are consulted.
Results
Model Findings
Based on the aforementioned identification and definition of the four principal phases that contribute to the carbon emissions of CAT products, the corresponding model findings are herein synthesized and explicated.
Model of Acquisition of Original Manuscript
Capitalizing on the analysis presented in section “Phase of Acquisition of Original Manuscript Data” and the statistical methodologies adopted by the IPCC, this study formulates the calculation formula for the carbon footprint during the first phase of the life cycle of CAT products (Equation 1):
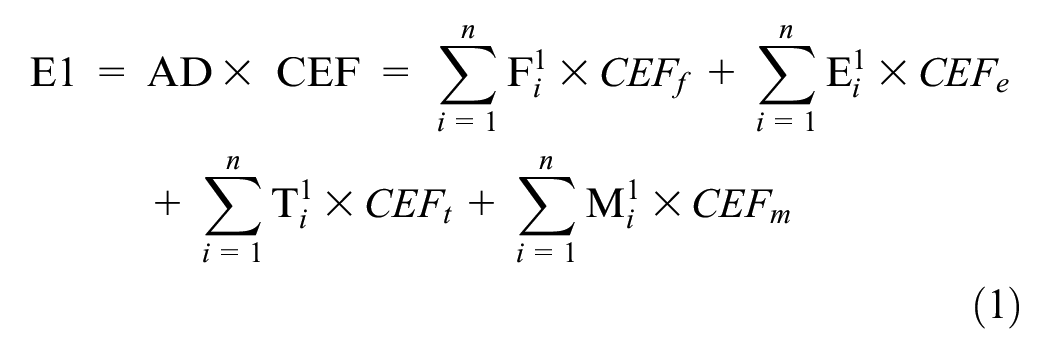
In Equation 1, E1 represents the total carbon footprint (emissions) in the first phase of CAT products. According to the IPCC report in 2006, the study deems that it is the product of activity data (AD) and carbon emission factor (CEF). AD pertains the aggregate consumption data of fossil fuels, electricity, thermal energy, and methane, measured at the physical level. The four measures are
Model of CAT Data Processing
In light of the actual circumstances in the second phase of CAT product processing, the present study formulates the calculation formula for carbon footprint (Equation 2):

In Equation 2, E2 represents the total carbon footprint (emissions) in the second phase of CAT products given that electricity is the major consumer.
Model of Storage and Transportation of CAT Data
Based on these analyses, this study forms the formula to calculate the carbon footprint in the phase of storage and transportation of CAT data (Equation 3):

In Equation 3, E3 represents the total carbon footprint (emissions) in the third phase of CAT products processing. As per the report of IPCC (2006), this study supposes that it is the product of AD and CEF. AD denotes the aggregate consumption regarding fossil fuels, electricity, thermal energy and chemical reactions in the third phase of CAT products processing The four aspects are depicted as
Model of CAT Products Use
In accordance with the above analysis for the use of CAT products, this study forms the calculation formula of the carbon footprint in the phase of CAT product use (Equation 4):
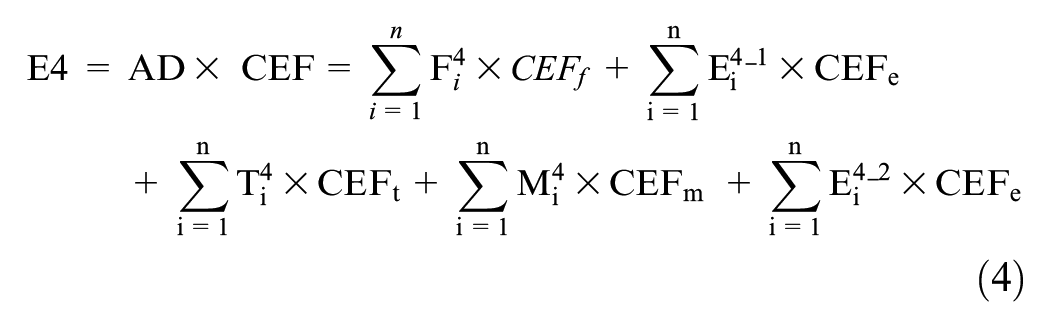
In Equation 4, E4 represents the total carbon footprint (emissions) in the fourth phase of the CAT product use. Pursuant to the report of IPCC (2006), the present study assumes that it is also the product of AD and CEF. AD denotes the aggregate consumption of fossil fuels, electricity, thermal energy and methane. As previously elaborated, CEF represents the carbon emission factor. Here,
In a nutshell, the carbon footprint analysis model of CAT products can be summarized (Equation 5).
Model Validation
Factor sensitivity analysis and uncertainty analysis stand as fundamental approaches in the validation assessment of models (Zheng et al., 2017). As per the current research design and the concepts of sensitivity analysis, this study employs mathematical methods, which is one of the sensitivity analysis techniques, to conduct a factor sensitivity analysis of the carbon footprint. This approach is adopted to evaluate the validity of the carbon footprint assessment during the processing of CAT products. The mathematical methods assess the sensitivity of a model output to the range of variation of an input (Christopher & Patil, 2002). Importantly, this approach aligns closely with the practical undertakings of CAT projects in China. Its details will be introduced in the following sections.
Factor Sensitivity Analysis
Based on Equations 1, 2, 3, and 4, it can be observed that the total carbon emission in the production of CAT products is likely to vary with the utilization of different quantities of materials. Moreover, the sensitivity of diverse factors to carbon emissions is manifest in the carbon footprint calculation outcomes for CAT products. The more sensitive the carbon emission factors, the larger the carbon footprint results, and the greater the room for improvement of this factor (British Standards Institution, 2011; Zheng et al., 2017). Therefore, the rules governing the changes in factor sensitivity within the simplex algorithms (Winston, 2022), which are derived from mathematical methods, will be adopted to evaluate the factor sensitivity in the current carbon footprint model. To begin with, the study standardizes Equation 5 to better construct the factor sensitivity matrix in accordance with sensitivity change rules in simplex algorithms, as shown in Matrix 1. Notably, this study assumes that CEFs for fossil fuels, electricity, thermal energy, methane and chemical reactions are, respectively, fixed in accordance with related documents (IPCC, 2006; National Development and Reform Commission in the People’s Republic of China, 2011a, 2011b, 2011c). In this context, this study considers them to be the value coefficients of the variables in the current model.
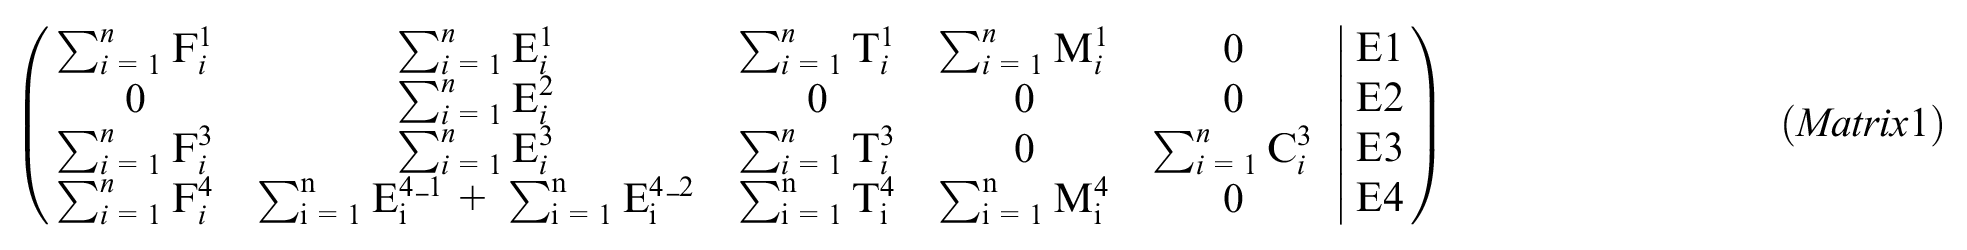
In Matrix 1, the left-hand side features a total of five columns. Each column represents variables associated with the carbon-emission factors across the four phases of CAT products. These stages encompass the acquisition of original manuscript data, the processing of CAT data, the storage and transportation of CAT data, as well as the utilization of CAT products. When the material quantity changes, the constraint coefficient,
Given that few material inputs can lead to diverse output of carbon emission outputs, the sensitivity of factors to such changes must be accounted for in Matrix 1. Based on the aforementioned analysis, this study constructs a matrix of factor changes (Matrix 2). Subsequently, using Matrix 2 as a basis, this study formulates the comprehensive factor-sensitivity analysis matrix equation (Equation 6).
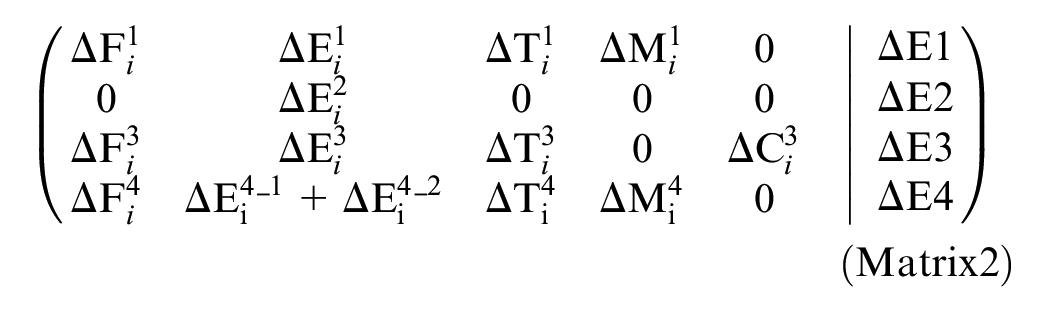

In Equation 6, E pertains to the product carbon footprint of the existing values of each factor; Ii signifies the current CEF value of the i-th in the production of CAT products.
Uncertainty Analysis
Substantial uncertainties pervade every stage of the process, from the acquisition of original manuscript data, through the processing of CAT data, the storage and transportation of CAT data, to the utilization of CAT products. These uncertainties stem from multiple sources: subjective analytical discrepancies, diverse assumptions, the divergence between input and output data, parameter variations, and differences in statistical methods (Zhang et al., 2020)., In this study, uncertainties inherent in both input and output data exert a substantial influence on the outcomes of the product carbon footprint model (Lenzen et al., 2010). Hence, uncertainty analysis serves as a means to assess the consistency and reliability of the data quality within the present model. Due to the range of uncertainty parameters, this study considers using random variables to represent them. Importantly, the probability distribution functions as a robust substitute for the spectrum of uncertainty values, as posited by Zheng et al. (2017). This substitution is particularly crucial in the calculation of the reliability of carbon footprint.
In the context of global warming, the Europe Union has consistently demonstrated leadership in annual carbon emission control. This can be attributed to its globally advanced and unified carbon emission statistical system (Deng et al., 2021). In contrast, such a comprehensive system is currently absent in China. In view of this, this study considers the assessment method of uncertainty grounded in calculation factors (1/3 rule) from European Commission (European Commission, 2012, 2021). Specifically, drawing on historical data, the 1/3 rule posits, that in the context of a country’s specific activity data and regulations, when operators use a given quantity of raw materials to produce products, any fluctuation values derived from relevant materials in the analysis should not surpass one-third of the data generated during the manufacturing process (Deng et al., 2021).
So, the Equation 7 will be used to count the carbon emissions of CAT products in the event that uncertainties exist in the calculation factors within current model.

In Equation 7, while uncertainties exist in the current model,
Discussion
Broader Applicability
This study, for the first time, has pinpointed the carbon emissions of digital translation products in the digital age. Although the current model consults ISO 14044 and PAS 2050 standards, it displays clearer system boundaries and truncation rules when calculating the carbon footprint of each production stage in comparison with the two international criteria. This is because the system boundary and truncation rule of ISO 14044 and PAS 2050 are ambiguous and vague, as are the wordings in their regulations (Dias & Arroja, 2012; García & Freire, 2014). This fuzziness easily leads to different interpretation methods and calculation results for the same products. More importantly, these products are distinguished by their reproducibility, non-loss and similarity of raw materials in comparison with other physical products. These products’ characteristics indicate that the carbon footprint model in this study can be applied to more digital translation products rather than CAT products, such as pre-translated products in MT fields, as well as post-editing products from translators. This generalizability shows that the model boasts more profound practical meanings.
In this sense, when calculating the carbon footprint of CAT products, researchers need only consider the CEF values. This requirement can be attributed to two factors. Firstly, in China, the average CEF factors of power grids vary across different provinces and years due to their distinct geographical locations and climate conditions. For example, as per the statistics of the National Development and Reform Commission of China, in 2012, the carbon dioxide emissions per kilowatt-hour were 0.7757 kgCO2/kWh in Beijing and 0.5912 kgCO2/kWh in Guangdong. In contrast, by 2020, these figures had changed to 0.615 kgCO2/kWh in Beijing and 0.6379 kgCO2/kWh in Guangdong. As a consequence, in the context where CAT projects are implemented across different provinces in China, the corresponding CEFe values ought to be employed within the model (Equation 5).
On top of that, the model in this study embodies common raw materials, such as fossil fuels, thermal energy, electricity and methane. In China, these materials always have the same AD metrics in the same regions according to relevant reference standards. That is to say, for the same CAT projects, one variable remains constant, whereas the other varies in accordance with regional alterations. In contrast to other physical products, as examined in the works of Zhao et al. (2024) and Z. Li et al. (2024), this particular convenience offers two significant advantages. First, it alleviates the workload of researchers involved in calculating the carbon footprint. Second, it enhances the potential for the dissemination of the current statistical model to other digital translation products. This dual-benefit aspect not only streamlines research processes but broadens the applicability of the statistical model, thereby contributing to both research efficiency and the expansion of its reach within the domain of digital translation products. In summary, regarding the clarity of concept definition, convenience of statistical data as well as the workload of researchers, current model for computing carbon footprint of CAT products presents broader applicability to digital translation products.
Greener Translation
The sensitivity analysis results reveal that, among all stages, the data-processing stage of CAT products shows the least variation. In contrast, the product-use stage is highly susceptible to change even with minor alterations. That is, using CAT products in the market will generate more carbon footprints compared with other three stages. This phenomenon aligns closely with the perspectives put forward in prior research centered on digital carbon footprint (e.g., Deveci et al., 2024; Sharma & Dash, 2023; Zulfiqar et al., 2023). It also suggests that researchers ought to accord significant weight to the market circulation of CAT products. The rationale lies in the substantial environmental impact engendered by these products’ use. These findings, unquestionably, contribute to research on translation behavior on environmental protection, which is overlooked by previous translation studies. According to the Eco-Translatology theory proposed by Hu (2008), translation behavior is associated with natural environment, particularly in the sustainable development. That is to say, translation environment such as consumers’ preference and the choice of translation carriers in the CAT projects substantially influences the use of CAT products and their total carbon emissions.
First and foremost, regarding the choice of translation carriers, according to the statistics of the Translators Association of China in April 2025, in contrast to the past prevalence of paper-making manuscripts, a growing number of translators now tend to utilize electronic manuscripts, 97.1% of which are related to large-language models. This trend is underpinned by the fact that, in most cases, the CEF of electricity is lower than that of fossil fuels used in paper production because fossil fuels involve more raw materials. The use of electronic manuscripts thus aligns with more environmentally-friendly practices. Therefore, it is a better choice for sustainable development. By contrast, a greater number of paper-making manuscripts are likely to be recycled until their utility is completely exhausted. This reuse lengthens the calculation time of carbon footprint, further amplifying the total carbon emissions. The different impacts of two usage methods on carbon footprint are regarded as two tips to remind translators and the language providers of the use of electronic manuscripts.
In the context of consumer preferences, consider, for instance, the scenario of translating a company’s publicity materials. Target readers increasingly tend to opt for digital advertising brochures over their printed counterparts. This shift in preference is a significant factor that translators must take into account when handling such translation tasks, as it directly impacts the reach and effectiveness of the translated content. In terms of environmental considerations related to the preference for digital materials, when calculating the overall carbon footprint, researchers find that the E in the sensitivity analysis can be reduced in such electronic materials. This way not only caters to the consumers’ preference, but decreases the carbon footprint in a scientific way. More significantly, the preferences of these consumers and the choices made by translation carriers, grounded in the principles of quantified data, convey a more environmentally-friendly perspective on translation. This approach demonstrates a relatively high degree of feasibility and scientific nature.
Nimbler Strategies
The uncertainty model reported previously unveils that the carbon footprint factor (CEFu) serves as the primary determinant of the fluctuations in the aggregate carbon emissions of CAT products. Herein, CEFu comprises the carbon footprint from fossil fuels, electricity, thermal energy, methane and chemical reactions. Among the five factors, electricity is the main decider. This finding is consistent with the viewpoints of prior literature (e.g., Chen & Ma, 2024; Levasseur et al., 2021) that electricity is the main carbon source of electronic products. This is attributable to the fact that these products, similar to CAT products, are manufactured using electricity.
However, fortunately, compared with other physical and digital products, the production flow of CAT products is relatively transparent. Accordingly, carbon footprints for five aspects are likely to be obtained, especially those for electricity metrics. For example, a Lenovo computer bearing the ID TP00106B (20 V, 2.25 A) is utilized to produce a CAT product in Guangdong for an hour. Its total electricity consumption is 0.045 kWh. Moreover, its thermal energy consumption varies from 10 W to 18 W. In this sense, the total carbon emissions approximately range from 0.0351 kgCO2 to 0.0402 kgCO2. Over an hour, the uncertainty level of the carbon footprint of a CAT product ranges from 9.58 × 10⁻⁶ tC to 1.1 × 10⁻⁵ tC. The figures completely fall within the floating range according to the 1/3 rule.
These numerals suggest that choosing appropriate devices and CAT software with specific powers is pivotal in determining the degree of uncertainty in carbon emissions associated with the production of CAT products. Diminishing the uncertainty is instrumental in promoting the stability of the current model. Drawing on the insights of Lakim et al. (2022), software with fewer accessory components exhibits higher performance and lower electricity consumption. In that regard, memoQ software seemingly outperforms SDL Trados Studio software. The latter, specifically, is burdened with an excessive installation of accessory components, which likely accounts for its comparatively higher electricity consumption in relation to memoQ.
It should be highlighted that the 1/3 rule is suitable for the uncertainty of carbon footprint in the current model. This applicability connotes the selection flexibility of CAT tools as well as storage and transportation media in a CAT project as long as the carbon footprint of these choices is kept within the system boundary. In this context, CAT product stakeholders can leverage this flexibility to reduce the total carbon emissions. As an illustration, using available data sources and simple yet highly precise algorithms, they can choose the most cost-effective or data-accessible CAT tool without sacrificing the overall reliability of uncertainty estimates. As Shadiev et al. (2024b) pointed out, some CAT tools equipped with LMMs have superior performance and precision in terms of memory and terminology banks. Thus, they are preferred by users due to these superior qualities. In summary, operating within the framework of 1/3 rule for the uncertainty estimation, shareholders of CAT products can exercise a more flexible approach in selecting the production tools for CAT products.
Conclusions
Implications and Limitations
The present study first examines the carbon footprint of CAT products in the digital translation era. This examination is carried out from the dual perspectives of theoretical frameworks and practical applications. From the theoretical perspective, the current model lends supplementary empirical support to LCA theory and eco-translatology theory (Klöpffer & Grahl, 2014). As for the LCA theory, the current model of carbon emissions calculation defines a clear system boundary and takes various regional factors into account, indicating that subsequent investigation of carbon footprint of digital translation products can simplify the modeling process and just needs to take into account the carbon footprint factors in most cases. More importantly, this convenience enables relatively accurate prediction for decades due to the stability of energy consumption units for digital translation products. These advantages are conducive to the application of this theory in translation studies to comprehensively consider the environmental influence of digital products in the realm of translation. Second, regarding the eco-translatology theory, it, to date, focuses on the shareholders-related translation ecology, such as sponsors, target readers and cultural environment (e.g., Hu, 2020; Zhang & Umeanowai, 2023), ignoring the impact of translation activities on the macro-ecological environment. Evidently, this research addresses this theoretical lacuna. By doing so, it not only enriches the theoretical landscape but also deepens the theoretical exploration to engage with the profound issue of the fate of humanity. Significantly, this endeavor provides empirical evidence for the refinement of this theory in a scientific manner. In the context of the AI era, where the theory faces numerous challenges, such empirical support is crucial for its continued development.
As regards CAT practice, this modeling process in this study makes great contributions to CAT project management and policy formulation of translation industry. With respect to CAT project management, first, the sensitivity factors in the current model can help managers to accurately identify emission hotspots and promote refined environmental management in CAT projects. For example, they can popularize of cloud collaboration tools, such as Memsource and YiCAT, to settle the problem of high energy consumption on local servers. Furthermore, the translation company can implement electronic document authentication through blockchain technology to reduce paper material consumption. Finally, managers can prioritize choosing greener CAT project providers to decrease the carbon emissions in the entire supply chain. These actions can cut down the cost of carbon certification in the international market. Most importantly, these management changes can force the translation industry to innovate in the production of CAT products in a low-carbon way, achieving the synergy between emission reduction and efficiency improvement.
Regarding policy-making, the model parameters can facilitate the establishment of an industry carbon accounting framework to guide innovation in policy tools. Specifically, circumscribing the system boundary to the product of a CAT project for the standardization of carbon data collection holds significant promise for the establishment of carbon databases within the translation industry. Relying on these databases, the government can provide some tax incentives to green and low-carbon enterprises that advocate remote working, and incorporate them into the national carbon regulatory system. If possible, the regulatory system can establish mutual recognition of low-carbon translation standards among “the Belt and Road” countries, lowering the low-carbon certification costs for cross-border projects. These policies will be more effective in enabling enterprises and the government to address trade barriers, as asserted by Habib et al. (2024). Such barriers are engendered by the levying of additional fees on translation products related to high-carbon content.
Notwithstanding its innovation, this study is encumbered with several limitations that the author must acknowledge when presenting results to readers. To start with, implicit carbon emissions should be considered when producing CAT products with the current model because the computer standby (sleep or hibernation mode) still consumes electricity. Although these consumptions are tiny in comparison with those of their working mode, they still contribute to hidden carbon emissions. Therefore, future research can take into account more implicit carbon indicators in the model to provide a more comprehensive and nuanced portrayal of the carbon emissions associated with digital translation products. In addition, due to the limitation of article length, this study does not consider too much specific parameters of CAT products and their tools. Future studies can encompass more examples about a particular product and offer more specific performance data, such as the energy consumption of graphics cards and the raw materials of mobile media, which may impact the carbon emissions. As a final point, this study places significant emphasis on the carbon footprints of CAT products in China. In future research, the scope could be broadened to encompass other countries, including the United States, South Korea, and Japan.
Summary
This study undertakes a comprehensive analysis and construction of the carbon footprint model for CAT products from the lens of LCA. By doing so, it enables stakeholders to focus on green translation and the sustainable development of digital translation industry in the context of global warming. In spite of some limitations, this study sheds light on the estimation of the carbon footprint of CAT products, and potentially, other digital translation products as well from a theoretical and practical perspective. In the future, efforts to address the aforementioned limitations, such as considering more implicit carbon emissions, adding more specific examples, and expanding the national scope, will contribute to more effective carbon footprint analysis in the studies of translation products.
Footnotes
Acknowledgements
The author would like to extend sincere gratitude to all anonymous reviewers and editors whose invaluable contributions have significantly enhanced the quality of this manuscript.
Ethical Considerations
The paper does not include any tests on animals or humans performed in the laboratory or elsewhere.
Consent to Participate
Not applicable.
Author Contributions
The entire manuscript, encompassing aspects such as its design, writing, editing, and revision, was solely completed by Hong Xie.
Funding
The author received no financial support for the research, authorship, and/or publication of this article.
Declaration of Conflicting Interests
The author declared no potential conflicts of interest with respect to the research, authorship, and/or publication of this article.
Data Availability Statement
The data generated during the study are available from the corresponding author upon reasonable request.