
Abstract
Bridging the digital divide between urban and rural communities is critical for expanding financial inclusion. The purpose of this study is to understand the key factors driving the adoption of financial technology (FinTech) applications among rural residents. A conceptual framework is built on the basis of the technology acceptance model, along with the incorporation of innovation awareness and financial awareness. The relationships between factors are empirically validated using a structural equation modeling approach based on survey data from a sample of 386 respondents in rural communities. The results indicate that perceived usefulness, perceived ease of use, innovation awareness, and financial awareness can positively and significantly affect the intention to adopt FinTech applications. In addition, perceived usefulness mediates the relationship between perceived ease of use and behavioral intention. Practical implications for promoting FinTech adoption in rural areas are discussed.
Plain language summary
We investigate the key factors driving the adoption of financial technology (FinTech) applications among rural residents. The findings reveal that: (1) The extended TAM model is suitable for studying FinTech adoption in a rural context. (2) Perceived usefulness, perceived ease of use, innovation awareness, and financial awareness positively and significantly affect the intention to adopt FinTech applications. (3) Perceived usefulness mediates the relationship between perceived ease of use and behavioral intention. We suggest that policymakers can offer education and training programs to improve financial literacy and financial awareness, promoting the use of FinTech products. FinTech products should be simple to use and navigate for rural residents who might not be as tech-savvy. It is important to foster a culture of innovation in rural areas by providing incentives for entrepreneurship and innovation.
Keywords
Introduction
The FinTech industry has seen a significant increase in adoption and investment in recent years. For example, digital payment platforms, such as PayPal, Zelle, Venmo, and Square, have made it easier for people to make and receive payments electronically. Digital payment platforms have also become increasingly popular in e-commerce, enabling consumers to purchase goods and services online. Meanwhile, FinTech has disrupted traditional lending by making it easier and faster for individuals and small businesses to obtain loans (Agarwal & Zhang, 2020). Online lending platforms use technology to streamline the loan application process, making it more accessible and convenient for borrowers (Song et al., 2018). Digital banks, such as Chime and Varo, have emerged as competitors to traditional banks, offering consumers a range of digital banking services. In addition, the rise of robo-advisors, such as Betterment and Wealthfront, has made it easier for consumers to access financial advice and investment services. Robo-advisors generally use algorithms and data analysis to provide personalized investment advice and management. As technology continues to evolve and consumer preferences change, it is expected to see continued innovation in the FinTech industry. At the same time, it is noted that FinTech applications are more prevalent in urban areas due to the density of the population and the availability of infrastructure (Kong & Loubere, 2021). Urban areas have a higher population density than rural areas, which means there are more potential users for FinTech applications. This could make it easier for FinTech companies to scale their services and reach a larger audience. Moreover, urban areas have better infrastructure than rural areas, which means that there is generally more access to high-speed internet, mobile devices, and other technologies that are necessary for using FinTech applications. Many FinTech applications offer lower fees and interest rates than traditional financial institutions, which is particularly important for urban residents who may be living in expensive areas and looking for ways to save money.
Studies have examined antecedents of Fintech adoption intentions and usage behavior (Ryu, 2018; Singh et al., 2020). Additional salient determinants identified include trust and security perceptions (Firmansyah et al., 2023). Exogenous shocks like the COVID-19 pandemic have also catalyzed increased adoption of contactless FinTech payments (Hasan et al., 2021; Le, 2021). Extant research on FinTech adoption utilizes predominantly urban, technologically adept samples, providing limited perspicacity into FinTech adoption among rural populations. Rural residents face impediments to internet connectivity and technological proficiency. Online sampling methodologies likely preclude the participation of rural citizens. Considering digital divide issues, rural FinTech adoption requires dedicated examination. Bridging the noticeable gap in current research on FinTech adoption in rural landscapes, this study delves into the distinct factors influencing rural residents’ intention to adopt FinTech applications, shedding light on a hitherto underexplored area within the FinTech adoption literature.
There are several obstacles that could hinder the adoption of FinTech for rural residents. First, rural residents have limited access to technology and internet connectivity and may not have smartphones or other devices necessary to use FinTech products and services (Bernards, 2022; Morgan, 2022). Second, rural residents may have limited financial resources, making it difficult to invest in technology or to pay for the fees associated with some FinTech products and services. Third, rural residents may not have the financial literacy skills necessary to understand how to use FinTech applications (Hasan et al., 2021). They may not be familiar with financial concepts or may not understand how to manage their finances effectively. Fourth, rural residents may be conservative about new financial technologies and may prefer to use products and services offered by traditional financial institutions that they are familiar with (Fakir, 2021; He et al., 2019). Fifth, FinTech products and services may not be customized to meet the specific needs of rural residents, who may have different financial needs and challenges than those living in urban areas (Malecki, 2003). These obstacles can make it challenging for rural residents to adopt FinTech products and services. However, by working to address these challenges, it is possible to bring the benefits of FinTech to people living in rural areas. Therefore, it is important to investigate key factors driving rural residents’ intention to adopt FinTech applications. By understanding critical determinants, FinTech companies and policymakers can develop targeted strategies to encourage adoption and improve financial inclusion in rural areas.
This study also endeavors to contribute to the theoretical landscape by constructing a nuanced conceptual model rooted in the technology acceptance model (TAM) theory. The classic TAM theory depicts a theoretical framework for understanding user adoption and usage of new technologies (Davis, 1989; Marangunić & Granić, 2015), and it has been used in various contexts (Ammenwerth, 2019; Natasia et al., 2022; Scherer et al., 2019). However, TAM has some limitations when investigating technology adoption among rural residents. First, TAM assumes users are already aware of and have access to the technology, but many rural residents have limited exposure to new innovations like FinTech due to digital divide issues. Second, TAM does not account for user differences like varying levels of tech skills and financial literacy. Digitally marginalized rural residents often have less tech expertise and financial capability. Therefore, TAM needs adaptation and extension to account for the unique barriers, conditions, and norms of rural populations. Recognizing the unique challenges faced by rural residents, additional factors specific to the rural context need to be integrated, providing a comprehensive theoretical framework to understand and predict FinTech adoption intentions in rural settings. The research questions are: (1) Is the extended TAM model suitable in a FinTech adoption context? (2) What are the dynamics of factors affecting rural residents’ intention to adopt FinTech applications?
A structural equation modeling approach is used to test the hypothesized relationships between variables. This paper is structured as follows. Section 2 reviews the relevant literature with respect to TAM and FinTech adoption. Section 3 introduces the development of hypotheses. Section 4 describes the research methodology, including data collection and data analysis. Sections 5 and 6 present the research findings and discussion. Section 7 provides some practical implications. Sections 8 and 9 show the conclusion, limitation, and future research guidelines.
Literature Review
FinTech refers to the use of advanced technologies, such as artificial intelligence, blockchain, cloud computing, and big data technology, to achieve the goal of making financial services more accessible, affordable, and convenient for customers (Goldstein et al., 2019; Schueffel, 2016). FinTech encompasses a wide range of activities, including mobile banking, digital payment systems, cryptocurrencies, robo-advisors, and so on. FinTech can be used by traditional financial institutions to streamline their operations and offer new services, as well as by new, innovative companies that are disrupting the traditional financial industry (Stulz, 2019). As technology continues to advance and more people gain access to the internet and mobile devices, the adoption of FinTech products and services has grown rapidly around the world. However, people’s attitudes toward FinTech can be complexly multifaceted, and may be influenced by a wide range of individual and contextual factors (Utami et al., 2021). Several recent studies have rigorously investigated the factors shaping the adoption of FinTech (Firmansyah et al., 2023). For instance, Jin et al. (2019) conducted a comprehensive study on the consumer acceptance of FinTech products in Malaysia, uncovering that elements such as perceived usefulness, perceived risk, perceived cost, and relative advantage exert significant influences on FinTech acceptance. Building on this, Singh et al. (2020) identified perceived usefulness and social influence as pivotal determinants driving the behavioral intention to use FinTech services, drawing insights from a sample of 439 respondents. Mahmud et al. (2022) employed a nationwide representative sample of 1,282 respondents in Bangladesh to delve into the multifaceted adoption factors of FinTech. These studies contribute to the evolving understanding of the nuanced drivers behind FinTech adoption across diverse contexts. Some researchers also studied the impact of exogenous shocks like the COVID-19 pandemic (Hasan et al., 2021; Ryu, 2018). Additionally, recent studies in various geographic contexts, including Jordan, India, Australia, and Indonesia, have also contributed to understanding the diverse factors influencing FinTech adoption (Abuhashesh et al., 2023; Aggarwal et al., 2023; Chan et al., 2022; Nugraha et al., 2022).
While current research has yielded valuable insights into the determinants of FinTech adoption, a conspicuous research gap remains regarding the specific challenges and dynamics influencing rural residents. First, the prevailing body of literature predominantly centers on urban samples, thus offering a restricted viewpoint on the distinctive obstacles encountered by rural populations. Rural areas grapple with hindrances such as limited internet connectivity and lower technological proficiency, aspects that have not been sufficiently explored in the ongoing FinTech adoption research. Second, the prevalent online sampling methodologies utilized in existing studies may inadvertently exclude the participation of rural citizens who are not technologically proficient. This underscores the need for specialized research to address this gap and cultivate a more thorough understanding of FinTech adoption in rural landscapes.
The conceptual model in this study is built on the basis of the technology acceptance model (TAM). TAM is a theoretical framework that is used to explain and predict users’ acceptance of new technologies (Davis, 1989). It was first introduced by Davis and has since been widely used in the field of information systems research (Legris et al., 2003). The TAM proposes that users’ behavioral intention to use new technology is determined by two critical factors: perceived usefulness (PU) and perceived ease of use (PEU). PU refers to the user’s perception of how the technology will enhance his or her productivity, efficiency, or effectiveness in performing a task, while PEU refers to the user’s perception of how easy it is to learn and use the technology (Davis, 1989; Venkatesh et al., 2003). Various studies have demonstrated the reliability of the TAM in predicting behavioral intention in technology-related contexts (Marangunić & Granić, 2015; Tao et al., 2020). For example, Lu et al. (2003) developed a TAM model to explain factors influencing user acceptance of wireless internet technology. Gangwar and Date (2016) applied the TAM to investigate factors affecting cloud computing adoption intentions from a sample of 280 companies in information technology. Sohn & Kwon (2020) studied the TAM in an artificial intelligence context. Beyond technology, researchers have extended the TAM into diverse non-technological arenas. The foundational constructs of perceived usefulness and perceived ease of use have found application across various contexts. For example, Scherer et al. (2019) showed that the TAM can also be reliably used in education-related contexts. Mohammad and Szigeti (2023) investigated the determinants of Hungarian customers’ attitudes toward dairy functional foods. Expanding the TAM framework and enriching its explanatory power, recent studies have also incorporated external variables like facilitating conditions (Ammenwerth, 2019; Natasia et al., 2022).
While functionality-related factors are often emphasized by researchers in the existing literature, understanding users’ familiarity and receptiveness to novel financial technologies has often been overlooked. In fact, there is an underlying assumption in most studies that urban and rural populations have similar patterns of technology and innovation awareness. Rural communities often have distinct needs, access challenges, and socio-economic contexts that require separate examination. Technology awareness could influence access, understanding, and trust in FinTech applications, while innovation awareness may shape users’ perceptions of relevance and customization needs. Addressing these awareness dimensions is essential for the design of interventions that are tailored to the specific needs and conditions of rural communities, and it offers guidance on enhancing the effectiveness of initiatives aimed at improving technology adoption and innovation diffusion in rural areas.
The present study further explores the extension of the TAM to a FinTech adoption context. Specifically, two new external factors, innovation awareness and financial awareness, are incorporated in the conceptual model. It is hoped that the current conceptual model provides valuable guidance for understanding rural residents’ intention to adopt FinTech applications.
Hypothesis Development
Intention to Adopt
Figure 1 illustrates the conceptual framework proposed in this paper. First of all, the dependent variable is the intention to adopt or intention to use (the abbreviated term IU is used throughout this paper for intention to adopt, and the term IA is used to represent Innovation Awareness). The definition of behavioral intention can be traced back to the study carried out by Fishbein and Ajzen (1975). It reflects the strength of a person’s intention to perform a certain behavior. Existing theories, including the theory of reasoned action (Fishbein & Ajzen, 1975), the theory of planned behavior (Ajzen, 1991), and the technology acceptance model (Davis, 1989), have explained that behavioral intention could directly impact actual behavior. In general, the higher the level of behavioral intention, the greater the likelihood of actually performing the behavior. This study defines intention to adopt as the degree to which a person is inclined to adopt FinTech applications. As shown in Figure 1, it is proposed that the intention to adopt FinTech applications can be collectively affected by perceived usefulness, perceived ease of use, innovation awareness, and financial awareness.
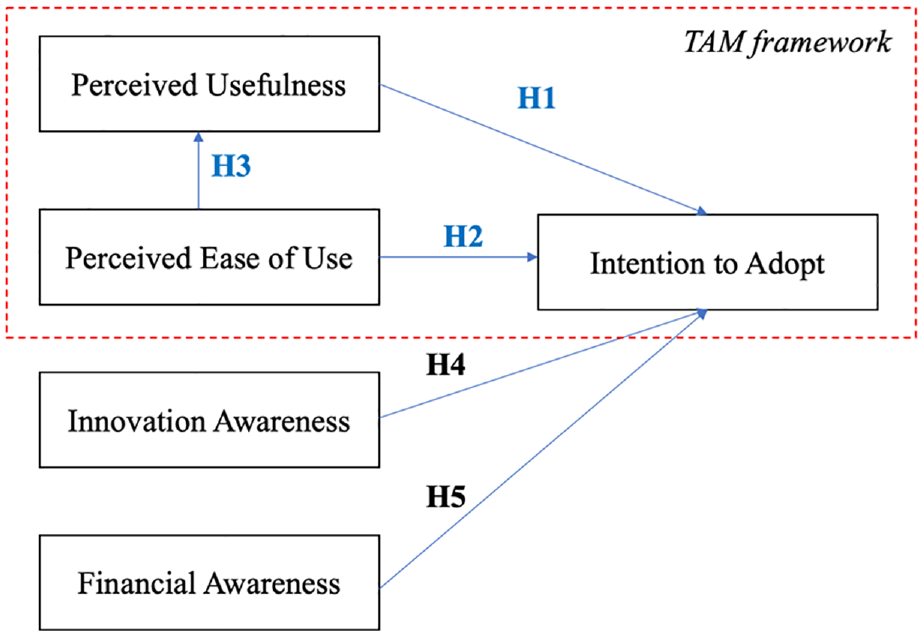
The conceptual model.
Perceived Usefulness
Perceived usefulness (PU) refers to a person’s subjective perception of the degree to which a particular technology or system would enhance his or her performance or productivity (Davis, 1989; Lu & Gustafson, 1994). It has been shown that PU is a crucial factor that influences a user’s intention to adopt and use a specific technology (King & He, 2006). PU places a greater emphasis on the “functional” and “rational” perspectives. Although PU is formally introduced in the TAM theory, it also has connections with other theories. PU is in fact, aligned with the value component of expectancy-value theory (Ajzen, 2020), and it reflects users’ subjective assessment of the value or utility they expect to gain from using the technology. Karahanna & Straub (1999) reckoned that PU has its roots in social presence theory, which has garnered increased attention in recent years, particularly in the study of individual behavior in online or virtual contexts (Yeboah et al., 2023; Zhang et al., 2022). A strong sense of social presence can enhance the collaborative and communicative aspects of technology, likely contributing to its perceived usefulness. Empirically, prior studies have validated the positive influence of PU on behavioral intention in various contexts (Marangunić & Granić, 2015). With respect to FinTech adoption, recent studies have also indicated a significant relationship between perceived usefulness and behavioral intention (Firmansyah et al., 2023). Hence, the following hypothesis is proposed:
Perceived Ease of Use
Perceived ease of use (PEU) is different from perceived usefulness in that it is concerned with the user’s perception of how easy or difficult a technology is to use, rather than its potential to enhance performance or productivity (Davis, 1989). In other words, PEU refers to the degree to which a user believes a technology is easy to use and understand. PEU focuses on the usability and user experience of the technology (Venkatesh, 2000; Venkatesh & Davis, 1996). A technology that is perceived as both useful and easy to use is more likely to be adopted and used by users. While PEU is most directly associated with TAM, its roots can be traced to broader psychological and behavioral theories, such as the theory of planned behavior (Ajzen, 2020; Bosnjak, 2020) and task technology fit theory (Furneaux, 2012). Cognitive load theory may also be relevant, as it posits that well-designed user interfaces with low cognitive load contribute to an easier and more efficient user experience (Sweller, 2020). This aligns well with users’ PEU. In technology adoption, users are more likely to accept and use a new technology if they perceive it as having a low intrinsic cognitive load, meaning the tasks are not overly complex or difficult to understand. Various empirical studies have clearly indicated the positive relationship between PEU and behavioral intention (Hess et al., 2014; King & He, 2006). Additionally, researchers have shown that PU could act as a mediator between PEU and behavioral intention (Marangunić & Granić, 2015; Nguyen et al., 2020). The following hypotheses are therefore proposed:
Innovation Awareness
Innovation awareness (IA) is a significant concept in the field of innovation management, and it is a crucial factor that influences a person’s ability to recognize and respond to new opportunities or threats in their environment (Hidalgo & Albors, 2008). The ability to see and assess new opportunities, as well as a greater willingness to experiment and accept risks, are normally correlated with higher levels of IA. Education, training, and exposure to new experiences may all help to raise IA. In fact, IA is rooted in the diffusion of innovation theory (Rogers et al., 2008), which explores how new ideas and innovations spread within a social system. Awareness is a crucial stage in the adoption process, as individuals must first become aware of an innovation before they can consider its adoption. Studies have implied that innovation awareness could greatly affect the diffusion of innovations (Larsen, 2011; Valente & Rogers, 1995). An innovation is more likely to be embraced and spread throughout a population when more people are aware of it and its potential benefits. Besides, rural communities often exhibit strong social ties and imitation effects (Luo et al., 2022). By enhancing innovation awareness, a positive atmosphere can be created within the community, encouraging rural residents to share and imitate each other’s experiences in using new technologies. This fosters the spread and adoption of technology within communities. Based on the above discussion, the following hypothesis is proposed:
Financial Awareness
A person’s knowledge and comprehension of financial topics, including budgeting, saving, investing, borrowing, and financial planning are referred to as their level of financial awareness (Nga et al., 2010). It can be described as the extent to which a person is knowledgeable about financial terms, products, and services, and is able to make rational financial judgments. Considering the characteristics of rural residents and the implications of the financial socialization theory (Gudmunson & Danes, 2011), FA could be a critical factor. Financial socialization theory explores how individuals acquire financial knowledge and attitudes through socialization processes, including family, education, and peer influences. FA can be shaped by the financial socialization experiences individuals undergo during their formative years. In rural areas, families play a crucial role in transmitting financial values and attitudes. Traditional financial practices and attitudes toward technology are often passed down through generations. Besides, rural residents may have limited access to formal financial institutions, and their establishment of FA predominantly hinges on diverse socialization processes. Conversely, urban residents may rely more on formal financial education and other similar approaches to enhance their FA. Financial awareness (FA) is similar to the concept of financial literacy, which enables people to make informed decisions regarding their financial well-being (Huston, 2010; Taft et al., 2013). The ability to handle one’s own financial life, develop financial plans, and make informed decisions is correlated with having a high level of FA (Kumar & Pathak, 2022). On the other hand, poor financial judgment, financial stress, and unfavorable financial results can result from a lack of FA. A high level of FA is associated with a greater understanding of financial products and services, as well as a greater capability to evaluate the potential benefits and risks (Sunderaraman et al., 2020). Individuals with a high level of financial awareness are more likely to have a positive attitude toward FinTech and a greater intention to use it (Jin et al., 2019; Singh et al., 2020). Conversely, individuals with a low level of financial awareness may be more hesitant to use FinTech applications, as they may have a limited understanding of the potential benefits and risks, and they may also lack the knowledge and skills necessary to navigate any complexities (Kadoya & Khan, 2020). Therefore, the following hypothesis is proposed:
Research Methodology
Data Collection
The variables included in the conceptual model were measured using the items shown in the Appendix. Some items were adapted from previously validated studies (Kamal et al., 2020; Singh et al., 2020; Venkatesh & Bala, 2008) with the consideration of the current context. A 5-point Likert scale marking strongly disagree (1) to strongly agree (5) was used to measure items. The questionnaire was pre-tested and reviewed by a group of experts to ensure readability. Respondents were obtained offline in multiple rural areas in eight provinces (Jiangsu, Anhui, Hunan, Hubei, Sichuan, Chongqing, Guizhou, and Jiangxi). There are three reasons to select these provinces. First, the selected provinces represent a mix of economically developed and less-developed regions, considering indicators such as Gross Domestic Product (GDP) per capita, income levels, and employment rates. This selection accounts for potential regional variations in economic development. Second, according to the China’s National Bureau of Statistics, as of December 2022, the selected provinces have a similar internet penetration rate, with their average value being 73.45% and the national value being 75.60%. Third, before finalizing the selection, pilot tests and feasibility assessments were conducted in more than 20 provinces, and the selected provinces demonstrated a higher degree of receptivity and relevance to the research objectives.
Meanwhile, it should be noted that the definition of rural areas is crucial. Traditionally, rural areas in China were primarily considered as counties (Martin, 1992), where economic activities were predominantly centered around agriculture (Lanz et al., 2018), resulting in lower levels of output and population density. Given China’s rapid urbanization process, since 2007, the China’s National Bureau of Statistics has been developing an urban-rural classification system based on administrative codes. This system considers the geographical distance from the central urban areas to reclassify rural and urban areas, assigning a unique 3-digit code to each area. According to the latest classification criteria (National Bureau of Statistics, 2023), codes 200, 210, and 220 are designated as rural areas. Some recent studies have also adopted this standard in research practices (Li et al., 2022; Qi et al., 2022). A convenience sampling approach was used in this study. Conveniently available respondents were all informed of the purpose of the study, and they had the right to withdraw at any time during the survey. Specifically, the number of valid responses in Jiangsu, Anhui, Hunan, Hubei, Sichuan, Chongqing, Guizhou, and Jiangxi, is 68, 50, 55, 58, 70, 26, 32, and 27, respectively. The sample distribution aligns well with the population density of these provinces. Overall, a total number of 386 valid responses were collected and used for further data analysis.
While recognizing the challenge of low response rates and response bias in survey-based research, proactive measures were taken to mitigate this concern. The design of the questionnaire was approached with meticulous attention to detail, attempting to create a comprehensive and engaging instrument. In response to challenges such as participant disinterest, time constraints, and difficulties in understanding the questions, the survey instrument was crafted using clear and concise language to facilitate comprehension. Anonymity of responses was rigorously maintained to foster openness and reduce potential hesitancy in providing information. Besides, to check the presence of any common method bias, the Harman’s one-factor test was performed, and the test returned a value of 14.02%, smaller than a threshold value of 50% (Fuller et al., 2016). The test result suggests that the majority of the variance is not explained by a single factor and the presence of common method bias is highly unlikely.
Data Analysis
In questionnaire-based research, the significance of sample size lies in its pivotal role in bolstering statistical power and enhancing the external validity of study outcomes (Westland, 2010). An appropriate sample size not only augments the precision and reliability of survey data but also fortifies the robustness of statistical inferences, fostering a higher degree of confidence in the broader applicability of research findings. With a sample size of 386, the present study aligns with the nuanced insights from a study on SEM sample size requirements (Wolf et al., 2013), ensuring a statistically robust foundation for further analysis.
The profiles of respondents are outlined in Table 1, alongside average Intention to Use (IU) scores. First, analyzing age groups, the result implies a positive correlation between younger age and higher IU scores, suggesting a potential generational trend in FinTech adoption. Second, the trend regarding annual income suggests that rural residents with higher income levels may have a stronger intention to use FinTech applications. Meanwhile, it can be seen that the sample does not have a high concentration of any particular sub-demographic group. Overall, the sample shows a high degree of representativeness and suitability when compared to China’s broader population profiles. The gender, age, and income distribution generally align with national figures.
The Profiles of Respondents.

Note. CNY = China Yuan.
In fact, China’s urban-rural demographic divide, with 63.89% in urban areas and 36.11% in rural regions, is mirrored in a stark disparity in banking infrastructure. As of September 2023, according to the China Banking and Insurance Regulatory Commission, the total number of bank branches exceeds 220,000, yet approximately 80,000 are situated in rural areas, highlighting a pronounced imbalance in catering to rural financial needs. This discrepancy emphasizes the potential role of FinTech in fostering inclusive financial development. According to the public website of the Payment & Clearing Association of China, Fintech applications, particularly in rural areas, have shown significant growth potential, with mobile payment transactions surging at an average rate of up to 49.52% from 2015 to 2018, in contrast to a mere 5.76% average growth rate of offline bank branch ATMs during the same period. This underscores the transformative potential of FinTech in addressing rural financial inclusion and serving as an alternative to traditional banking channels, presenting an opportunity to create a more balanced financial landscape.
The collected responses were sequentially analyzed using a variety of approaches. First, the internal consistency of items was evaluated by the values of Cronbach’s alpha. Second, composite reliability and convergent validity were assessed by confirmatory factor analysis. Third, the correlation matrix was calculated to reflect discriminant validity. Fourth, the hypothesized relationships in the conceptual model were tested using structural equation modeling. The structural model analysis was carried out with the SPSS AMOS 26 software.
Results
Measurement Model Analysis
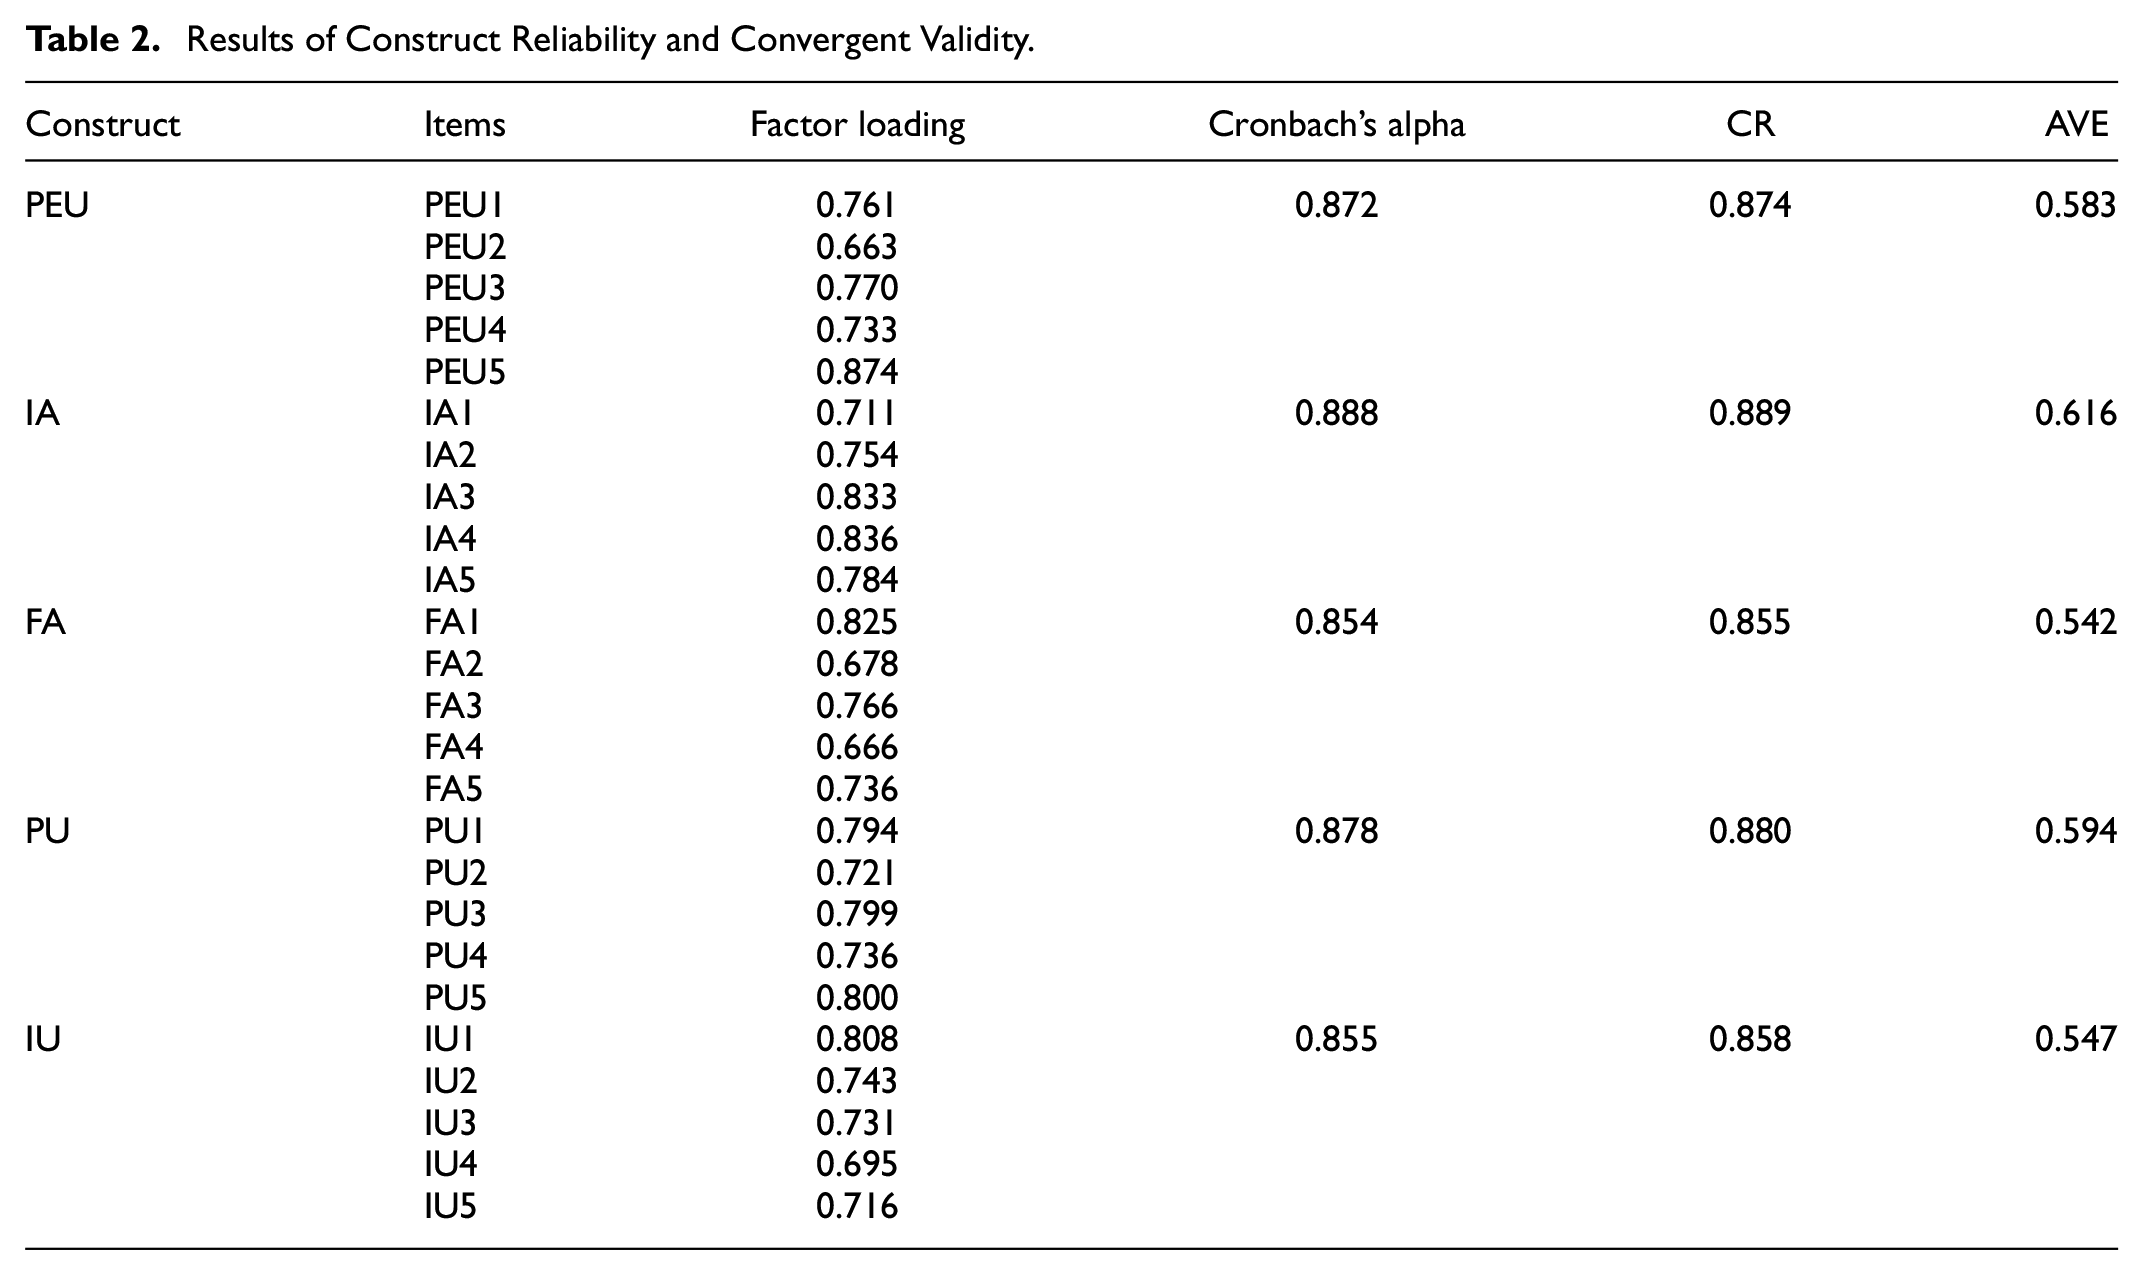
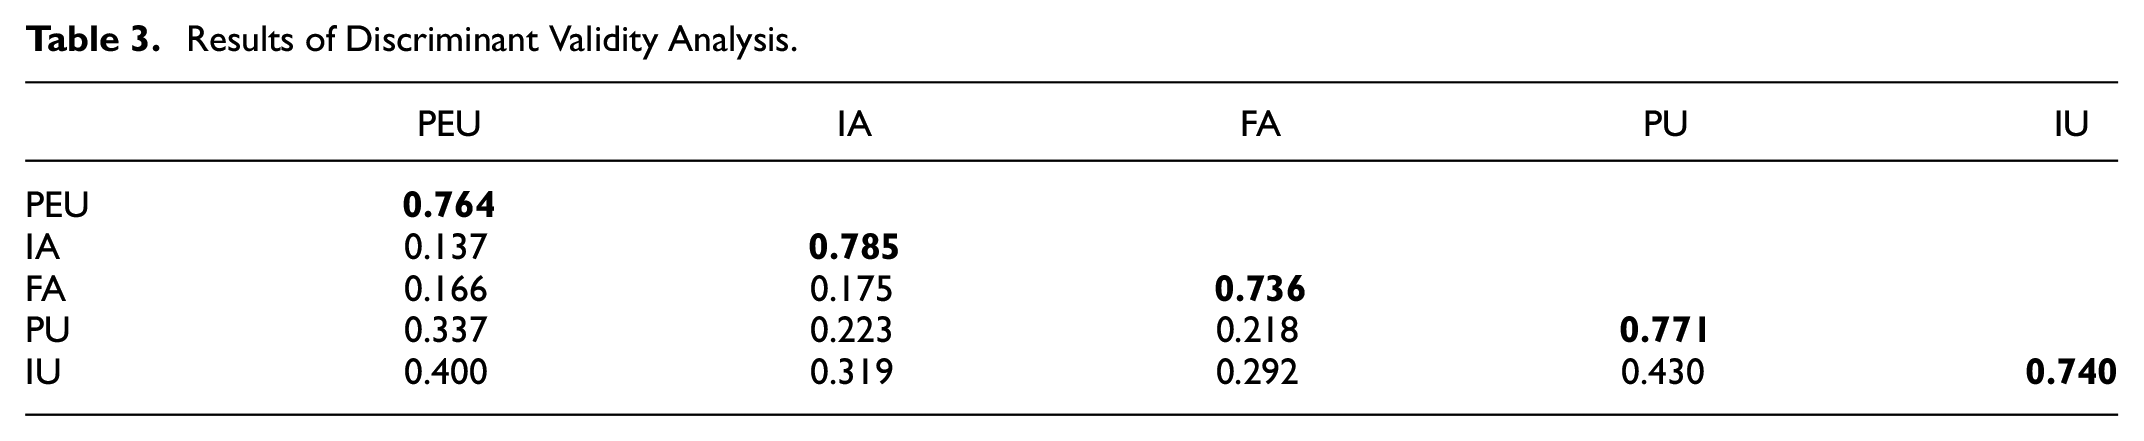
The measurement model analysis was performed to explore the reliability, convergent validity, and discriminant validity. First, the construct reliability can be reflected by the values of Cronbach’s alpha and composite reliability (CR). As shown in Table 2, Cronbach’s values of all constructs are greater than a recommended cut-off value of 0.7 (Hair et al., 2019). Composite reliability is a measure of the internal consistency of a measurement scale, which is the degree to which the items in the scale are measuring the same underlying construct. In general, the resulting value ranges from 0 to 1, with higher values indicating greater internal consistency and more reliable measurement of a construct. The composite reliability values are all above an acceptable value of 0.6 (Hair et al., 2019; Peterson & Kim, 2013), indicating convergent validity. Meanwhile, the average extracted variance (AVE) values and the factor loading scores of each item are all greater than the required value of 0.5, further indicating construct reliability and convergent reliability. Discriminant validity is a measure of how well a scale can be distinguished between different but related constructs. It is essential to ensure that the results of research studies are reliable and valid, and that the inferences drawn from the data are meaningful and accurate. The square root of the AVE of each construct was compared with its corresponding correlation coefficients with other constructs. As shown in Table 3, the correlation coefficients are all smaller than the corresponding AVE values (diagonal elements in bold are the square roots of the AVE values), suggesting that the criterion for discriminant validity is satisfied.
Results of Construct Reliability and Convergent Validity.
Results of Discriminant Validity Analysis.
Structural Model Analysis
Evaluating the reliability of the structural model, a variety of model fit indices have been calculated and shown in Table 4. The model fit indices of the measurement model are also included. It can be seen that all model fit indices are within the acceptable ranges, suggesting the accuracy of the structural model. It should be noted that the maximum likelihood estimation of the structural equation model assumes continuous, multivariate normal data (Hair et al., 2019). When the observed data conforms to the assumption of normality, the estimates derived from maximum likelihood estimation exhibit favorable characteristics. In practice, Likert data is often treated as approximately continuous, and guidelines suggest scales should have at least 5 points and multiple indicators per latent variable to lessen distributional concerns (Collier, 2020). While normality is desirable, SEM can still be robust to violations of normality, especially with larger sample sizes (Wolf et al., 2013). Meanwhile, it should also be noted that SEM assumes linearity in the relationships represented by path coefficients. A path coefficient represents the strength and direction of the relationship between two variables in the model. The results of path coefficient analysis are presented in Table 5. First, the influences of perceived usefulness (β = .317, p = .000), perceived ease of use (β = .292, p = .000), innovation awareness (β = .224, p = .000), and financial awareness (β = .189, p = .000) on IU are all significant, supporting the corresponding hypotheses. Second, perceived ease of use positively and significantly impacts perceived usefulness with an estimated path coefficient of 0.387, supporting the hypothesized relationships between PU, PEU, and IU. Third, to validate the hypothesized mediating effect of PU on the relationship between PEU and IU, the mediation analysis was performed via SEM through bootstrapping. Bootstrapping is particularly useful in mediation analysis because it does not assume the normality of the sampling distribution and provides more accurate estimates of standard errors and confidence intervals. In this study, the number of bootstrap samples was 2,000. The indirect effect represents the effect of the independent variable on the dependent variable through the mediator. It is the product of the path coefficient from the independent variable to the mediator and the path coefficient from the mediator to the dependent variable. The calculated results are shown in Table 6. It can be seen that PU partially mediates the path between PEU and IU with a standard indirect effect of 0.123. Both bias-corrected confidence interval and percentile confidence interval (at p = .05 significance level) were calculated. The standard indirect effect value is equal to the product value of 0.387 (PEU → IU) and 0.317 (PU → IU), further supporting the proposed hypotheses. The AMOS diagrams for confirmatory factor analysis (CFA) and structural equation modeling (SEM) are shown in Figures 2 and 3.
Results of Model Fit Analysis.

Note. CMIN = Chi-square statistics; DF = degree of freedom; GFI = goodness-of-fit index; NFI = normed fit index; IFI = incremental fit index; TLI = Tucker-Lewis index; CFI = comparative fit index; RMSEA = root mean square error of approximation.
Results of Path Coefficient Analysis.

p < .001.
Results of the Mediation Analysis.

Note. CI = confidence interval.

The AMOS diagram illustrating the measurement model (CFA model).

The AMOS diagram illustrating the structural model (SEM model).
Discussion
The research findings help address the research question regarding the applicability of the extended TAM in a FinTech adoption context. This study extended TAM in a way that also makes sense for a rural context by incorporating innovation awareness and financial awareness as additional variables. The results demonstrate adequate reliability and validity for the measurement instruments. The model fit indices from the SEM analysis also indicate that the proposed conceptual model is statistically sound and adequately fits the data. This provides quantitative evidence for the model’s appropriateness. As a diagnostic test, the exploratory factor analysis (EFA) was further employed to explore the underlying factor structure that emerges from the data itself for the sample. The EFA returned an explanatory power of 66.46%, in terms of total variance explained by extracted factors. As shown in Table 7, the factor structure resulting from EFA also aligns well with the conceptualization. Overall, it can be seen that the extended TAM has been appropriate and useful for the current context.
The Component Matrix from EFA.
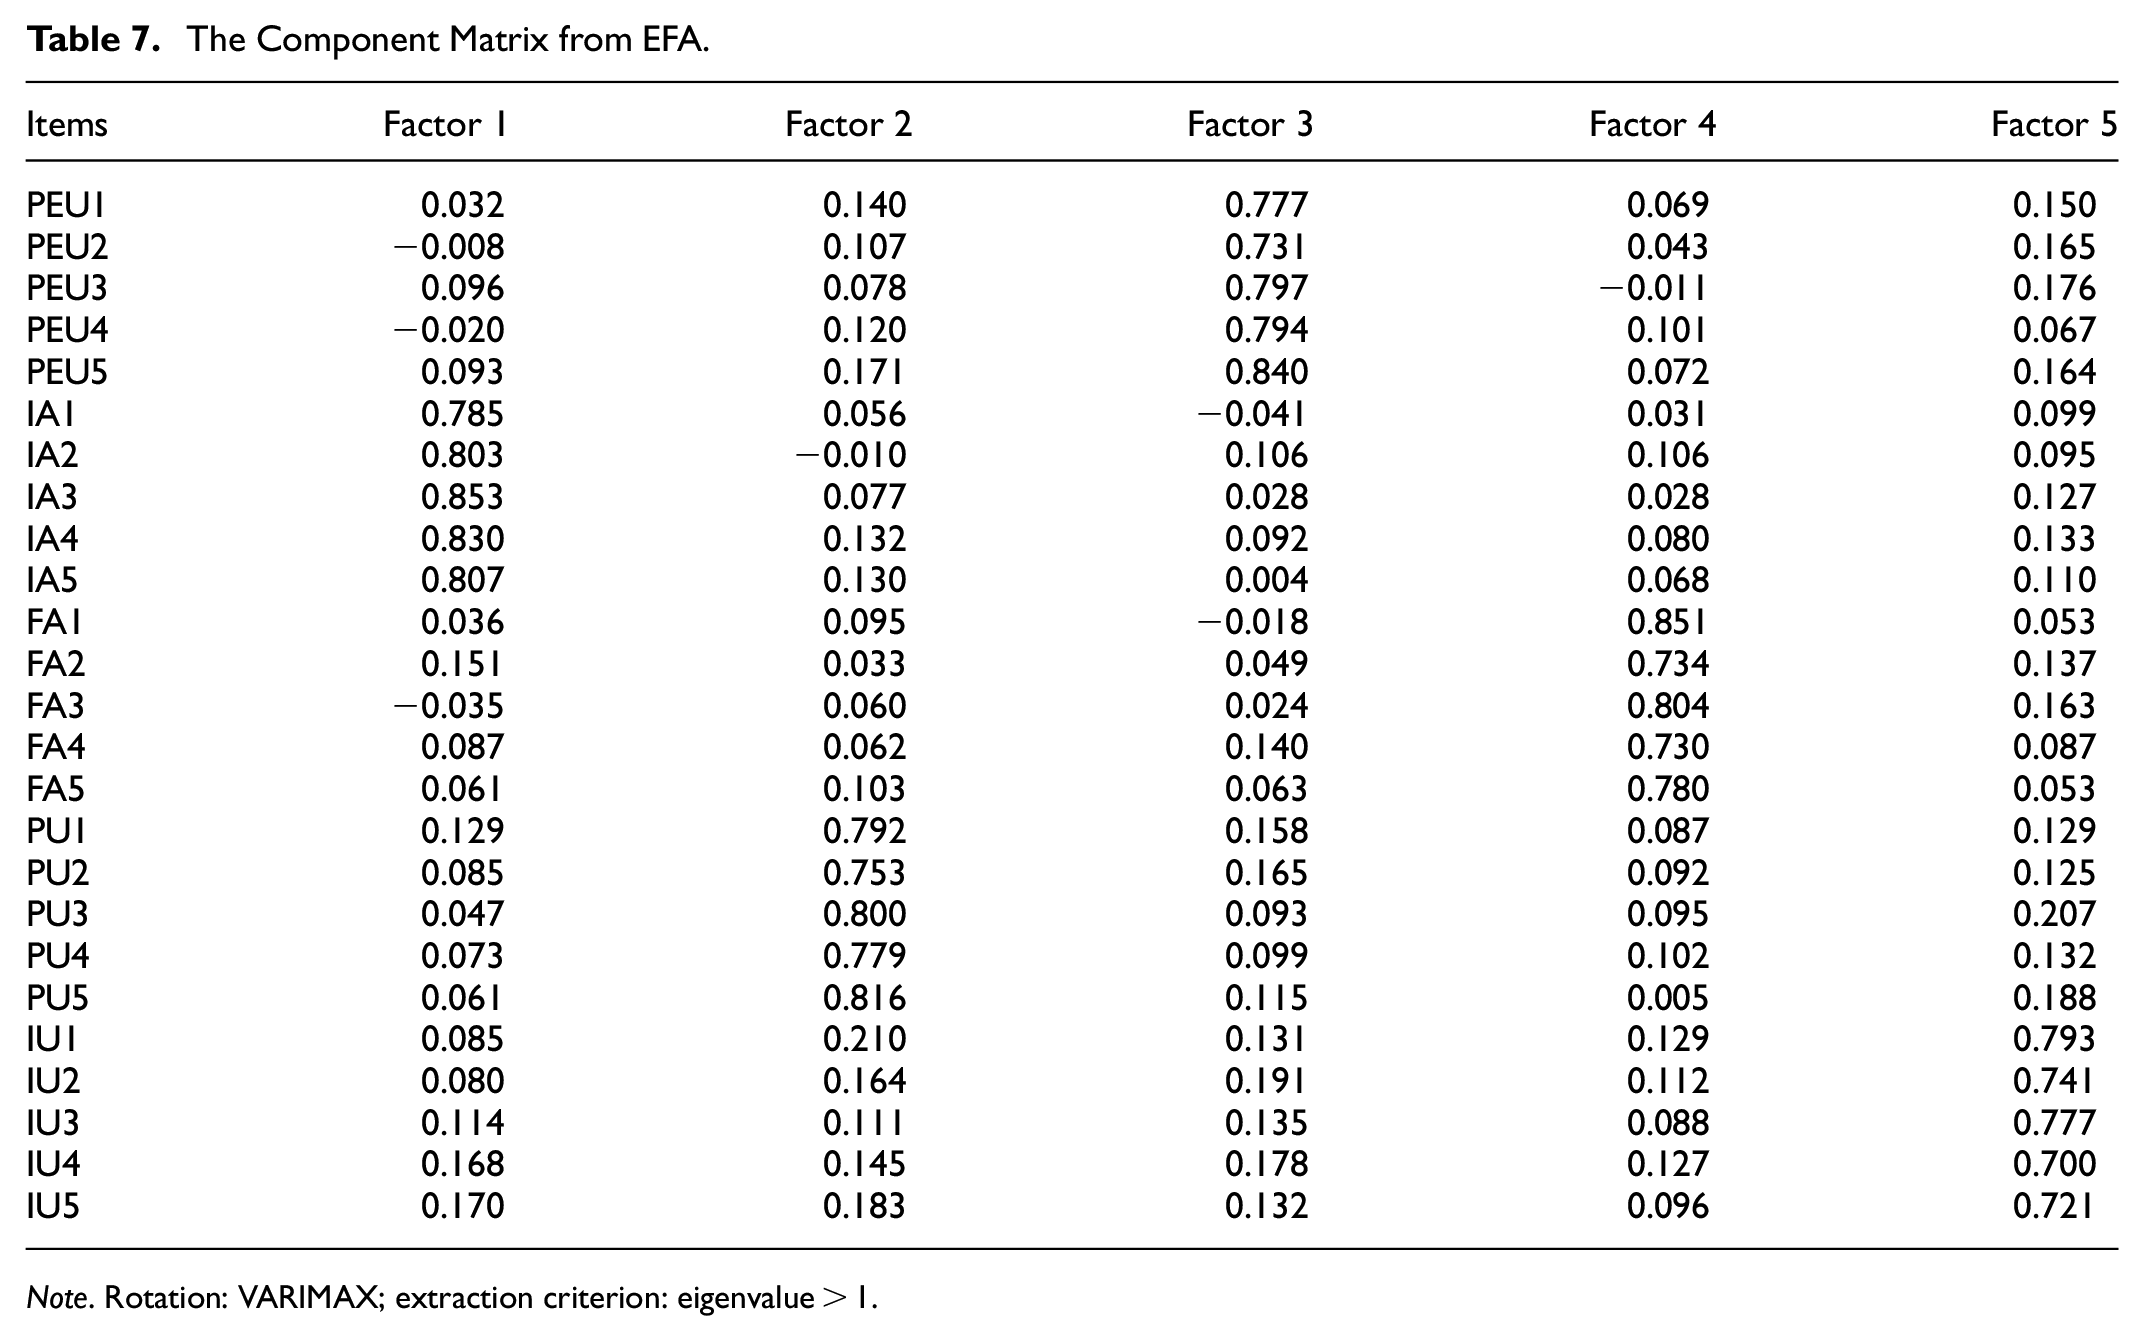
Note. Rotation: VARIMAX; extraction criterion: eigenvalue > 1.
In this study, perceived usefulness was found to be the most influential factor affecting the intention to adopt FinTech applications. Similar results have been reported by various researchers (Calisir & Calisir, 2004; Daragmeh et al., 2021; Perwitasari, 2022). This paper also validates the mediating effect of PU on the influencing path between PEU and IU. Given the direct effect of PEU on IU is 0.292, the indirect effect of PEU and IU is therefore calculated to be 29.64% of the total effect, suggesting a partial mediation. Besides, it has been shown that both innovation awareness and financial awareness positively affect IU with path coefficients of 0.224 and 0.189, respectively. By incorporating innovation awareness and financial awareness, this study moves beyond basic TAM to identify user mindsets that shape adoption in a rural context. Higher innovation awareness may allow rural users to look past ingrained norms and see greater potential benefits of FinTech tools. Those with more active financial learning orientations are also better equipped to take advantage of FinTech to achieve financial aims. In contrast to previous research, this study illuminates specific cognitive determinants of FinTech adoption unique to rural communities.
With respect to the dynamics between innovation awareness and FinTech adoption, a higher level of innovation awareness could help increase a person’s perceived self-efficacy, which refers to his or her confidence in the ability to perform innovative behaviors successfully. A higher innovation awareness also increases a person’s perception of the benefits and value of innovation. Drawing from the self-determination theory (Deci & Ryan, 2012; Migliorini et al., 2019), we posit that people who are motivated by their own curiosity and passion for innovation are more likely to develop innovation awareness and thus engage in some innovative behaviors. Meanwhile, rural residents are more capable to choose the appropriate financial products and services to satisfy their unique needs and goals when they have a higher level of financial awareness. The cognitive learning theory, which emphasizes the significance of active processing of information and knowledge in human learning and behavior (Ashman & Conway, 1997; Muñoz-Murillo et al., 2020), may also be the source of financial awareness. The implication is that individuals who can actively learn and process financial information are more likely to become financially aware and engage in behaviors that will advance their financial well-being.
Practical Implication
FinTech has the potential to increase financial inclusion and provide access to financial services to previously underserved populations. The present study has elicited several practical implications. First, FinTech companies, financial institutions, and policymakers can offer education and training programs to improve financial literacy and financial awareness, promoting the use of FinTech products. By becoming more financially literate, people are more likely to appreciate and adopt FinTech applications. Second, considering the significant impact of perceived ease of use on behavioral intention, it is recommended to provide FinTech products that are simple to use and navigate for rural residents who might not be as tech-savvy. This can involve creating FinTech products with user interfaces that are clear and straightforward, offering simple guides and tutorials, and reducing the number of steps needed to execute a transaction. At the same time, policymakers can address infrastructure issues by funding infrastructure development initiatives that increase rural communities’ access to energy and internet connectivity. This can make it easier for rural residents to access and use FinTech products and services. Third, policymakers are recommended to foster a culture of innovation in rural areas by providing incentives for entrepreneurship and innovation. This can include tax incentives for FinTech start-up companies and funding opportunities for rural entrepreneurs to develop innovative FinTech products and services that serve the specific needs of rural residents.
Conclusion
The objective of this study was to investigate the factors affecting rural residents’ intention to adopt FinTech applications based on empirical evidence from China. A conceptual model was adapted from the technology acceptance model by incorporating two additional factors. The hypothesized relationships between factors were tested via a structural equation modeling approach. The research findings suggest that: first, reliability, convergent validity and discriminant validity were all achieved, suggesting the suitability of the questionnaire and the conceptual model; second, perceived usefulness, perceived ease of use, innovation awareness, and financial awareness, positively and significantly affect the intention to adopt FinTech applications, with the estimated coefficients in the range of 0.189 to 0.387; thirds, it was also shown that perceived usefulness partially mediates the relationship between perceived ease of use and behavioral intention, with a standard indirect effect of 0.123. The research findings have elicited several practical implications, with respect to the goal of promoting financial inclusion through FinTech products and services in China’s rural areas.
Limitation and Direction For Future Research
Although the present study has helped enhance the understanding of rural residents’ intention to adopt FinTech applications on the basis of an extended TAM model, it still has several limitations. First, users who choose to adopt FinTech applications may differ from non-users in important ways that are difficult to control, such as level of education and job type. This may create self-selection bias, which could limit the soundness of the study to an unknown extent. Second, financial behavior is indeed very complex and can be influenced by a wide range of factors. There is still some room for improvement with respect to the conceptual model. Third, the present study does not consider the impact of the institutional environment on FinTech development, as regulatory frameworks may also affect FinTech adoption behavior. Fourth, while the structured nature of questionnaires ensures consistency, it may overlook nuanced aspects that could be explored in more open-ended formats. For example, the lack of personalization in questionnaire surveys could result in the potential loss of rich subjective insights that can be gleaned from one-on-one interviews. As compared to more interactive methods, the limited creativity inherent in questionnaires could constrain the range of participant responses and may fail to capture the diverse and nuanced perspectives of rural residents. Moreover, questionnaire-based research has the inability to capture nonverbal cues, such as facial expressions and body language. When studying complex phenomena like individuals’ attitudes and intentions, nonverbal cues can offer valuable context and depth.
Future research guidelines are proposed as follows. First, as FinTech adoption varies widely across different regions and cultures, studying these differences could help identify the cultural and economic factors that contribute to FinTech adoption. Second, longitudinal studies are recommended, as tracking FinTech adoption over time could provide insights into changes in adoption rates and the factors that influence them. Third, since FinTech is a rapidly evolving industry, and regulation plays a significant role in shaping its development, research that examines the impact of regulation or policy on FinTech adoption could provide meaningful insights into how to promote innovation while also safeguarding consumer protection. Fourth, future research directions should also consider employing in-depth interviews, focus group discussions, or mixed approaches. These methods can provide a more holistic understanding of the factors influencing rural residents’ FinTech adoption, overcoming the inherent limitations of the questionnaire-based method and enriching the depth of understanding in this evolving field.
Footnotes
Appendix
Item Statements of the Questionnaire.
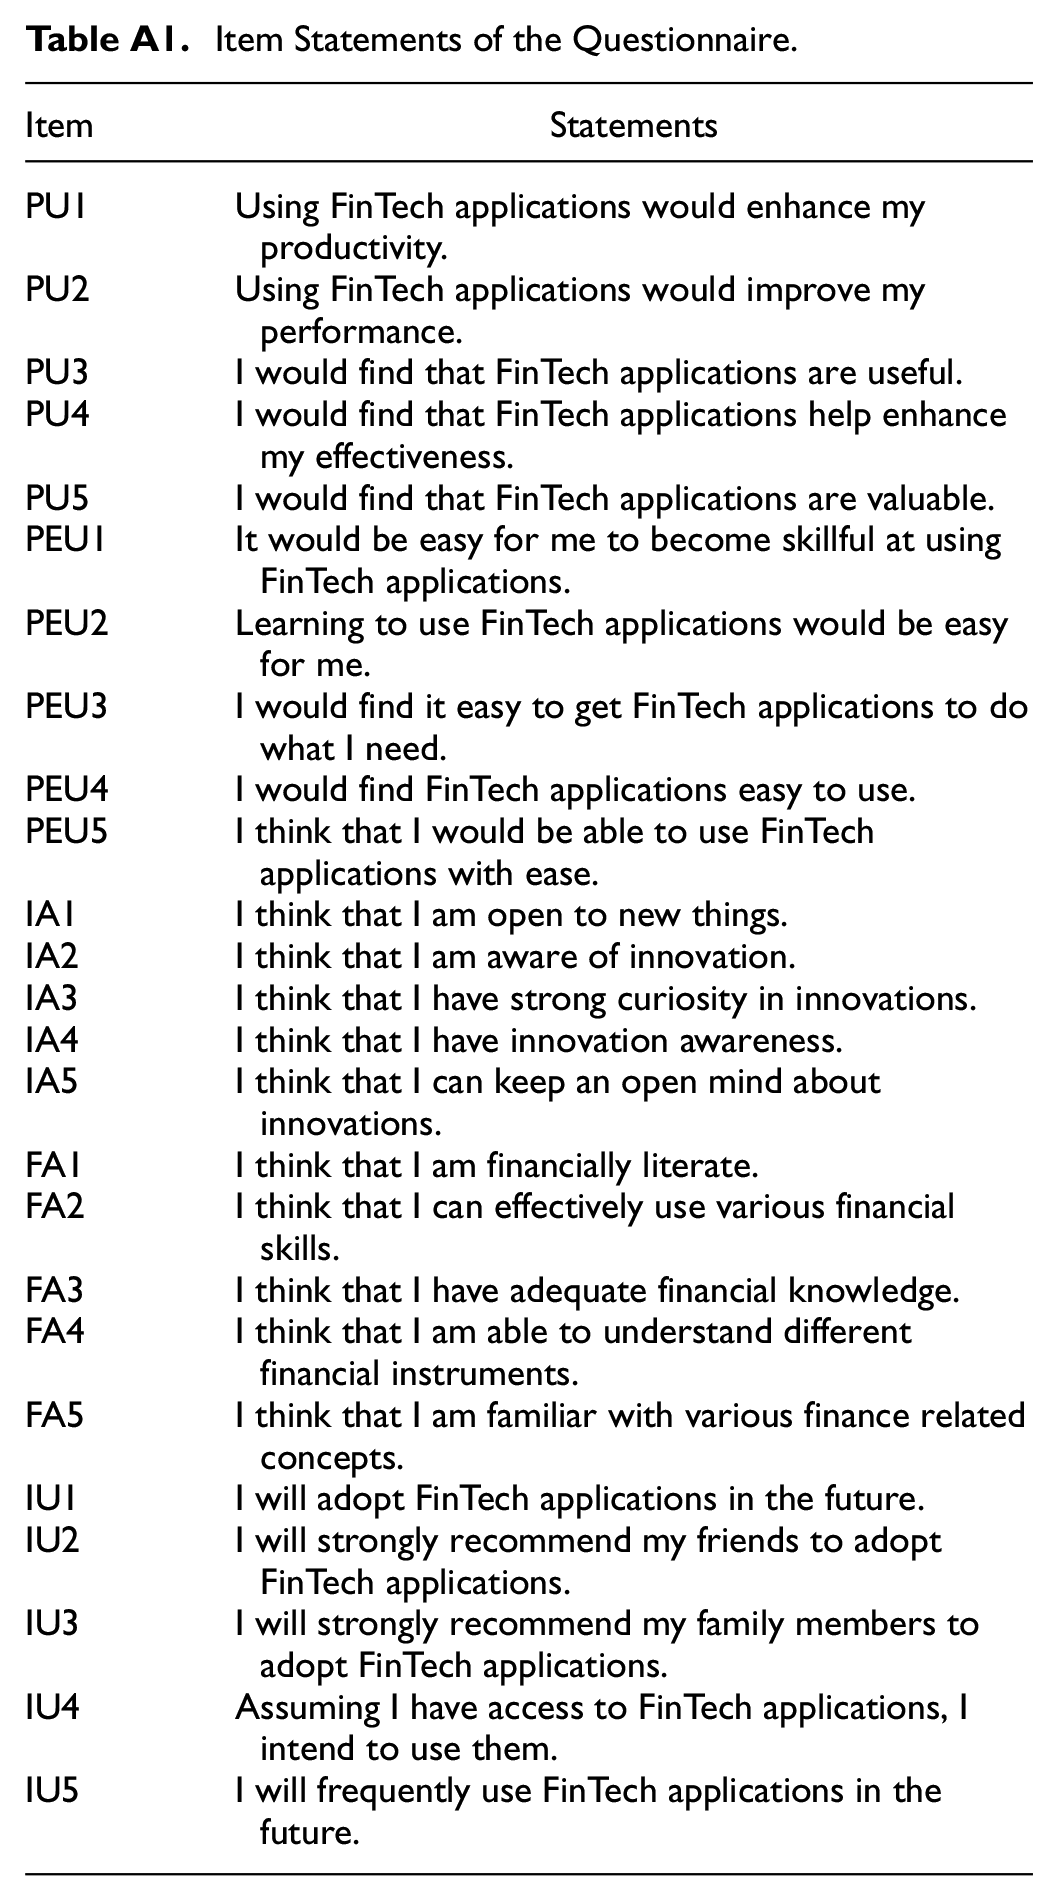
| Item | Statements |
|---|---|
| PU1 | Using FinTech applications would enhance my productivity. |
| PU2 | Using FinTech applications would improve my performance. |
| PU3 | I would find that FinTech applications are useful. |
| PU4 | I would find that FinTech applications help enhance my effectiveness. |
| PU5 | I would find that FinTech applications are valuable. |
| PEU1 | It would be easy for me to become skillful at using FinTech applications. |
| PEU2 | Learning to use FinTech applications would be easy for me. |
| PEU3 | I would find it easy to get FinTech applications to do what I need. |
| PEU4 | I would find FinTech applications easy to use. |
| PEU5 | I think that I would be able to use FinTech applications with ease. |
| IA1 | I think that I am open to new things. |
| IA2 | I think that I am aware of innovation. |
| IA3 | I think that I have strong curiosity in innovations. |
| IA4 | I think that I have innovation awareness. |
| IA5 | I think that I can keep an open mind about innovations. |
| FA1 | I think that I am financially literate. |
| FA2 | I think that I can effectively use various financial skills. |
| FA3 | I think that I have adequate financial knowledge. |
| FA4 | I think that I am able to understand different financial instruments. |
| FA5 | I think that I am familiar with various finance related concepts. |
| IU1 | I will adopt FinTech applications in the future. |
| IU2 | I will strongly recommend my friends to adopt FinTech applications. |
| IU3 | I will strongly recommend my family members to adopt FinTech applications. |
| IU4 | Assuming I have access to FinTech applications, I intend to use them. |
| IU5 | I will frequently use FinTech applications in the future. |
Acknowledgements
The authors would like to thank the support of FinTech Research Center, Sanda University.
Declaration of Conflicting Interests
The author(s) declared no potential conflicts of interest with respect to the research, authorship, and/or publication of this article.
Funding
The author(s) disclosed receipt of the following financial support for the research, authorship, and/or publication of this article: The research work is supported by the Sanda University Research Fund (Nos. 2021ZD03 and 2022YB18).
Ethics Statement
The study was approved by the ethics committee of Sanda University (approval number: 2022020) and Informed consent was obtained from all subjects involved in the study. The participants were informed about the purpose of the study. All procedures performed in the study involving human participants were in accordance with Declaration of Helsinki and relevant regulatory guidelines.
Data Availability Statement
Data will be made available upon request.