
Abstract
Using regression and wavelet coherence techniques this paper tries to probe the validity of purchasing power parity (PPP) in Pakistan. For this purpose, monthly data is collected for nominal exchange rate and consumer prices of Pakistan and its 23 major trading partners for the flexible exchange rate period 1982M1 to 2020M12. The regression results show that in 12 countries inflation differential significantly positively affect exchange rate. Similarly, Granger causality results reveal that inflation differential causes exchange rates in 12 countries. Wavelet coherency results indicate that there is significant co-movements between inflation differentials and exchange rates in varying time and frequency domains in all countries. These results indicate the partial validity of PPP in Pakistan. These results suggest that by reducing its inflation Pakistan can stabilize its exchange rates.
Plain Language Summary
Several factors affect the exchange rates including domestic and foreign inflation rates. This study examines the effect of inflation differentials on exchange rates in Pakistan using purchasing power parity (PPP). For this purpose, monthly data of exchange rates of Pakistan against its 23 major trading partners is used for the period 1982M1 to 2020M12. The results depict that co-movements exist between inflation differentials and exchange rates in varying time and frequency domains. This finding shows that PPP partially holds in Pakistan. These results suggest that Pakistan can stabilize its exchange rate by reducing its inflation.
Keywords
Introduction
In literature, several theories of exchange rate determination have been proposed like balance of payments approach, monetary approach, purchasing power parity (PPP) approach, portfolio balance approach, and so on. Among these theories, PPP is the oldest exchange rate theory. It is also called inflation theory of exchange rate determination because in this theory changes in price levels determine exchange rate. PPP is built on theory of law of one price (LOP), which postulates that in the absence of transportation costs and trade barriers, identical products will have the same prices in segmented markets when prices are shown in similar currencies. It stipulates that (nominal) exchange rate is expressed as the ratio of price levels of two countries.
Empirical literature generally rejected PPP in 1970s and 1980s. Sarno and Taylor (2002) and A. M. Taylor and Taylor (2004) have documented literature review of earlier studies. Several justifications have been provided for the empirical rejection of PPP. First, in 1970s and 80s, studies mainly used short time series data to check the validity of PPP, which provided results against PPP. It was argued that PPP is a long run concept, which cannot be validated using short span of data. Second, studies mainly used US Dollar for analysis, while appreciation/depreciation of dollar during the 1980s has rejected PPP (Papell, 2002). Third, PPP assumptions do not hold in real world. PPP is based on the assumptions that there is no transportation cost and that both goods and capital markets are perfect. But actually, there are transaction costs, restrictions on capital flows, barriers to trade, differences in formulation of price indices, and so on. Therefore, PPP does not hold. Fourth, PPP holds in high inflation countries only. Fifth, previously, there was lack of formal econometric methods to test the validity of PPP. Therefore, informal models provided results against PPP. However, in recent years, development of new econometric techniques like unit root tests, co-integration, and so on have given new insights into the analysis of PPP theory. However, studies using these techniques have provided mixed results and suggest that PPP holds in long run only (Alexius, 1996).
These mixed results are due to different econometric techniques used (e.g. correlation analysis, unit roots, cointegration, fractional integration & co-integration, etc.), country of analysis (developed vs. developing), data horizons, data frequency (monthly/quarterly/annually), data type (time series/panel), linear versus non-linear models, and so on. Previous studies have mainly used two approaches to test PPP validity. First approach is to test whether RER contains a unit root. However, this approach is not compatible with PPP. Because the presence of unit root in RER would imply that shocks to RER have permanent effects and if RER deviates from its equilibrium level, it will not return back. Second approach is to test whether (nominal) exchange rate and prices have cointegration. However, the presence of cointegration between two variables may not mean that PPP is valid because for the validity of PPP real exchange rate should have stationarity (Gartner & Glück, 2014). Despite mixed results from different econometric techniques, PPP is still an important exchange rate determination theory.
Previous studies have mainly used time domain of the data and have ignored the frequency domain of data to test the validity of PPP. The present study tests PPP theory by taking into account both time and frequency domains of the data. This is done by using wavelet technique. The main advantage of wavelet technique is that it conducts analysis at different horizons using time as well as frequency components, which explain varying characteristics of movements between variables in a unified framework (Rua, 2010). Further, this technique can handle non-linearities and non-stationarities. Wavelet techniques also provide short and long run association between variables. This study describes the dependencies between exchange rates and inflation differentials in Pakistan in both time and frequency domain. Thus, the first hypothesis of the study is whether PPP is still valid in Pakistan using wavelet technique. Second hypothesis is whether wavelet results are same or different from the regression results. The problem statement is to find wavelet results for PPP in Pakistan and to compare it with regression results in order to test the validity of PPP in Pakistan.
Since previous studies have used time domain of the data and have shown that PPP is not valid theory of exchange rate determination in Pakistan. Now the research question is “Is PPP valid theory of exchange rate determination in Pakistan if both time and frequency domains are taken into analysis.” To answer this question is important for policymakers in Pakistan for several reasons. First, inflation is an important determinant of exchange rate volatility in Pakistan. Second, Pakistan is experiencing large differences in domestic and foreign inflation rates. Third, prices help to predict exchange rate and to check the under/overvaluation of exchange rate. In other words, it helps to examine degree of misalignment of nominal exchange rate.
The remainder of the study is structured as follows. Section 2 provides literature review. Section 3 elaborates materials and methods. Section 4 elucidates results and their discussions. Last section concludes the paper and provides some policy recommendations.
Literature Review
There is plethora of empirical literature on PPP hypothesis since 1970s (Froot & Rogoff, 1995). In 1970s, studies provided support in favor of short-term PPP, while, in 1980s, studies concluded that PPP is not valid in short run due to sticky prices, low power techniques, short-span data, and so on (A. M. Taylor & Taylor, 2004). Some argues that PPP is valid for economies with high inflation (Frenkel, 1978) and does not hold in economies with low and moderate inflation (Frenkel, 1981). Recently, Papell and Prodan (2020) have also shown strong evidence of long-run PPP for high inflation countries. In 1990s, use of long-span data, high frequency data, panel data analysis and higher power techniques have concluded that PPP is valid in long run (Cuddington & Liang, 2000; A. M. Taylor, 2002). However, some studies have also documented that PPP does not hold in long-run (Mark, 1990; M. P. Taylor, 1988) as long-span data has created the issue of regime shifts, nonlinearity in data, structural breaks, and so on as it may generate spurious results (Frankel & Rose, 1996; Hegwood & Papell, 1998). Moreover, testing the validity of PPP using panel data may entail heterogeneity problem as overlooking country specific differences may create inaccurate inferences about PPP validity (M. P. Taylor, 2003; M. P. Taylor & Sarno, 1998).
Use of threshold autoregressive (TAR) and exponential smooth transition autoregressive (STAR) techniques have provided support in favor of nonlinearity and against linearity in PPP hypothesis (Michael et al., 1997; M. P. Taylor et al., 2001). Application of nonlinear unit root tests have also provided support in favor of PPP compared to traditional unit root tests (Kılıç, 2011; Kruse, 2011; Yildirim, 2017). Further, it is also argued that PPP holds in fixed exchange rate regime instead of flexible exchange rate system.
Recent studies have also provided inconclusive findings about PPP validity. He et al. (2013) have shown that long run PPP holds in transition economies. Similarly, according to Nathaniel (2019) PPP holds in ECOWAS economies. In turn, Blanco and Hancco (2020) have shown that PPP is not valid in any functional form in Peru. Similarly, Jabbie and Jackson (2020) have shown that PPP does not hold for Sierra Leone. Xie et al. (2021) have postulated that PPP hypothesis is valid in the presence of some other variables like GDP, government debt, and so on.
The standard econometric techniques (like regression techniques) are not valid as these techniques do not take into account the nonstationarity of exchange rate and inflation. To address the non-stationarity issue, unit root and cointegration techniques were employed to real exchange rate data. If real exchange rate has unit root (non-stationary) then PPP does not hold and vice versa. Unit roots and cointegration tests mainly provided evidence against PPP (Edison & Pauls, 1993; M. P. Taylor, 1988) and only limited studies supported the PPP (Chowdhuri & Sdogati, 1993). Overall, different econometric techniques have documented inconclusive finding regarding PPP validity.
Previous studies have used mainly regression methods (like least square methods) and time series techniques (like unit root tests, cointegration tests, etc.) to analyze PPP theory. Establishment of new econometric techniques has led the rebirth of PPP analysis. One such econometric technique is wavelet method. Until now only few studies have used wavelet technique to find the co-movements between exchange rate and inflation rates. To investigate the impact of inflation rates on exchange rate Bahmani-Oskooee et al. (2016) have used monthly data for G6 and BRICS countries for the period 1970 to 2015 (for G6 countries) and 1993 to 2015 (for BRICS countries). The study has used the wavelet methodology for the empirical analysis. The estimated results have shown that inflation rates cause exchange rates in most of the countries in short run. Applying monthly panel data for the period 1970 to 2011, Almasri et al. (2017) have investigated the validity of PPP in central American countries by using wavelet panel unit root test. The study has shown strong support for PPP in this developing region. Uliha and Vincze (2018) using cross-wavelet transform examine the nexus between inflation differentials and exchange rate at different time scales. For empirical analysis monthly data is taken for the period 1991 to 2017 for a group of countries, in which Germany is taken as base country. The study does not reveal strong association among prices and exchange rates in short or medium terms. More recently, Vo and Vo (2020) using wavelet decomposition investigate PPP validity. For empirical analysis monthly data is used from 1999 to 2019 for seven currencies. The currencies included are CAD, CHF, CNY, EUR, GBP, JPY, and USD. The results have shown that PPP holds.
In Pakistan some studies have been conducted on PPP theory (Bhatti, 1996; Khan & Qayyum, 2007; She et al., 2021) but these studies have used traditional econometric techniques like unit root tests, cointegration, and so on to test the validity of PPP theory in Pakistan. These traditional econometric techniques take into account only time domain of data and ignore frequency domain of data. Until now, no study has been conducted in Pakistan to test PPP hypothesis in both time and frequency domains using wavelet technique. Present study tries to bridge this gap in the literature.
Methods and Materials
Theoretical Model
Purchasing Power Parity (PPP) is built on the concept of law of one price (LOP), which says that when there is no tariffs and transportation costs, identical products will observe same prices in different countries when the prices are measured in the same currencies. Mathematically,

where
LOP is applied to individual goods prices, while the PPP is applied to the general price level. If we use general price level then equation (1) will become:

Now the absolute PPP implies

The absolute PPP hypothesis stipulates that the nominal exchange rate is equal to ratio of the domestic and foreign price levels. The above equation in natural logarithm form can be written as follows:

where

Where
Econometric Technique
If co-movements between variables are examined in time domain perspective of data, it will consider the recorded frequency only. It may create problems when this assumption becomes insufficient, specifically, when there are more than one frequencies in the given variable. To deal this problem wavelet technique has been developed as it considers both time as well as frequency components of data (Aguiar-Conraria & Soares, 2011). Wavelet technique can deal non-linearity, non-stationarity of data and can separate relationships at different horizons. To investigate the association between exchange rates and prices, wavelet coherence is applied.
Continuous wavelet transformation (
Where

Where

where
Wavelet coherency detects areas in time-frequency space where two time series co-move. It measures correlation among two series in the time–frequency space and is expressed as (Grinsted et al., 2004; Torrence & Webster, 1999)

The range of wavelet coherence coefficient is
The lead-lag association among two series can be measured by using phase difference. It displays the delay among the oscillations (cycles) of two time-series (Aguiar-Conraria & Soares, 2011; Torrence & Webster, 1999). It is expressed as:

Results and Discussions
The Data
To analyze the validity of PPP and to investigate the impact of relative inflation on exchange rates, monthly data for exchange rates and prices is considered for Pakistan and its 23 major trading countries for the period 1982M1-2020M12. Data for the Euro region (Belgium, France, Germany, Italy, the Netherlands and Spain) is taken for the period 1999M1-2020M12 due to nonavailability of data for Euro before 1999. The data is extracted from the website of IMF’s International Financial Statistics.
Trading countries are taken on the basis of Pakistan’s trade (both export and import) with these countries. These countries are Bangladesh, Belgium, China, France, Germany, India, Indonesia, Italy, Japan, Kuwait, Malaysia, Netherlands, Qatar, Saudi Arabia, Singapore, South Africa, Spain, Switzerland, Thailand, Turkey, United Arab Emirates, United Kingdom, and USA. Exchange rate is taken in direct quotation in which a high numerical value of exchange rate implies depreciation of local currency. In other words, exchange rate is taken as domestic currency per unit of foreign currency. Inflation rate is measured by consumer price index (CPI). Before analysis both exchange rates and CPI are converted into logarithm.
Table 1 provides the descriptive statistics of exchange rate and CPI. It is evident from the table that Pak-rupee exchange rate against Turkish lira has the highest mean value (7448.37) followed by Kuwaiti dinar (200.73) and Euro (103.51) exchange rates. Pak-rupee exchange rate has lowest mean value against Indonesian rupiah (0.01) followed by Japanese yen (0.55) and Bangladeshi taka (0.97) exchange rates. Exchange rate of Pak-rupee against Turkish lira has the highest standard deviation value (16306.16), while Indonesian rupiah has the lowest value of standard deviation (0.00). The Netherlands has highest mean value of inflation (99.72), which ranges between 78.88 and 118.67. Indonesia has the lowest inflation mean value (61.38) and it ranges between 6.69 and 154.61. CPI of Pakistan has the highest standard deviation value (55.06), while CPI of Japan has the lowest standard deviation value (6.04). Statistically significant values of Jarque-Bera Statistics indicate that normality does not hold in all exchange rate and inflation rate series. Last column of the table shows correlation coefficients between exchange rates and relative prices (inflation differentials). All correlation coefficient values are positive and are statistically significant, which implies that exchange rates and relative inflation rates are highly positively correlated with each other. It provides support in favor of PPP.
Descriptive Statistics and Correlation.
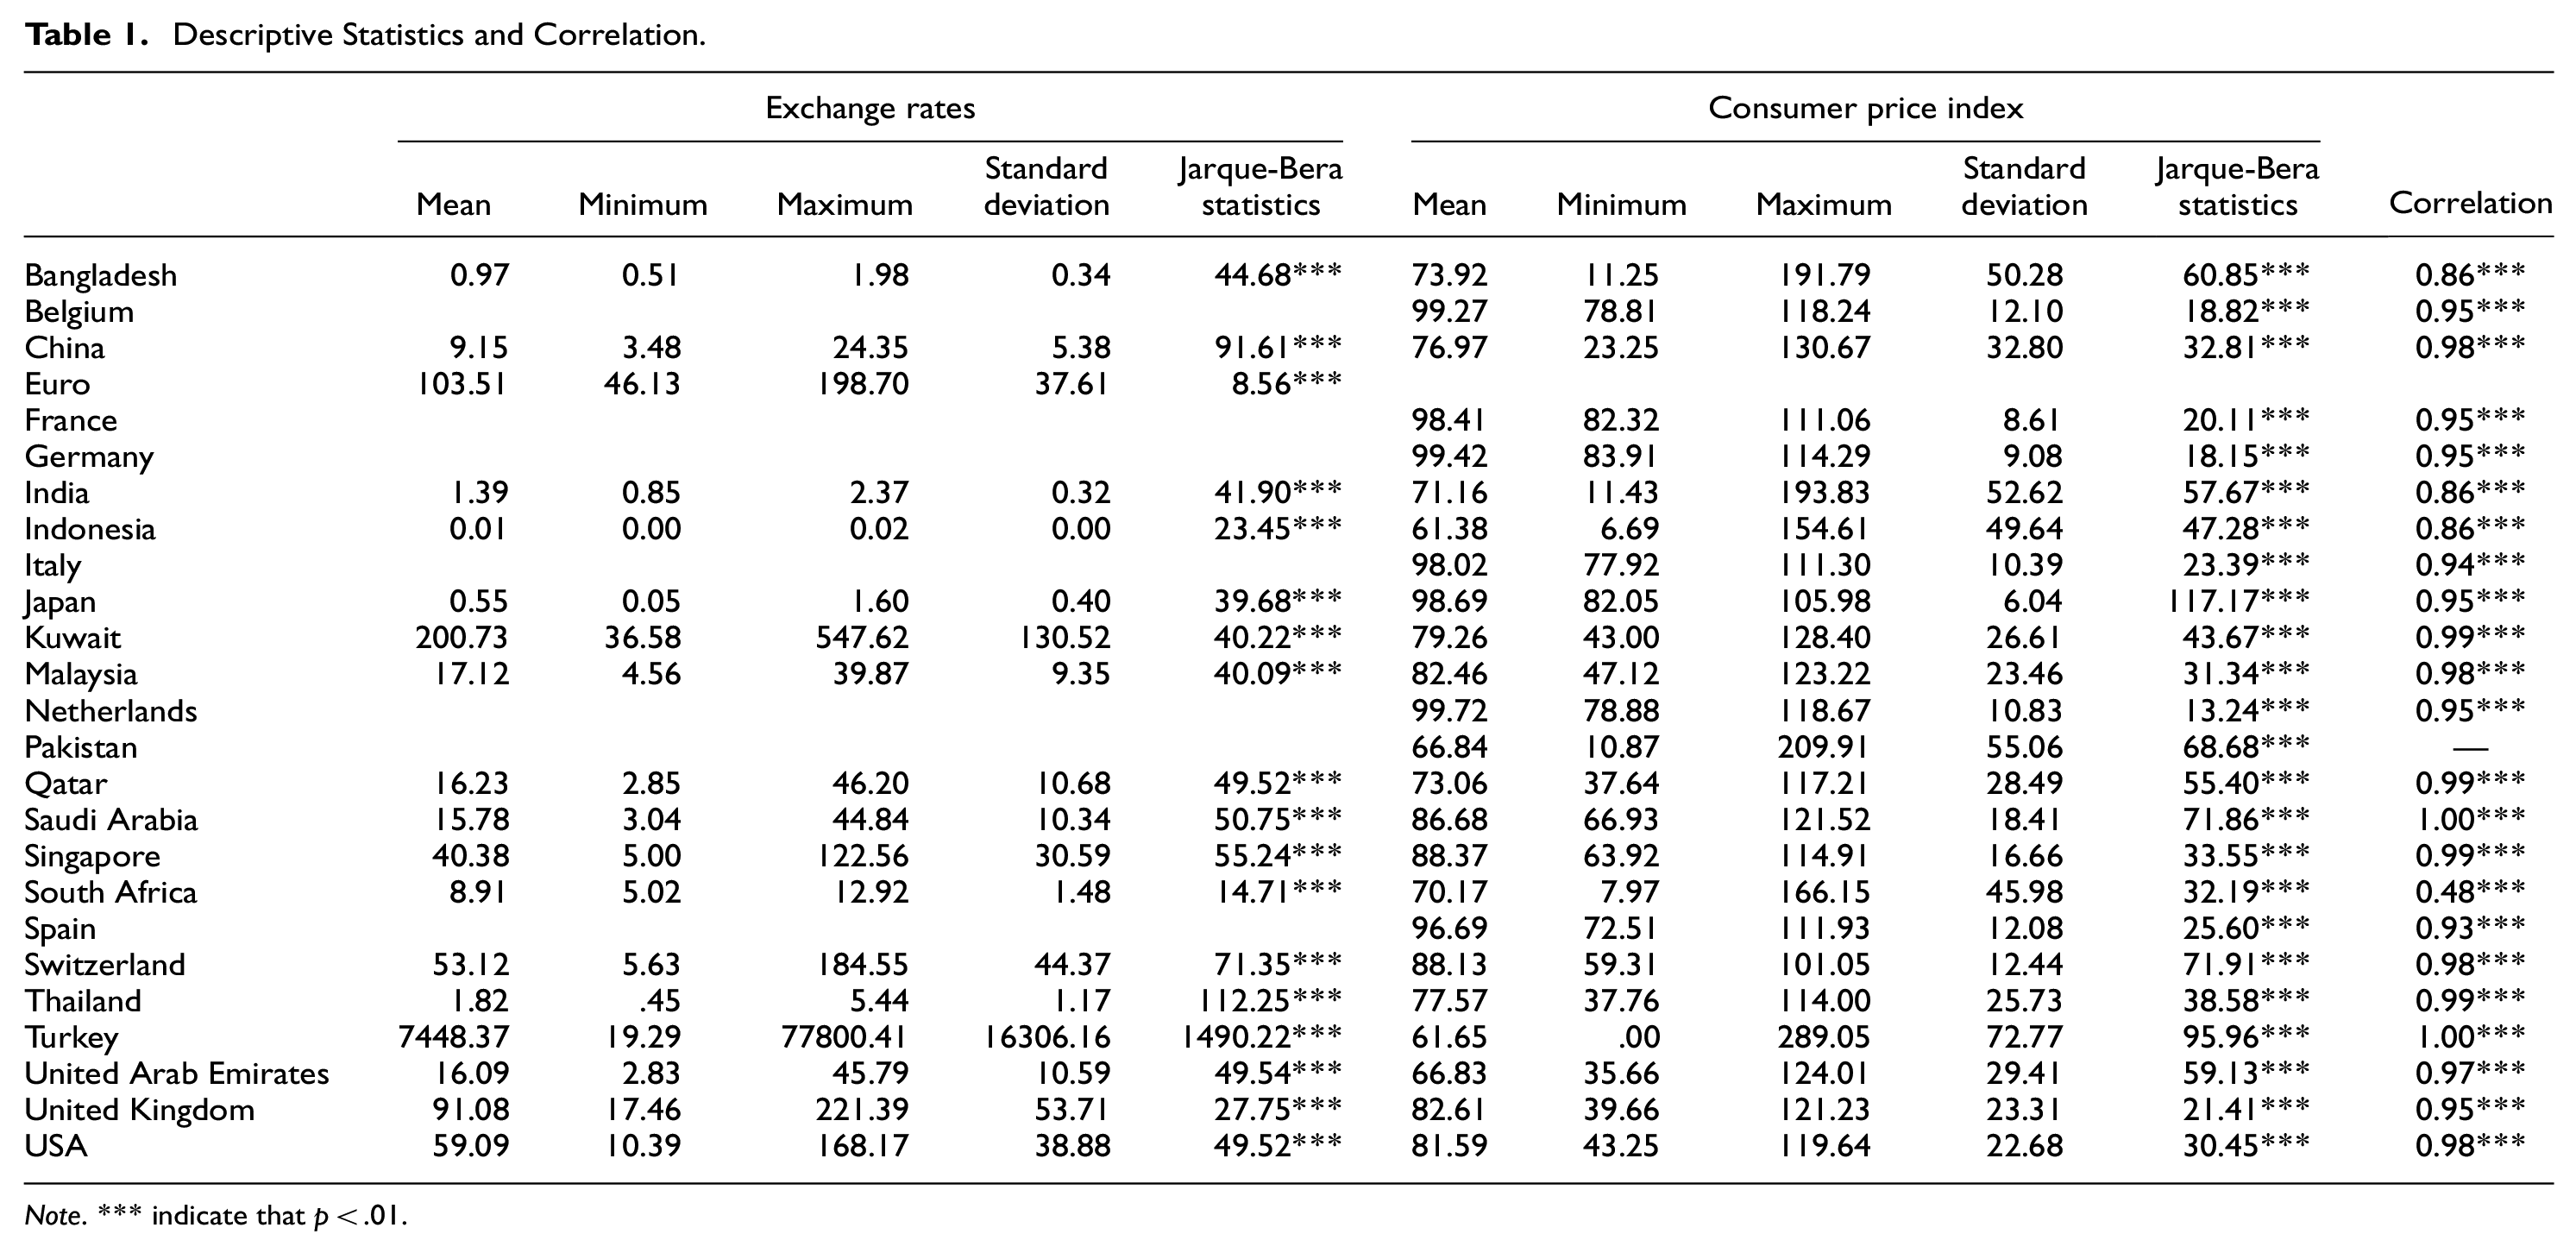
Note. *** indicate that p < .01.
Regression Results
Before performing wavelet coherency analysis, which explains co-movement of two time series in the time-frequency domain, we first provide estimates using regression analysis, which performs analysis in time domain only. Table 2 provides the estimated results of equation (5). Column (1) displays estimated results of constant term
Regression Results (1982M1–2020M12).

Note. Values in parentheses (brackets) are t-values (p-values).
, **, and * indicate that
To examine the causality in a time domain, we have applied traditional Granger causality test and the results are provided in the last column of the table. These results indicate that in 12 countries inflation differential Granger causes exchange rates. It again implies that PPP theory is partially valid in Pakistan. Results obtained from regression model may not be accurate as regression model conduct analysis by considering only time domain perspective of the data. It also presumes that data is linear but data may be nonlinear due to structural breaks. Results may differ if nonlinearity of the data is taken into analysis. Results may differ if both time and frequency perspectives of data are considered. This is the main objective of the next sub-section which provides results from wavelet coherence analysis.
Wavelet Results
The wavelet coherency provides co-movements among variables in a time-frequency space in a given region. Figure 1 provides the wavelet coherency plots of exchange rates and inflation differentials. Value close to 0 (1) indicates weak (strong) correlation between both variables. Deep red (blue) color shows high degree of dependence between exchange rate and inflation differentials. In these plots, areas with dark borders show that the coherence is significant at the 5% level. The light border defines the area known as cone of influence (CoI). Estimates outside of this area are dubious. The direction of the arrows indicates phase differences. Arrows pointed to the right (left) indicate that both series, that is, exchange rates and inflation differentials are in-phase (anti-phase) and are positively (negatively) associated. Further, arrows pointed up (down) indicates that inflation differentials (exchange rate) lead exchange rates (inflation differentials).

Wavelet coherency plots.
A bird’s eye view of coherence plots shows that in almost all plots arrows are pointed up and to the right which implies that both series, that is, exchange rates and inflation differential are in phase and are positively correlated, with inflation differential leading the exchange rates. Inflation differential strongly influences exchange rates over many periods and at many frequencies. The influence of inflation differential on exchange rates is strong in Indonesia and Turkey, while in other countries this impact is moderate. The synchronization of exchange rate and inflation differentials holds in both low, medium, and high frequencies at different time scales. However, this coherence is not stable. The only exception is Bangladesh where arrows point to right but down which implies that exchange rate and inflation differential are in phase and are positively correlated but exchange rate leads the inflation differential. These results reveal that fluctuations in exchange rates are explained by inflation differentials. It supports PPP theory in Pakistan where inflation determines the exchange rates of Pak-rupee with its trading countries. These results support the findings of Vo and Vo (2020), which also support the validity of PPP in number of currencies using wavelet technique. It also corroborates the findings of Almasri et al. (2017) which has provided strong support for PPP in central American countries by using wavelet panel unit root test.
Conclusion
The paper probes the interaction between exchange rates and inflation differentials of Pakistan against the currencies of its 23 major trading countries in time-frequency framework using wavelet coherence analysis, which is the main novelty of this study as it takes into account non-stationarity, nonlinearity and multiple structural breaks. The estimates of regression model reveal that in 12 countries inflation differential significantly positively influence exchange rates. Likewise, Granger causality results highlight that inflation differential causes exchange rates in 12 countries. Wavelet coherency results indicate that movement between exchange rates and inflation differential is in-phase in almost all countries, which implies that inflation differential significantly positively influences exchange rates in varying time and frequency domains in all countries. These results validate PPP theory in Pakistan.
Wavelet coherence results reveal that inflation differential causes exchange rates of Pak-rupee against its major trading partners’ currencies. These findings have some important policy implications. First, the strong evidence in favor of PPP suggest that it can be used to determine and forecast the exchange rates in Pakistan. Second, PPP requires flexible exchange rate system in which market forces determines exchange rates. Therefore, government should not interfere in exchange rate market in Pakistan. Third, the results suggest that by adopting the deflation policy Pakistan can stabilize its exchange rates with its trading partners. It will help to increase foreign investment which it needs for sustained economic growth. Finally, investors while investing in foreign exchange market should consider the inflation movements of the concerned country. It will help to decrease the risk of inflation fluctuations on exchange rates. An important limitation of the study is that it has used data for the flexible exchange rate regime period from 1982 onwards. However, more work can also be done by incorporating the data for the fixed exchange rate regime period from 1971 onwards. This is left for future research.
Footnotes
Declaration of Conflicting Interests
The author(s) declared no potential conflicts of interest with respect to the research, authorship, and/or publication of this article.
Funding
The author(s) received no financial support for the research, authorship, and/or publication of this article.
Data Availability Statement
The data is available at the website of IMF’s International Financial Statistics.