
Abstract
Sci-Tech Popularization (STP) and Sci-Tech Innovation (STI) are two significant components to realize China’s innovation development. STI provides direction and content for STP, while STP creates an intense atmosphere for STI. By establishing two evaluation index systems of STP and STI, the STP index and the STI index of China and Chinese 31 provinces from 2010 to 2019 was calculated, and the STP index and the STI index from 2020 to 2024 were predicted. Finally, the relative development degree (RDD), the coupling coordination degree (CCD) and the dynamic degree of STP and STI were figured out. The results showed that: (1) From 2010 to 2024, the STP index and the STI index of China and Chinese 31 provinces showed a growing trend. The growth rate of STI was higher than that of STP, but the STP and the STI were low. (2) The RDD results showed that the development of STP lagged behind that of STI after 2018, and the gap between them showed a growing trend. (3) The CCD of STP and STI in China spanned three grades: moderate imbalance, slight imbalance, and approaching imbalance. The CCD in Chinese each province spanned five grades: severe imbalance, moderate imbalance, slight imbalance, approaching imbalance, reluctant coordination. The CCD was developing in a good direction, China and most Chinese provinces were still in an unbalanced level instead. Finally, suggestions on infrastructure, technical means, personnel, and social responsibility were put forward to promote the coordinated development between STP and STI in China.
Plain Language Summary
The science and technology of countries and regions is not only shown by the high level of Science and Technology Innovation (STI), but also by the strong ability of Science and Technology Popularization (STP). STI and STP are two aspects of scientific and technological work, which should be integrated and coordinated. This study refers to the concept of physics coupling theory to explore the principle and coupling mechanism of STP and STI. The coupling degree of STP and STI is studied in each province, and the regional status quo and characteristics of the coupling are analyzed between STP and STI in China. Based on that, the study explores the development path STP and STI in China, and provides reference for correctly understanding the development status of STP and STI, as well as formulating and implementing relevant policies to promote the development of STP.
Keywords
Introduction
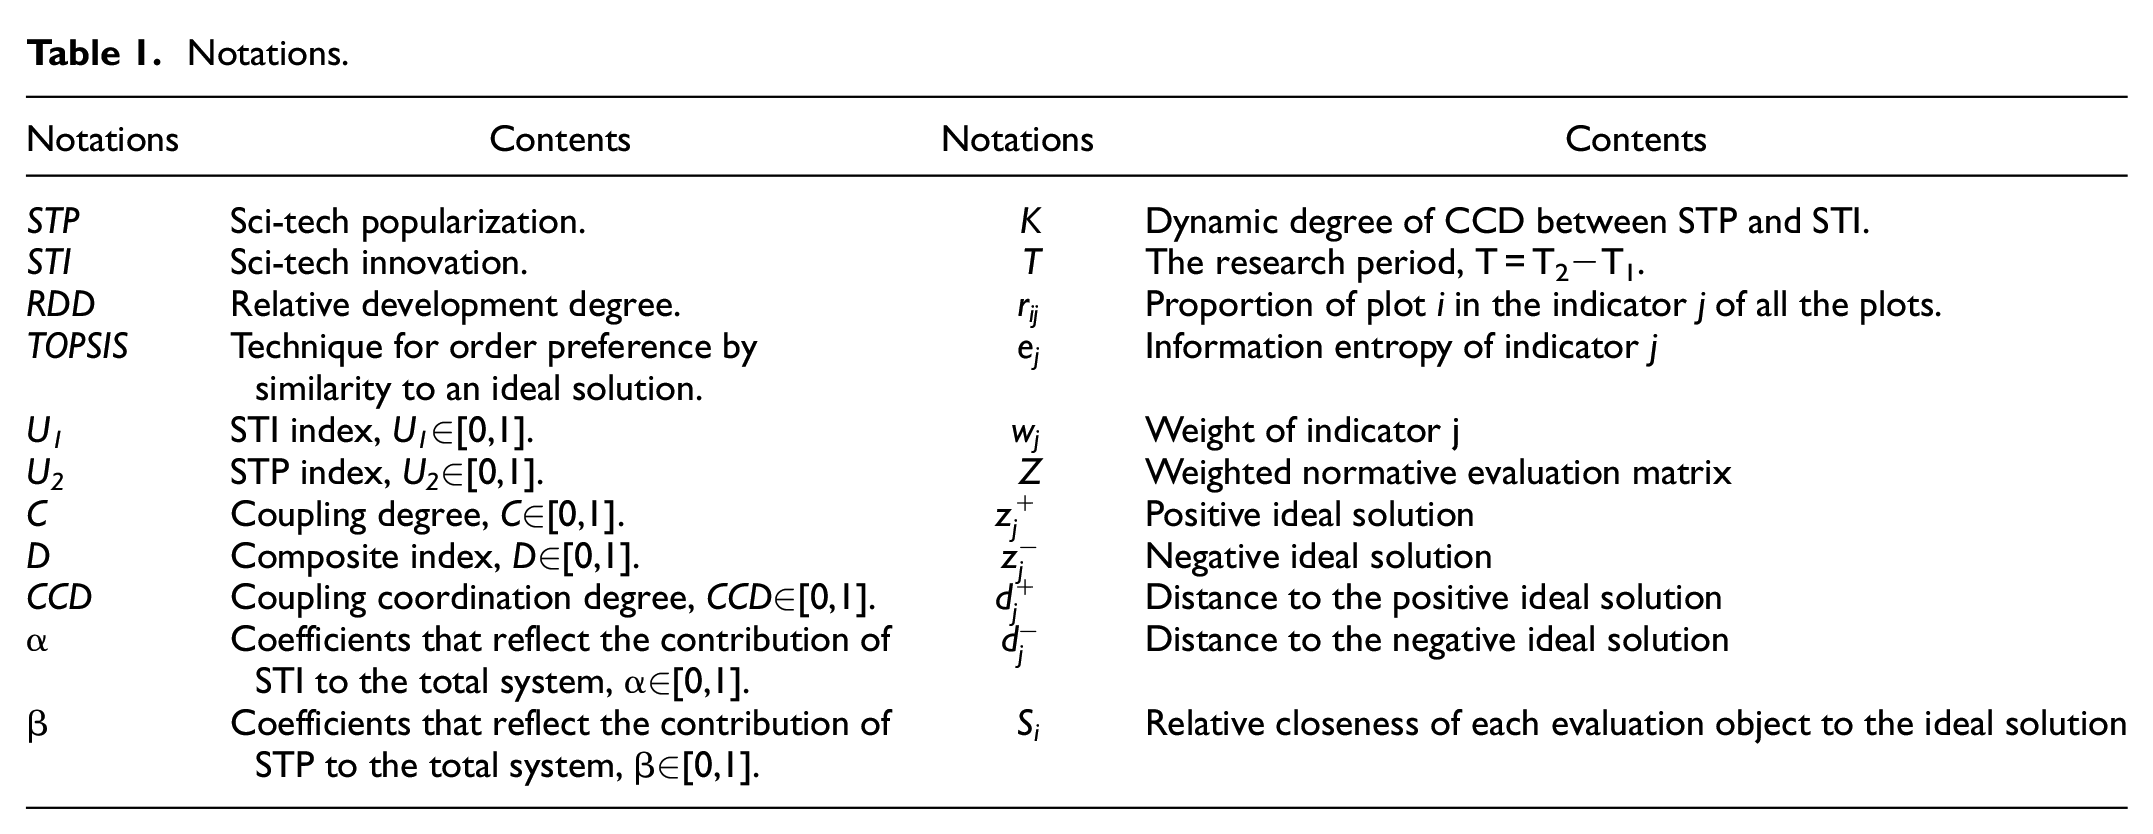
As a new round of scientific and technological revolution and industrial transformation is developing rapidly, the global game of science and technology is intensifying, a large number of science and technology topics have become hot spots, the high-level development of Sci-Tech Innovation (STI) and Sci-Tech Popularization (STP) is of great significance for national innovation and development. In 2016, Chinese President Xi Jinping presented that STI and STP are the two wings to realize innovation and development, and the STP should be placed in the same important position as STI at the National Conference on Innovation in Science and Technology. Because STP and STI are unified dialectically. First of all, STI leads the development of STP, STI achievements have sprung up, which are all the important contents of STP. There are more and more STP works based on major achievements, which means the leading role of STI in the STP is becoming more and more obvious. Furthermore, the STP can improve the scientific quality of the whole people to develop high-quality talents, which can provide personnel security for STI. STP can also promote the public to understand science, figure out the achievements and significance of STI, and pave the way for the public to understand and support STI. Finally, the STP can build a bridge between STI and achievements transferring, so that more people can understand the latest STI information, use the scientific and technological products better, and promote the effective transformation of scientific and technological achievements. The notations used in this manuscript and their meanings are listed in Table 1.
Notations.
Literature Review
At present, scholars at home and abroad have a lot of research on STI and STP. They tried to construct the index system from different perspectives, and used the entropy weight method (Lifeng et al., 2021), Technique for Order Preference by Similarity to an Ideal Solution (TOPSIS) model (Lianju et al., 2021), analytic hierarchy process (Xingyu et al., 2020), and factor analysis (Yue et al., 2019) to comprehensively evaluate them. The Table 2 below provides information on literature review. It had a comprehensive research on STI, involving many aspects of the economy and society such as higher education (Guangli et al., 2023), foreign investment (Hao et al., 2022), and urban construction (Xin et al., 2022). The researches on STP were mainly based on theoretical analysis (Meifang & Xinyu, 2022), and the main contents were the basic meaning of STP, the definition of related concepts (Zeyuan, 2022), and the development status and future development trend of STP (Shi, 2018). The rare empirical analysis mainly described the current situation and development trend of STP resources and STP work, or studied the ability of STP work in various regions (Yue et al., 2019) based on the existing statistical data other aspects of economy and society (Lihong et al., 2016). However, the academic community had conducted exploratory research on the relationship between STP and STI, including the popularization of scientific and technological resources (Wenjing & Xuejun, 2021; Xian & Wenwen, 2022), improving the STP function of science and technology venues (Wang, 2022), and enhancing the awareness of innovation subjects for STP (Cuixia et al., 2022). The content was mainly theoretical research (Mingwei, 2022), and most of them were principled statements (Danilina, 2022; Jinbo & Caixia, 2020).
Summary of Literature Review Table.

There were few studies on the coupling relationship between STI and STP according to coupling. There were many research achievements on coupling coordination degree at home and abroad, involving many aspects such as economy, environment, population, and so on (Huang et al., 2020; Sun & Zhang, 2021; Yang et al., 2021). According to the coupling theory (Zhang et al., 2023), the coupling of STI and STP is the interaction and influence between the two subsystems, aiming to maximize their utility, alleviating the development imbalance between the STI system and the STP system, to realize their organic combination and mutual development. In the coupling process of STI and STP, STI leads the development of STP, STP promotes the transformation of scientific and technological achievements, and promotes the public understanding of science as a whole. On the other hand, the internal elements of the system will also interact with each other. For example, the publicity of STI achievements is the responsibility and obligation of researchers, the research funding can be used to carry out STP activities, and the scientific research facilities are open to the public. Therefore, it is feasible to analyze the relationship between STI and STP from the perspective of coupling.
Combined with relevant research results at home and abroad, the paper researches from the following aspects (Figure 1): Firstly, a relatively complete index system was constructed from the aspects of personnel, facilities, funds, scientific and technological achievements, and STP activities, which made up for the shortcomings of incomplete data collection, incomplete evaluation indicators, and single evaluation methods in previous studies, and the paper enriched the evaluation index system of STI and STP. Secondly, based on the panel data, the paper used entropy weight method and TOPSIS model to evaluate the development level of STI and STP from a dynamic perspective, which made up for the shortcomings that the cross-sectional data study could not reflect the long-term trend of the research objects. Thirdly, the GM (1,1) Method and coupling coordination degree (CCD) model were used to predict its future development trend, calculate the CCD of STI and STP, and broad the research on the relationship between STI and STP. Fourthly, the relative development method and dynamic degree method were used to analyze the dynamic development trend of STI, STP and their CCD. By exploring the relationship and coupling mechanism between STI and STP, the paper studied the coupling degree of STI and STP in each province, analyzed the regional status and characteristics of the coupling between STI and STP in China, and explored the development path of STI and STP. The research would provide effective empirical supports for correctly understanding the development status of STI and STP in China, formulating relevant policies to promote the development of STP, constructing the coordinated development framework of STI and STP.

Analysis framework.
Data and Methods
Data Source
Objectivity, regularity, availability, reliability, and completeness need to be abided by while collecting and using data. The STP data include personnel, venue, fund, activity and medium, and the STI data are the data which are frequently used in relevant researches, including subject, fund, and output. Based on the relevant data from 2010 to 2019, the CCD between STP and STI was evaluated in China and Chinese 31 provinces (excluding Taiwan, Hong Kong, and Macao). All the data were collected from China Statistics on Science and Technology Popularization, China Statistical Yearbook on Science and Technology, and China Statistical Yearbook on High technology Industry.
Index System
To accurately evaluate the CCD between STP and STI and reflect the interaction among the indexes of each system, the evaluation index system in Table 3 was constructed by combining the characteristics of STP and STI and referring to the literature on STP (Lihong et al., 2016) and STI (Hongwen et al., 2021; Man & Tao, 2021).
Index Evaluation System of STP and STI in China.

Note. STP = sci-tech popularization; STI = sci-tech innovation; R&D = research and development.
Data Processing
First, the normalization method is adopted to process the initial data. The specific steps are as follows:

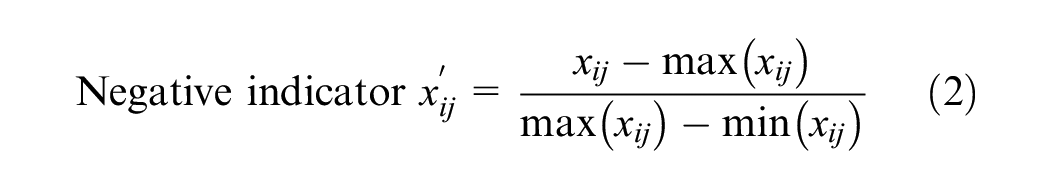
Where
Second, carry out normalized translation and normalization processing on the data, where B = 0.1, A = 0.9.

Entropy Weight Method
The entropy weight method is an objective weighting method used to judge the dispersion degree of indicators. The entropy weight method is used to determine the index weight, avoiding the deviation caused by subjective influence. The calculation is high credible (Peng et al., 2020). The entropy weight method mainly includes the following three steps (Li et al., 2012): (1) Standardize the indicator data; (2) Obtain the information entropy of each indicator; (3) Determine the objective weight of each indicator. Entropy weight method was applied in this study to calculate the indicator weight in the STP and the STI, which made the analysis more objective. The calculation steps are as follows (A. Guo et al., 2018).


where
TOPSIS Model
TOPSIS is a common method in multi-objective decision analysis (Alvandi et al., 2021). It has a small amount of calculation, less information distortion, and intuitive geometric significance. The accuracy of the calculation is not affected by the number of indicators (Zhang et al., 2021). The basic idea of TOPSIS is to calculate the Euclidean distance (Ekmekcioğlu et al., 2021) between each evaluation scheme and the positive and negative ideal solutions and to calculate the relative closeness coefficient between each evaluation scheme and the ideal solution. Then the schemes are sorted according to the relative closeness coefficient (Fuchuan et al., 2021). TOPSIS mainly includes the following four steps (Ocampo et al., 2021): (1) Calculate the weighted normalized matrix; (2) Calculate the positive and negative ideal solutions; (3) Calculate the Euclidean distance between each evaluation scheme and positive and negative ideal solutions; (4) Calculate the relative closeness coefficient. In the paper, TOPSIS was used to calculate the STP index and STI index. The calculation steps are as follows (Sun et al., 2021).


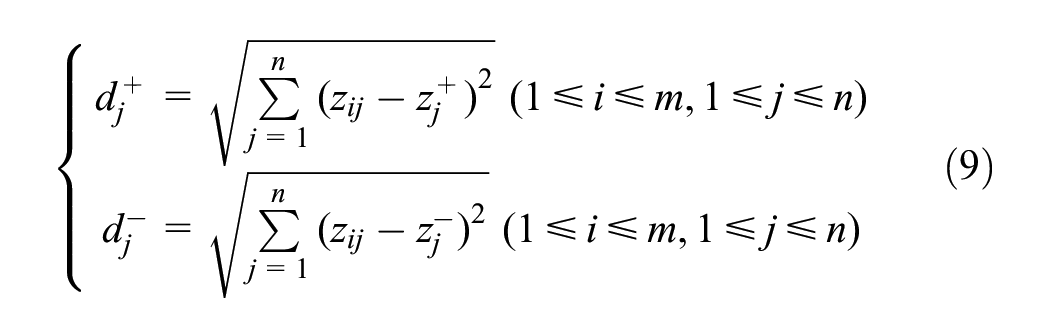

Where Z is the Weighted normative evaluation matrix,
GM(1,1) Model
GM(1,1) model is a prediction model used to analyze small samples and poor information (G. Liu et al., 2021). By accumulating original data to generate new sequences, the model establishes formulas to achieve data prediction (Zeng & Li, 2021). At the same time, the model, using the continuous gray differential model, makes up for the incomplete and inaccurate system information, which helps to ensure higher accuracy (X. Guo et al., 2021). The prediction accuracy of GM(1,1) is determined by the average relative error (Q) (Song & Mei, 2021). The smaller the Q is, the more accurate the model is, and the more reliable the prediction results are (Senpei et al., 2021). Precision grade of GM (1,1) is in Table 2. Based on the STP index and the STI index of China and Chinese 31 provinces from 2010 to 2019, this paper predicted the STP index and the STI index from 2020 to 2024. The prediction result of all indices reached grade I (Table 4).
Precision Grade of GM(1,1).

Relative Development Model
The relative development model is introduced to calculate the ratio of the STP index and the STI index (Linke et al., 2021). The ratio is to measure the relative development degree (RDD) of STP and STI. The formula is:

Where E is the RDD of STP and STI,
Relative Development Grade.

CCD Model
The CCD model was used to describe the correlation of interaction and influence between STP and STI. The degree of interaction and coordination of STP and STI could be defined as the CCD of STP and STI.


Where U1 and U2 represented the STI index and the STP index, respectively; C was the coupling degree between STP and STI; T was the composite index between them; D was the CCD between STP and STI; α and β were undetermined coefficients that reflect the importance of the contribution of STP and STI to the total system. Referring to the literature (Shen et al., 2018), the calculation formula of α and β was as follows:

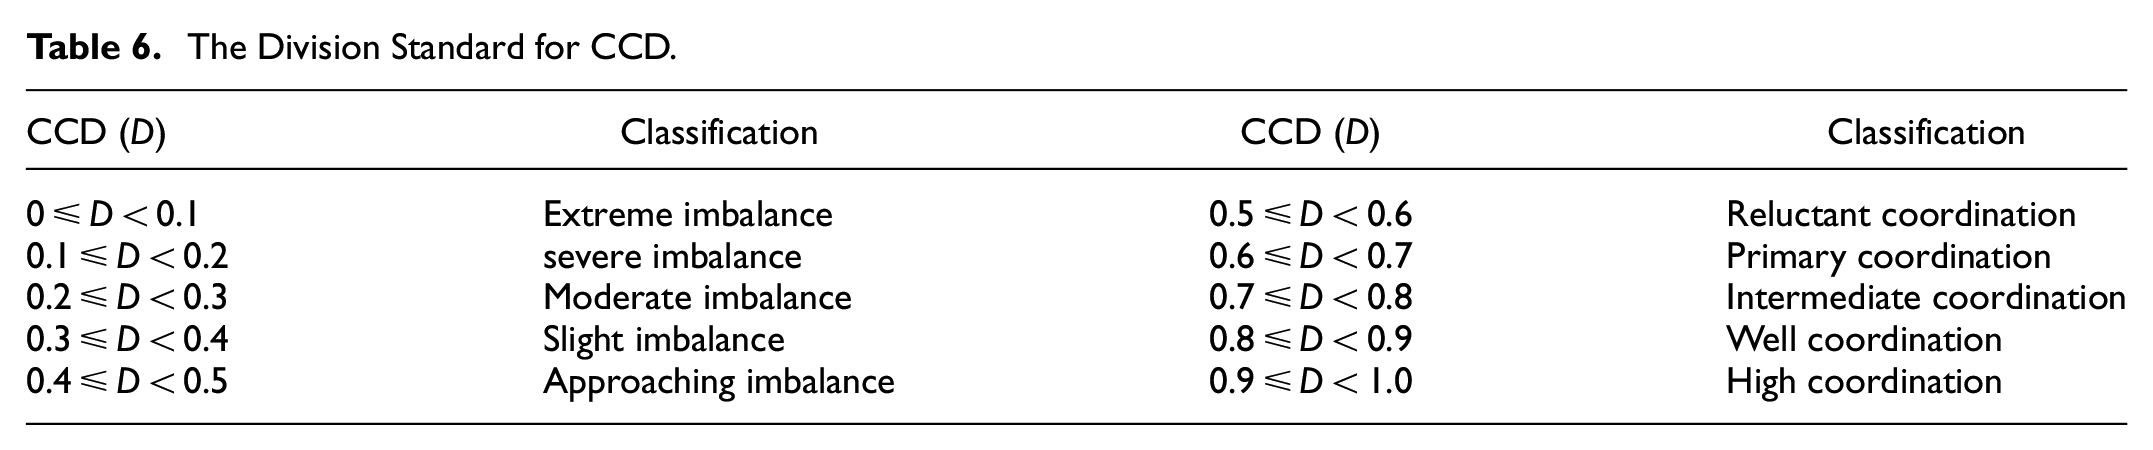
Referring to literatures (Geng et al., 2020; L. Liu et al., 2020), the CCD is graded, which is shown in Table 6.
The Division Standard for CCD.
Dynamic Degree
In order to measure the changing speed of CCD between STP and STI in China and Chinese 31 provinces, a dynamic trend index (Pan et al., 2021) was introduced to describe the dynamic change of CCD quantitatively. The formula was as follows:
Where K is the dynamic degree of CCD between STP and STI.
Results
Analysis of the STP Index and the STI Index
Comprehensive Analysis of China’s STP Index and STI Index
The index of China’s STP and STI (Figure 2a) was calculated from 2010 to 2019, and the RDD between STP and STI (Figure 2b).The index of STP in China was increasing, from 0.0709 in 2010 to 0.1642 in 2019, with an average annual growth rate of 15%. The index of China’s STP was predicted by GM (1,1) from 2020 to 2024. During this period, the index of STP continued to rise from 0.1365 to 0.1697. The future development trend was good, but the development level was still poor. The index of STI declined slightly in 2011, and then it showed a rapid growth trend from 2011 to 2019, rising from 0.0474 to 0.1642, with an average annual growth rate of 30%. The STI index continued to grow rapidly from 0.1940 to 0.3364 in 2020 to 2024. The results turned out that the development trend of China’s STI was excellent, but it still needed to make a great effort to achieve more improvement. STP development in China lagged behind STI in 2010 and 2018 to 2024, and STI lagged behind STP from 2011 to 2012, while STP and STI developed simultaneously from 2013 to 2017.

China’s STP index and STI index & China’s RDD between STP and STI: (a) the STP index and STI index and (b) the RDD between STP and STI.
Spatial Difference Between the STP Index and the STI Index
To further reveal the spatial differences of the development level of STP and STI in China, the STP index and the STI index of 31 provinces in China were calculated from 2010 to 2019, and the GM (1,1) was adopted to predict the STP index and the STI index from 2020 to 2024. The data in 2010, 2017, and 2024 were extracted to draw Ribbon Chart (Figure 3). In the STP index of Figure 3, Hainan, Xinjiang, and Qinghai ranked top 3 in 2010, Chongqing, Heilongjiang, and Ningxia ranked top 3 in 2017, and Shanghai, Chongqing, and Beijing ranked top 3 in 2024. From the perspective of time, it was found that the changes of STP index of 31 provinces were both increasing and decreasing. Compared with 2010, the growth rate of Shanghai, Chongqing, and Hubei in 2017 were in the top 3, while that of Guizhou, Jilin, Tianjin, Qinghai, and Hainan were all decreasing to some degrees. In 2024, the growth rate of Shanghai, Chongqing, and Beijing were in the top 3, Xinjiang, Anhui, Shanxi, Tianjin, and Hainan saw declines relative to 2010. In terms of STI, Shanghai, Heilongjiang, and Jilin were in the top 3 in 2010, Guangdong, Hebei, and Qinghai were in the top 3 in 2017, and the index in 2024 was forecast to show that Guangdong, Guizhou, and Hebei were in the top 3. From the perspective of time, it was found that 31 provinces had an increasing trend. Compared with 2010, the growth rate of Fujian, Guangdong, and Guizhou in 2017 were in the top 3, and that of Guangdong, Guizhou, and Hebei in 2024 were in the top 3.

China’s provincial STP index and STI index.
According to the results of RDD (Figure 4), in 2010, the number of provinces where STP lagged behind STI were three that were Shanghai, Hubei, and Anhui, while STP of 11 provinces (Xizang, Chongqing, Jiangsu, Shandong, Ningxia, Gansu, Inner Mongolia, Beijing, Liaoning, Jilin, and Heilongjiang) developed in parallel with STI, the rest of 17 provinces were lagging behind in STI. In 2017, the number of provinces where STP lagged behind STI were 15 that were Qinghai, Sichuan, Yunnan, Guizhou, Guangdong, Fujian, Jiangxi, Anhui, Henan, Shanxi, Shandong, Hebei, Tianjin, Inner Mongolia, and Jilin, while STP of 11 provinces (Xizang, Xinjiang, Shaanxi, Gansu, Ningxia, Chongqing, Hubei, Hunan, Guangxi, Hainan, Zhejiang, Jiangsu, Shanghai, Beijing, Liaoning) coincided with STI, and only Heilongjiang lagged behind in STI. By 2024, there would be no province where STI was lagging behind STP. There would be three provinces with simultaneous development, namely Beijing, Heilongjiang, and Shanghai, and the rest of 28 provinces’ STP were lagging behind that of STI. According to analysis and actual data above, the number of provinces where STP lagged behind STI were increasing year by year, the number of provinces with synchronous development first increases and then decreases, while the number of provinces where STI lagged behind STP were decreasing year by year, which was consistent with the overall development of the country.

China’s provincial RDD.
The results showed that China paid more and more attention to STI, and the Chinese government had introduced new policies to support STI from various aspects such as education and finance (Pang et al., 2020). China’s STI index had been growing rapidly, but the overall level of STI was still at a low level, one of the main reason was that Chinese citizen’s scientific quality was rather poor, so developing STP was important to improve Chinese citizen’s scientific quality. However, the index of STP in China grew slowly, and was lower than that of STI index constantly. From 2018 to 2024, China’s overall STP lagged behind STI, and became worse and worse with the time by.
Analysis of CCD Between STP and STI
Analysis of China’s CCD Between STP and STI
The CCD decreased in 2011 and increased steadily in the next years (Figure 5). The type of CCD from 2010 to 2013 was moderate imbalance, and it transformed into slight imbalance from 2014 to 2019. It was predicted that the type of CCD would still be slight imbalance in 2020 and it would change into approaching imbalance in 2021 to 2024. The results showed that CCD between STP and STI presented an optimistic trend, but it was still in the imbalance stage. To ensure the balanced development of STP and STI, China should strove to build a STP environment which was suitable for STI in stimulating the demand of STP, optimizing the supply of resources, improving the working system.

China’s CCD between STP and STI.
Spatial Difference of CCD Between STP and STI
The spatial distribution of CCD in Chinese 31 provinces was shown in Figure 6 in 2010, 2017, and 2024. From the spatial distribution of CCD, there were obvious regional differences in CCD of STP and STI in 31 provinces of China. In 2010, the CCD’s distribution of STP and STI in 31 provinces of China was divided into severe imbalance, moderate imbalance, and slight imbalance. Fujian was severe imbalance, Heilongjiang, Jilin, and Hainan were slight imbalance, the rest were moderate imbalance, which accounted for 87.1% of the total. In 2017, the provinces of severe imbalance and moderate imbalance had been transformed into slight imbalance, with 31 provinces in China being slight imbalance. In 2024, the CCD of most provinces in China were slight imbalance and approaching imbalance. The number of provinces of slight imbalance accounted for 48.4% of the total, which mainly distributed in northern China. While approaching imbalance accounted for 45.2%, which mainly existed in southern China. The rest two provinces were reluctant coordination and moderate imbalance, in which Chongqing rose from slight imbalance to reluctant coordination, Anhui decreased from slight imbalance to moderate imbalance instead.

China’s provincial CCD.
Dynamic degree was adopted to measure the changes of CCD in Chinese 31 provinces during 2010 to 2017, 2017 to 2024, and 2010 to 2024 (Figure 7). From 2010 to 2017, the maximum dynamic degree was Fujian (15.91%), the minimum dynamic degree was Jilin (0.14%), and the dynamic degree average of 31 provinces was 4.62%. The dynamic degrees of 31 provinces were positive. This showed that the CCD in 31 provinces in this stage were on the rise compared with 2007. From 2017 to 2024, the maximum dynamic degree was Chongqing (6.51%), the minimum dynamic degree was Hebei (0.28%), and the dynamic degree average of 31 provinces was 2.44%. It indicated that the growth of CCD from 2017 to 2024 was much smaller than that from 2010 to 2017. The CCD of Hainan and Anhui were declining in 2024 compared with that of 2017, with the dynamic degrees of −0.78% and −1.60%, respectively.

China’s provincial dynamic degree of CCD.
In general, the maximum dynamic degree was Fujian (11.46%), while the minimum dynamic degree was Anhui (0.25%) from 2010 to 2024. In terms of the direction of change, the dynamic degrees of most provinces in China developed toward the same direction, there was only one province, Anhui, whose CCD was declining with dynamic degree of −0.31%. The results showed that during the research period, the CCD of most provinces in China were on the rise, and the difference among provinces was small.
Conclusions
In June 2021, The Chinese State Council issued the Outline of the Action Plan for Improving Scientific Literacy for All (from 2021 to 2035), making far-reaching plans for the STP and the improvement of science literacy in the new stage of development. If STI is like a building, STP is the foundation of the building. Tall buildings cannot exist without the foundation. If the STP does not develop well, it will be difficult for STI to promote. It is inevitable to perfect STP, spread scientific spirit and popularize scientific knowledge, which is beneficial to create a social atmosphere where science and technology are studied, applied, and innovated.
By establishing two systems of STP and STI, the STP index and the STI index, as well as the RDD and CCD, were calculated. The results showed that (1) The STP index and the STI index of China and Chinese 31 provinces were calculated and predicted from 2010 to 2024, which concluded that the development of STP and STI were at a low level. (2) The development level of STP and STI existed differences in China and the growth rate of STI was higher than that of STP, both of which led that STP lagged behind STI. Many provinces whose STI lagged behind STP and whose STI and STP develop simultaneously had been transformed into provinces whose STP lagged behind STI. It was predicted that the proportion of provinces whose STP lagged behind STI were as high as 90.3% by 2024. (3) From 2010 to 2024, the CCD between China’s STP and STI experienced moderate imbalance, slight imbalance, and approaching imbalance. Chinese 31 provinces experienced by severe imbalance, moderate imbalance, slight imbalance, approaching imbalance, and reluctant coordination. In terms of spatial distribution, by 2024, it was predicted that most of the 31 provinces were still in the unbalanced stage, showing a pattern of high in the south and low in the north. The results showed that the CCD was developing in a good direction, which was in line with the requirements of high-quality development of STP and science quality construction (Allum et al., 2008), and it helped to promote the coordinated development of STI and STP. However, the CCD between STP and STI was still not at a high level, and the development of STP was far lower than that of STI, the main reasons of which were that STP lacked of financial investment, STP personnel did not show high ability, the technical means of STP were backward relatively, and the sense of responsibility of STI subject was weak.
Policy Recommendations
Based on the dynamic evolution and CDD’s development of STP and STI, suggestions on how to promote the coordinated development of STP and STI in China and how to integrate them into China’s innovation-driven development strategy were put forward as follows:
Chinese government should formulate plans for the STP infrastructure, and incorporate the construction of STP infrastructure into the national economic and social development plan. A modern science & technology museum system with integration and sharing of science centers, museums and cultural centers should be built, the establishment of national science popularization education demonstration bases could be promoted, and innovative research of educational products for STP and publicity activities should be carried out (Vickery et al., 2023). Chinese government ought to guide parks, nature reserves, scenic spots, and other public places to provide more STP services.
Chinese government should improve the ability to create and spread STP works. Cartoons, short videos, games, and other STP works ought to be vigorously developed. The government develop STP creative talents, train STP leaders, integrate sci-tech communication with movies and television, and strengthen the creation of science fiction movies and television (Alghamdi & Alotaibi, 2021). The National STP Film Screening Alliance should be established to build a platform for creating, communicating, and sharing of excellent works. Big data, cloud computing, AI, block chain, and other technologies should be applied more frequently to STP. Smart education (Riekki & Mammela, 2021), smart city (Westraadt & Calitz, 2020), and smart community (Rath et al., 2021) should be deeply integrated with STP to realize the application of STP information.
The plan of STP activities should be implemented at the grassroots level. Chinese government should strengthen the development of STP facilities at the community level, and expand the functions of STP services in urban and rural community comprehensive service centers, community libraries, and community universities. A team of full-time STP personnel should be developed vigorously in STP venues, science publishing, new media, science research, and other fields. Chinese government ought to promote the use of high-quality STP resources in old revolutionary districts, ethnic minority regions and border areas.
STI personnel and institutions should enhance the sense of responsibility for the development of STP. The government should encourage related institutions and personnel for science and technology projects to carry out STP. STP should be incorporated in the evaluation indicators of science and technology awards and scientific and technological personnel’s professional qualifications.
Giving full play to the role of mass media and building platforms for information exchange and sharing. We should build a Chinese version of Eurekalert, to build a communication platform for the mass media and scientific institutions, so that scientific editors and scientific journalists can know the latest STI achievements at the first time, and create excellent STP works. In addition, we should provide scientific editors and scientific journalists with scientific reporting grants to support them to follow and report on scientific progress. Furthermore, STP awards and science and technology journalism awards should be set up to reward innovative or influential works.
Supplemental Material
sj-xlsx-1-sgo-10.1177_21582440231219547 – Supplemental material for Dynamic Evolution and Trend Analysis of the Coupling Coordination Between Sci-Tech Popularization and Sci-Tech Innovation in China
Supplemental material, sj-xlsx-1-sgo-10.1177_21582440231219547 for Dynamic Evolution and Trend Analysis of the Coupling Coordination Between Sci-Tech Popularization and Sci-Tech Innovation in China by Hao Wang, Xiaoya Zhao, Guodang Yang and Xiaoxue Liu in SAGE Open
Footnotes
Acknowledgements
I would like to thank the editor and the anonymous reviewers. I do appreciate the time and effort they put into reading and commenting on this manuscript. Their thorough review and constructive feedback improved the quality of this paper.
Author Contributions
Hao Wang: writing—original draft and data curation. Xiaoya Zhao: data curation and writing—review and editing. Guodang Yang: editing and drawing. Xiaoxue Liu: supervision. All authors have read and agreed to the published version of the manuscript.
Declaration of Conflicting Interests
The author(s) declared no potential conflicts of interest with respect to the research, authorship, and/or publication of this article.
Funding
The author(s) disclosed receipt of the following financial support for the research, authorship, and/or publication of this article: This research is partly supported by scientific research Project of Jishou University for supporting research grant No. 21SKJS12.
Data Availability Statement
Data sharing not applicable to this article as no datasets were generated or analyzed during the current study.
References
Supplementary Material
Please find the following supplemental material available below.
For Open Access articles published under a Creative Commons License, all supplemental material carries the same license as the article it is associated with.
For non-Open Access articles published, all supplemental material carries a non-exclusive license, and permission requests for re-use of supplemental material or any part of supplemental material shall be sent directly to the copyright owner as specified in the copyright notice associated with the article.