
Abstract
Coupling tourism development (TD), scientific and technological innovation (ST), and ecological environment (EE) is crucial to regional sustainable development, and it is necessary to explore the spatial and temporal characteristics. The study constructs a coordinated development evaluation index system for the three subsystems. And the spatiotemporal characteristics of the coupling coordination between TD, ST, and EE were revealed by applying the entropy method, coupling coordination model and based on the panel data of 30 regions in China from 2005 to 2020. The results show that: (1) the comprehensive development index and coupling coordination degree show an increasing trend, focusing on the stages of endangered and mild imbalance recession;(2) Most regions are in a state of high coupling and low coordination, mainly concentrated in tourism lagging or science and technology lagging; (3) the coupling coordination shows a spatial pattern as the moderate imbalance in the northwest and the relative balance in the southeast, with a vast regional disparities and clustering characteristics; and (4) the gray prediction model shows that the coupling coordination degree will continue the upward trend in the future. In a nutshell, this research presents a novel framework and results that can be used as an evaluation index and policy insights for coupling TD, ST, and EE.
Keywords
Introduction
UNWTO promotes sustainable tourism development, puts forward the responsibility of tourism for current and future economic, social, and environmental impacts, and advocates that tourism is the driver for economic development, inclusive development, and environmental sustainability (Yang et al., 2022). As a service industry, tourism exhibits high input and low output characteristics, and early tourism was primarily hampered by limited technological content and severe environmental damage. As a result, promoting the coordinated development of tourism (TD), science and technological innovation (ST), and the ecological environment (EE) has significant practical implications for improving the structure of the tourism industry, encouraging the use of technological products (Rodriguez et al., 2014), and resolving the conflict between social development and ecology. However, influenced by the innovation-driven mechanism and environmental regulation, significant differences in the resource base, market scale, innovation input, and environmental protection among regions are emerging (Qin & Li, 2021), which lead to unbalanced and inadequate developments in tourism, scientific and technological innovation, and the environment. Thus, how to avoid the deterioration of the ecological environment brought by tourism development and how to further promote tourism development through technological innovation have become the focus of all countries (Duan et al., 2020).
Undoubtedly, China has become one of the most important tourist source markets and destinations in the global tourism market and plays a corresponding role in leading the new pattern of world tourism (Qin, 2020). While developing tourism, China also attaches great importance to the construction of ecological civilization and technology by proposing a Chinese strategy that Clear Waters and the Green Mountains are Gold and Silver mountains and advocates the “Internet+Tourism” to expand the application of new technology scenarios (Zhou et al., 2022). According to incomplete statistics, over 500 scenic spots in China have applied AR and VR, and 4A-level scenic spots have launched intelligent management systems, which not only increase interactivity and immersion of tourists but also protect the scenic environment and monitor the flow of people in real-time (Guttentag, 2010; Lai et al., 2022). In addition, technological innovation has played an essential role in identifying uncivilized tourism behavior, optimizing ecotourism routes, and accurately assessing and stimulating the environmental carrying capacity of tourist destinations (Liu et al., 2021), constantly pushing tourism and ecology toward sustainable development. Therefore, taking China as an example to explore the level of coupled tourism-technology-ecology development and its spatial differences is of practical value for the sustainable development of the three subsystems. The achievements also can be useful for other case studies or other regions.
The term coupling was originally introduced in physics to describe the interaction and reciprocal influence between two or more systems (Mbaiwa, 2003). With tourism development, the academic community has paid extensive attention to the study of tourism coupling, mainly focusing on the following three aspects: (1) Using entropy value methods, coupled coordination models, or econometric regressions to evaluate the degree of coordinated development of two systems (Yang & Su, 2021), then providing the realistic basis to narrow the gap between regions or industries. (2) Examining the factors that significantly impact coordinated development, such as the level of economic development, technology, and government support. (3) Mainly focusing on the coupling of tourism-economy (Kai-Cheng et al., 2018), tourism-urbanization (Liu & Chen, 2020), and tourism-ecology (Deng et al., 2020), examining the relationship between tourism, economy, and the ecological environment. In general, the existing studies have provided valuable references but still leave some questions to be addressed. Firstly, the existing studies have mainly focused on the coupling between two systems. However, no empirical evidence has been provided on how tourism, science and technology innovation, and the ecological environment interact with each other, and the degree of coupling coordination among them is rarely mentioned. In addition, existing research has focused on local areas such as the Yangtze River Economic Belt, cities along the Silk Road, and the Pearl River. It lacks spatial difference analysis and prediction of the coordinated development of the three in a wider range. Secondly, the most relevant research remains at the macro level of theoretical discussion on the relationship and at the micro level of improving tourism, technology, or ecology. A systematic discussion of the mesoscopic level of tourism, science and technology innovation, and environmental development is lacking.
Thus, by constructing the coordinated development evaluation index system of the three subsystems, this paper uses the entropy value method, coupled coordination model, and gray prediction model to explore the mechanism of coupled coordination among TD, ST, and EE from the evidence provided by 30 regions (refer to the 30 provinces and cities in China, except for Tibet, Hong Kong, Macao, and Taiwan) in China from 2005 to 2020, aiming to clarify the spatial and temporal evolution characteristics and forecast their future evolution trends. It is of great theoretical significance to support the realization of the high-quality development of the three subsystems and great practical significance to accelerate the harmonious and healthy development of TD, ST, and EE. As mentioned, this study provides possible contributions in (1) revealing the dynamic trends of the coordinated development of TD, ST, and EE in China, breaking through the traditional research limited to the interaction of the two systems and providing a reference for other scholars in the selection of variables; (2) exploring the spatial differences and correlations in the degree of coupling and coordination among TD, ST, and EE, providing empirical evidence for regions to narrow the gap between regions or industries; (3) predicting the coupling degree of TD, ST, and EE and providing a theoretical reference for government management and future work plans.
Literature Review
Research on the Relationship Between TD, ST, and EE
Currently, plenty of excellent results have been achieved in tourism, science and technology innovation, and ecology. Tourism and technology innovation have a mutually reinforcing effect on each other. The practice has shown that technological tourism emerged in the process of tourism development (Yuwei, 2019). Technology innovation, which is highly information-intensive, plays a significant role in the tourism industry (Atcharaporn & Borworn, 2018), such as providing new tourism experiences for disabled and older people with barrier-free needs (Fennell, 2021). Technology-based smart tourist systems also play an essential role in the visitor experience and supporting sustainable development (Cuong & Duy, 2021).
Numerous studies have explored how to achieve high-quality development of technology and ecology. Scientific and technological innovation can provide efficient support for environmental governance and enhance the governance capacity. Previous studies have proved that scientific and technological innovation could bring beneficial environmental benefits and have a significant inhibitory effect on the discharge of industrial wastewater and sulfur dioxide (Xu & Zhang, 2021). However, the effect on waste reduction would be limited if the technical level remained unchanged (Ruibo et al., 2022). In turn, harsh ecological policies also have an effect on technological innovation, as Wang et al. (2022) proved that solid environmental regulations could improve the level of scientific and technological innovation, meanwhile, sustainable ecological protection policies could also reduce environmental pollution caused by tourism (Wang & Wu, 2022).
The unity of opposites is present in the relationship between tourism development and the ecological environment. Previous research has shown that tourism development takes an excellent ecological environment as its material basis. However, energy consumption and increased carbon emissions, such as tourism transportation, have adverse environmental effects (Meng et al., 2016; Wang et al., 2020). Tourism and the ecological environment have a specific negative correlation (Dwyer et al., 2010). However, some studies have taken the opposite view and verified that there was a particular Kuznets curve between tourism and the environment. In other words, when tourism development reaches a certain inflection point, it improves the quality of the ecological environment (Ying & Wong, 2020). In addition, different types of tourism have different impacts on the environment. Ecotourism development had a positive external effect on the environment, and recent evidence also proved that tourism could promote the sustainable development of the ecological environment through technical means (Phelan et al., 2020).
In general, a large volume of published studies describes the theoretical interactions relationships between tourism, science and technology innovation, and the ecological environment. However, few studies have examined the coupling interactions between the TD, ST, and EE subsystems within the same framework. Little research has also been conducted on the spatial and temporal development of TD, ST, and EE coupling in various regions of China, so more empirical studies are needed. Thus, exploring the coordinated relationship between the three subsystems and encouraging regions to achieve a coordinated level of development is thus an urgent need in the context of sustainable development.
Coupling Mechanism of the TD, ST, and EE System
Based on the previous relationship studies, tourism, science and technology innovation, and the ecological environment are interlinked and influence each other. The coupling mechanism of the three subsystems is shown in Figure 1.

Coordination mechanism of tourism development, scientific and technological innovation, and ecological environment.
First, tourism development provides orientation and landing conditions for science and technology innovation, while science and technology innovation provide technical support for tourism development: (1) Rising tourism demand will lead to the exploration of innovative projects and experiences, expanding the market for science and technology innovation and providing directional guidance for innovation in science and technology products. (2) Tourism development will promote the creation of science and technology innovation platforms and improve the level of tourism information technology, in an attempt to advance the implementation and transformation of science and technology innovation products. (3) Science and technology innovation provides technical support to the tourism industry. Specifically, it can improve the utilization efficiency of resources, the diversification of tourism activity paths, and the enrichment of experience (Wang et al., 2017; Zhang & Dong, 2021), then increase tourism attractiveness.
Second, technological innovation provides technical support to ecological and environmental protection, and strong conservation policies promote technological innovation: (1) Science and technology provide efficient technologies for environmental management, enhancing governance capacity and reducing industrial wastewater, sulfur dioxide, and other pollution emissions. (2) The ecological environment provides the material vehicle for technological progress, and its real-time conditions require technological change and upgrading. (3) Harsh ecological and environmental policies can create impetus for scientific and technological innovation, and environmental regulation can lead to an increase in the level of scientific and technological innovation, which can affect the treatment of environmental pollution in turn (Conceição et al., 2004).
Third, although tourism development brings ecological pressure, it can promote the sustainable development of the ecological environment, which in turn provides the material carrier and the limit of carrying capacity for tourism development (Ye et al., 2016): (1) Tourism development depends on an excellent ecological environment, and overdevelopment will undermine ecological sustainability, but tourism can contribute to ecological sustainability through technological change. (2) Tourism development allows society to accumulate wealth, which can provide certain financial support for protecting and governance of the ecological environment. (3) The ecological environment will provide the resource and material basis for tourism development, and the environmental carrying capacity requires the moderate expansion of the tourism scale.
Methods
Construction of Comprehensive Evaluation Index System Model
Based on the existing coupling coordination research (Li et al., 2019; Liao, 1999; Zhong & Yang, 2013) and the proposed coordination mechanism, this paper constructs the comprehensive development index system model, including three subsystems and nine indicators for evaluating the TD, ST and EE according to the index representative, data availability, construction system and scientific principle, contains 32 specific indicators (Table 1). The tourism development subsystem contains 12 indicators, mainly reflecting the tourism resource base, tourism market scale, and tourism support system. The science and technology innovation subsystem includes ten indicators, mainly reflecting the input, output, and environment of science and technology innovation. The ecological and environment subsystem contains ten indicators, mainly reflecting the three dimensions of ecological pressure, response, and status. Among them, three indicators of EE pressure are negative, and the rest are positive.
Comprehensive Evaluation Index System Model of TD, ST, and EE.

Note. The table is compiled by the authors.
Methodology
Entropy Value Method
The entropy value method can comprehensively reflect the information of the index, fully express its entropy value, utility value. The obtained weight and comprehensive evaluation index have high credibility (Xie et al., 2021). Therefore, it can be suitably used to evaluate TD, ST, and EE system in 30 regions in China. The specific steps to use the entropy value method to work on the raw data are as follows:
(1) Standardized processing of the raw data.


In the formula,
(2) Calculation indicators weight.

(3) Calculated the coordinated development of TD, ST, and EE in each region from 2005 to 2020.


In the formula,
Coupled and Coordination Model
First, calculate the three coupling coefficients in each region (Xie et al., 2021):

Then, introduce the coupling coordination degree formula to analyze the mutual coordination degree among the three and reflect the high level of the coupling coordination degree:

Referring to Liao’s (1999) method to grade the coupling and coordination by distribution function, we determine the coordinated development degree and development type of TD, ST, and EE in each region (Table 2).
Discriminant Criteria and Division Types of Coupling Degree.

Note. The table is compiled by the authors.
Gray GM (1,1) Prediction
The gray prediction model is recognized as the best prediction model for building random systems in the field of economy, society, and management. The procedures for calculation are as follow (Li et al., 2021):
(1) Set the original data as

In the formula,
(2) Set

In the formula,
(3) The accuracy test of the gray prediction formula is shown in Table 3. If and only when the p and c values reach the accuracy level above barely qualified, respectively, the predicted value of the index can be calculated, otherwise the formula should be modified by analyzing the residual sequence.
Gray Prediction Accuracy Inspection Level Standards.

Data and Sample
This study tests the data from 30 regions in China from 2005 to 2020. The data comes from China Statistical Yearbook (2006–2021), China Tourism Statistical Yearbook (2006–2018), China Culture and Cultural Relics Statistical Yearbook (2019–2020), China scientific and technological innovation Yearbook (2006–2021), China Environmental Statistical Yearbook (2006–2020), regional National Economic Statistical Bulletin and Tourism Statistical Yearbook, the data from Peking University Magic Legal Database, and official website of State Bureau of Statistics. Some missing data were estimated by means of average annual growth rate and interpolation method.
Results
Analysis of Coordinated Development Evaluation Results of TD, ST, and EE
Based on the constructed comprehensive evaluation index system model of TD, ST, and EE, we use the entropy value method and the coupling coordination model to calculate the comprehensive development level (T), coupling coefficient (C), and coupling coordination degree (D), shown in Table 4. According to the mean of comprehensive development level and coupling coordination, and the evaluation criteria shown in Table 2, the overall coupling coordination type of each region is proposed (Table 5).
Coordinated Development Evaluation Results of TD, ST, and EE from 2005 to 2020.

Note. The table is calculated by the authors.
Classification of the Coupling and Coordination Degree Types of TD, ST, and EE.

Note. The table is calculated by the authors.
Analysis of Comprehensive Development Index
The comprehensive development level of the three subsystems in various regions shows a rising trend overall, with a decreasing trend in the eastern-northeast-central-western regions. Specifically, based on the mean comparison of the comprehensive coordination index of the three subsystems from 2005 to 2020, the top five regions of comprehensive development level were Guangdong, Jiangsu, Zhejiang, Shandong, and Beijing. However, that of Hainan was relatively low and ranked at the bottom. Sichuan, Hubei, and Hunan had a relatively high level of comprehensive development among the central and western regions, while Xinjiang, Ningxia, and Qinghai have long been at the bottom. This distinction demonstrates how regional resources have a significant impact on the development of TD, ST, and EE. Furthermore, in a horizontal comparison, overall comprehensive development grew slowly from 2005 to 2015, because the public had a shallow awareness of the coordinated interaction between TD, ST, and EE at that time. And when the growth reached a certain level, it changed from expanding scale to improving quality, and the government intervened and regulated tourism development and the environment standard. Hence, the growth rate slows down. While some regions, such as Guangdong and Jiangsu, significantly increased their level of comprehensive development after 2015. Maybe with tourism’s rapid development and ecological and environmental improvement, the comprehensive development level has gradually increased.
Analysis of Coupling Coefficient and Coordination
The regions show high coupling and low coordination. After 2005, the regional coupling coefficient (C) is greater than 0.7, and the coupling coordination (D) is mostly under 0.5, indicating that a specific subsystem in some regions is weak. Comparatively, the types of TD, ST, and EE relationships are the legged tourism development and the legged scientific and technological innovation. The eastern region all are the legged science and technological innovation except Guangdong and Jiangsu, indicating that the level of tourism development and environmental protection has had a clear advantage over the same period, but science and technology innovation is relatively weak. In fact, the eastern region is dominated by the tertiary sector, with a great natural environment and relatively high-level science and technology. However, compared to the tourism industry, characterized by high investment and rapid income, science and technology research takes time and experimentation. Therefore, the growth rate of science and technology in the eastern region is still slightly slower than that of tourism development. In the central and western regions, the types of TD, ST, and EE relationships are the legged tourism development and the legged scientific and technological innovation, indicating that tourism development or science and technology innovation needs to be improved compared to the level of environmental protection.
Analysis of Coupling Coordination Degree
The degree of coupling coordination of the three subsystems was between 0.2 and 0.7 from 2005 to 2020, focusing on the stages of endangered imbalance recession (30%) and mild imbalance recession (40%), and there is still an enormous growth in the future. Overall, the coupling coordination has risen from 0.25 in 2005 to 0.46 in 2020, with an increase of 79.29%, which showed the increasing synergistic effects of the three subsystems. Specifically, based on the average value of coupling coordination degree, the 30 region’s coordinated development level can be divided into two stages: 2005 to 2017 is that the overall level of coupled coordination of TD, ST, and EE is located in the antagonistic stage, with the factors of the three subsystems mainly inhibiting each other in the process of interaction. The second stage, from 2018 to the present, enters the running-in stage, indicating that the overall level reaches a basic state of coordination, with the mutual promotion of the system increasing and the inhibiting effect decreasing. In fact, the average level of the eastern region is located in the running-in stage after 2013, among which the faster-developing regions such as Guangdong already entered the intermediate coordination stage in 2018; while the central region only entered the running-in stage in 2016 and reached the basic coordination; the northeastern region and the western region are still in the antagonistic stage, and only Sichuan and Shaanxi have reached the basic coordination state. This might be connected to how well Chinese policies are carried out in various areas, such as the Opinions on Accelerating Tourism Development published in 2010, Opinions on Promoting Tourism Reform and Development in 2014, and the High-Quality Development proposed in 2017.
From time perspectives, there are differences in the changes in coupling coordination in different regions. The central and western regions have relatively significant changes in coupling coordination. The central region has increased from 0.26 in 2005 to 0.49 in 2020, with an average annual growth rate of 4.40%; the western region was from 0.21 to 0.38, with an average annual growth rate of 4.22%. In the eastern region, the changing trend is relatively modest, with the coupling coordination rising from 0.30 in 2005 to 0.53 in 2020, with an average annual growth rate of 3.97%. In contrast, the northeastern region remains backward, increasing from 0.26 in 2005 to 0.41 in 2020, with an average annual growth rate of 3.06%. The reason for the difference is that the level of science and technology innovation is relatively low in the central and western regions, and there exists greater room for growth in the effect of science and technology innovation on tourism development, so the coupling coordination degree changes more significantly. However, because of the rule of diminishing marginal effects, the increase in tourism development and the coupled coordination level in the eastern region seem less susceptible to a developed economy and high-level science.
Analysis of Spatial-temporal Characteristics of Coordination of TD, ST, and EE
Spatial Characteristics
In order to better illustrate the spatial-temporal characteristics of the coupling coordination of TD, ST, and EE in various regions, the year 2005, 2010, 2015, and 2020 are selected to draw the changing map of regional coupling coordination types with ArcGIS (Figure 2).
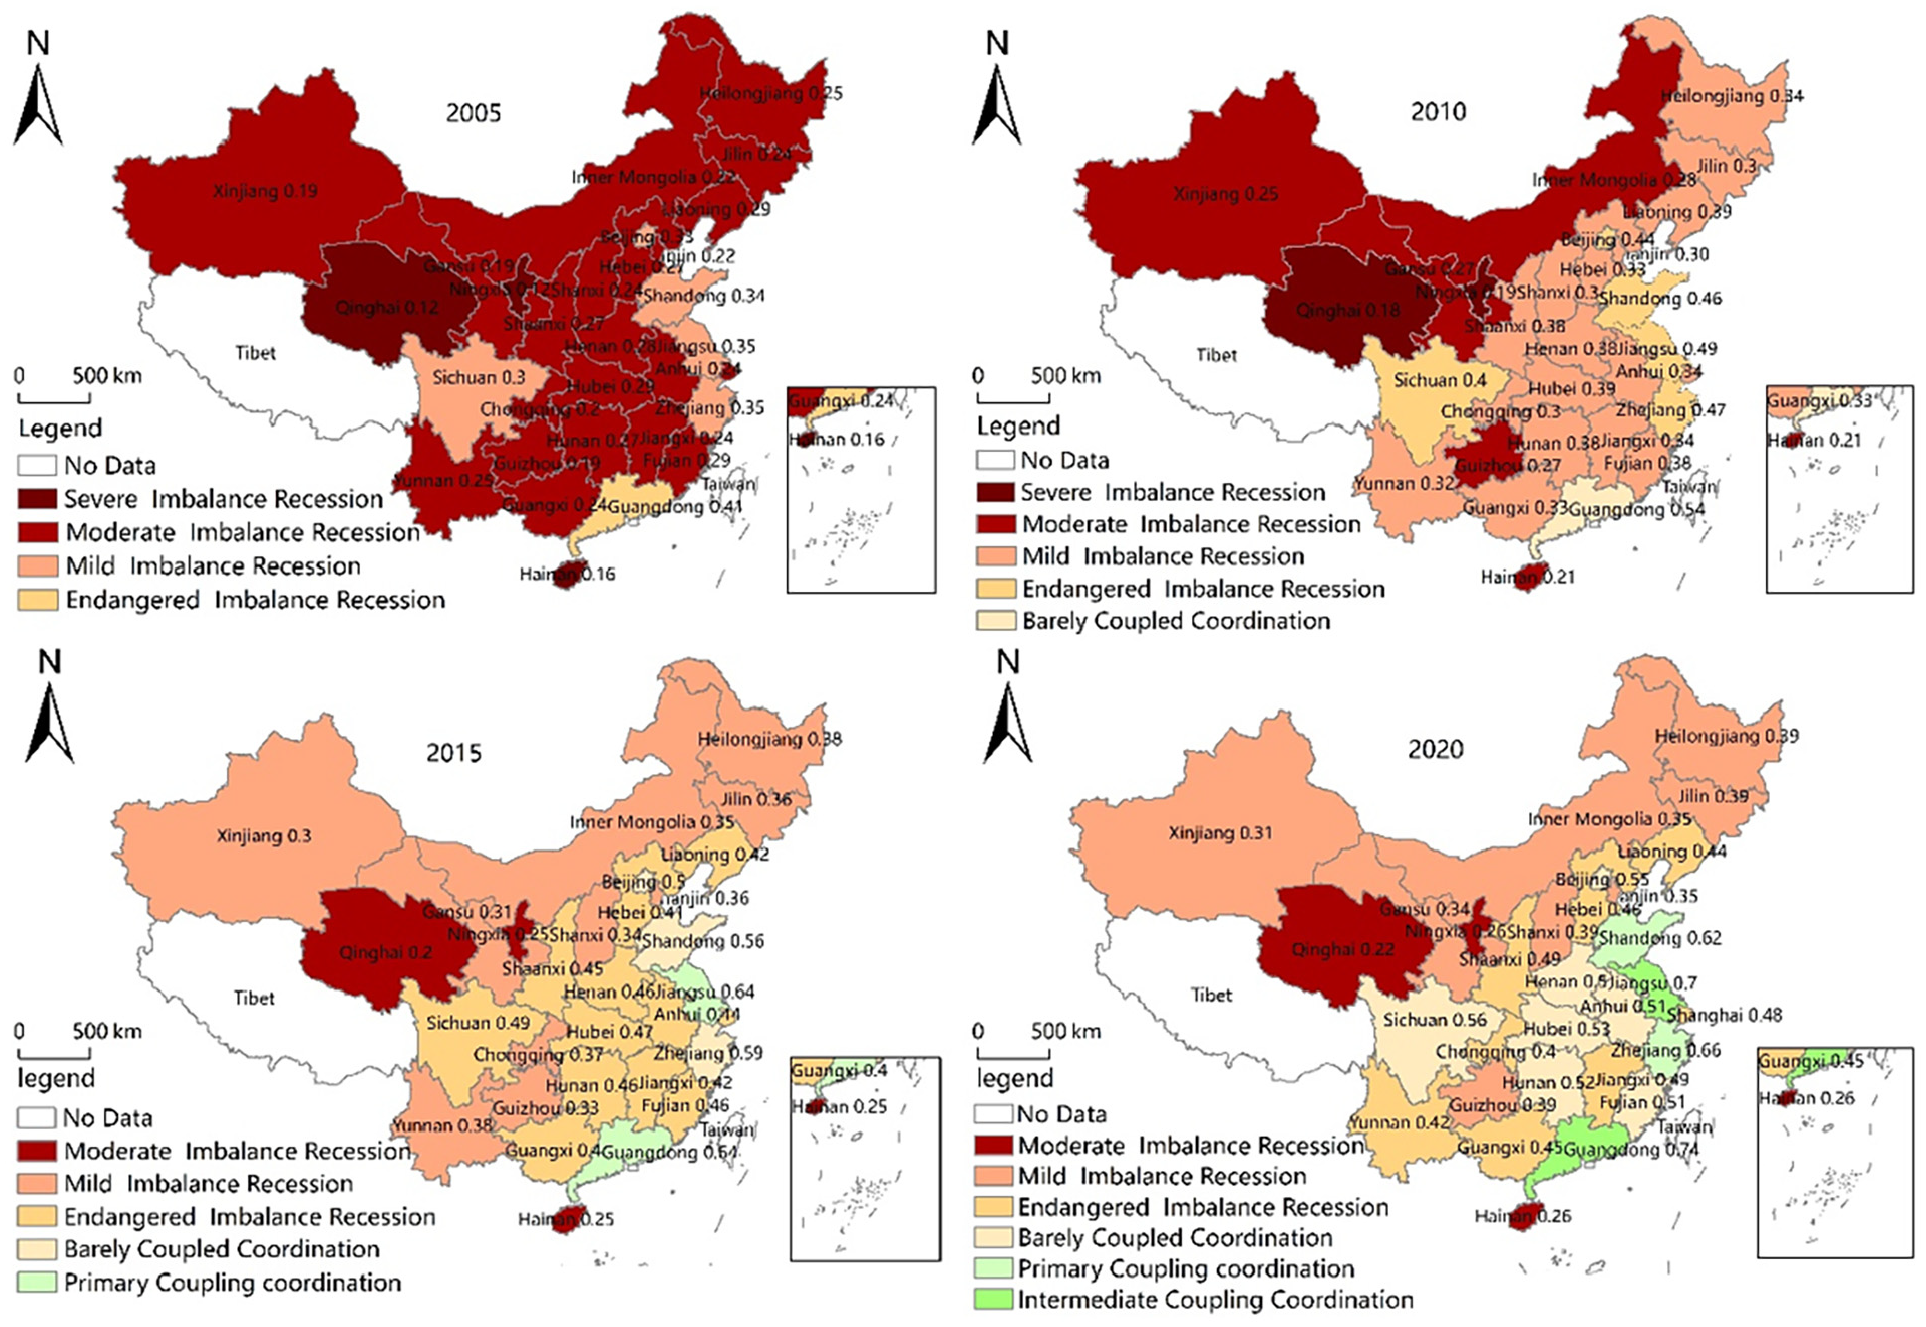
Evolution of the coupling coordination type of TD, ST, and EE.
Figure 2 shows that the coupling coordination degrees of the three subsystems have inconsistent development levels in the past 16 years, showing an upward trend. Moreover, the coupling coordination types gradually differ with evident spatial heterogeneity, showing an increasing trend from northwest to southeast. The spatial pattern of moderately unbalanced development in the northwest and relatively balanced development in the southeast is presented. Specifically, in 2005, the coupling coordination was concentrated at the moderate imbalance recession, indicating a slight difference in the level of TD, ST, and EE, probably related to the heavy industry-led structure of the region at that time. During the period of 2005 to 2010, the coupling gradually increased in the northeast, southeast regions, and Sichuan, changing from mild and moderate levels to endangered and mild imbalance recession types. While Guangdong entered barely coupled coordination types, probably related to The 16th Asian Games Guangzhou 2010 and The 1st Asian Para Games Guangzhou 2010, which accelerated economic and tourism development and improved infrastructure. The western region has not changed and is in a moderate imbalance recession, which is related to the poor tourism infrastructure, inconvenient transportation, and industrial-based structure that has caused damage to its ecological development. By 2015, the northwestern region except Ningxia and Qinghai had entered a mild imbalance recession, the central region had become an endangered imbalance recession, and part of the eastern region had gradually entered the primary coupling coordination. The degree of coupling coordination of TD, ST, and EE shows a decreasing pattern of east-central-west, reflecting the influence of the rapidly developing economic and tourism level, transportation, infrastructure, and policies during the period. During 2015 to 2020, the degree of coupling coordination further improves, with some central regions entering the primary coupling coordination and some eastern regions entering the intermediate coupling coordination type. However, the coordinated development of the three subsystems has apparently struck a standstill, as there has been little change in the northwest and northeast sectors.
Spatial Agglomeration Characteristics
In order to explore whether there is spatial dependence on the coupled coordination of TD, ST, and EE in different regions, ArcGIS is applied to analyze the global spatial auto-correlation (Global Moran’s I) on the coupled coordination of all regions in 2005, 2010, 2015, and 2020 (shown in Figure 3). Judging the relationship between Moran’s I and 0 indicates that the relationship between spatial coupling coordination should be positive (agglomeration), negative (discrete), or no correlation (random). Figure 3 demonstrates the increase in the Global Moran’s I index from 0.0908 to 0.1459, showing spatial auto-correlation, and its p-value has passed the significance test at a 90% confidence level since 2007, showing the agglomeration spatial effect.

The Global Moran’s I index and p value of coupling and coordination degree of TD, ST, and EE.
On the basis of spatial auto-correlation, in order to explore the differences in agglomeration characteristics in different regions, LISA significant level map is applied to conduct local auto-correlation analysis (Local Moran’s I) in 2005, 2010, 2015, and 2020. According to the calculation results of Local Moran’s I (see Figure 4), the spatial correlation clustering results are high-high cluster (H-H), high-low cluster (H-L), low-high cluster (L-H), and low-low cluster (L-L). The coupling coordination in each region is imbalanced, with noticeable differences between the southeast and northwest regions. And the coupling coordination degree clustering types of TD, ST, and EE change from H-H in the eastern coast and H-L around Sichuan in 2005 to H-H in the Yangtze River Delta and L-L in the Chinese northwest in 2020, showing the difference in the overall coordination level between the eastern and northwest regions is increased. In addition, the disappearance of the H-L around Sichuan is manifested by the gradual reduction of the differences between the surrounding areas. The result is consistent with the situation of the low coordination degree in the northwest and the high coordination degree in the southeast, also consistent with the current situation of the high-technology and rapid-economic-developed eastern region and the slow-developed western region.

LISA significant level diagram of coupling and coordination degree of TD, ST, and EE.
Analysis of Coupled and Coordinated Development Prediction
In order to further understand the changing trend of coupling coordination degree, this paper applies the gray prediction model GM (1,1) by taking the sequence of 30 regions in China from 2005 to 2020 as the original data and calculates the predicted coupling coordination degree in 2021 to 2026 and which is visualized by ArcGIS (shown in Figure 5). The predicted results show that in the next six years, there will be a stable growth trend of TD, ST, and EE in China, achieving a positive mutual effect, with most regions shifting toward the good, high-quality coordination type. It also calls for vigilance in the northeast regions and Hainan. More feasible measures should be taken to achieve the coordinated development of tourism, science and technology, and the environment. The tourism development, technology innovation, and transformation efficiency in the western regions, especially Qinghai and Ningxia, are at a low level compared with those in the eastern region. They have rich human and ecological tourism resources but do not take advantage of them. Those affect their level of coupling coordination. Perhaps they could engage in developing leisure tourism based on natural and human tourism resources.

Estimate coupling and coordination degree of TD, ST, and EE from 2021 to 2026.
Conclusions and Implications
Conclusions
There are significant correlations and interactions among TD, ST, and EE, which impact regional sustainable development. This research examines the dynamic changes in the degree of coupling coordination of TD, ST, and EE in 30 regions in China. The main findings are outlined below.
First, the results demonstrate that the comprehensive development level and coupling coordination degree exhibit an upward trend in 30 regions with regional differences, concentrated in the endangered and mild imbalance recession. There appears to be a large space for optimization. The increase in the comprehensive development level and in the degree of coupling coordination in all regions is probably related to the change in the industrial structure and investment, which is dominated by heavy industry before (Xie et al., 2021; Yuan et al., 2022). Therefore, it can be inferred that modifications in industrial structure and economic growth can foster the growth of tourism and technical innovation. This study also reveals that, despite the fact that the east region has higher levels of coupling and coordination than the west, the central and western regions have experienced significantly larger growth in recent years. Probably due to the development of the tourism economy, the late implementation of policies, and the greater scope for growth in tourism demand and markets, the coupling coordination has increased much more in the central and western regions than the eastern in recent years.
Secondly, the results confirm the existence of high coupling and low coordination in the three subsystems, which are mainly affected by the lag of tourism development and technological innovation. The high coupling state indicates a significant interaction between TD, ST, and EE, while the early awareness of the interaction relationship is low, and thus the degree of coordinated development is low. Existing research showed that the level of tourism development is relatively backward among economic development, urbanization, and the ecological environment (Fei et al., 2021; Xie et al., 2021). While this paper shows that, in comparison to the level of the ecological environment in 30 regions, tourism and technological innovation need to be improved further. Additionally, in 30 regions, more than 80% are technologically lagging. This serves as a warning that attention should be made to the degree of tourism and science and technology innovation in the context of environmental protection, particularly to the enhancement of technological innovation. Furthermore, the previous papers inferred that the most critical challenges for technology in tourism development are “lack of technical maturity and interoperability” (Erol et al., 2022). This paper discovers that some regions may face similar issues in synergistic development. For example, despite abundant tourism resources and markets, convenient transportation, and developed economies, Beijing, Jiangsu, and Guangdong are lagging in tourism, which is the level of tourism development is relatively low compared to technological innovation. This situation may also be related to the extent to which their technological products are used in the tourism market. Therefore, these regions have not yet achieved the simultaneous development of technology and tourism. In addition, the lagging type indicates that the ecological environment is at a higher level, probably as a result of the early promotion of environmental protection policies and consciousness. So, the level of tourism or technology lags behind the improvement and development of the ecological environment.
Thirdly, further analysis reveals that the coupling coordination is increasing from northwest to southeast, showing a moderate imbalance in the northwest and a relatively stable development situation in the southeast. This result validates previous research findings. Previous studies have focused on the coupling and coordination of tourism between economic development, urbanization, and the ecological environment, indicating the clear north-south and east-west differences among these subsystems (Tang & Luo, 2022; Kong et al., 2021). The paper then provides additional evidence that there is an obvious southeast-northwest difference among TD, ST, and EE. One of the most significant discoveries is that not all the levels of coupling coordination in eastern regions are at the top; some of them are at the tail in a moderate imbalance state. Maybe these regions have paid attention to environmental protection, but ignored developing tourism and technology innovation. However, only the enhancement of the ecological environment cannot positively influence the development of the other two subsystems. Thus, they must strengthen the positive interaction among TD, ST, and EE.
Finally, previous research predicted that the coupling degree of TD and EE would enter the running-in stage of coupling degree in 2021 and the extreme coordination stage in 2023 (Kong et al., 2021), and that there were clear coupling characteristics between tourism and the ecological environment (Shen, 2020). However, this study finds that it will take a long time for TD, ST, and EE to develop harmoniously after the involvement of science and technology innovation subsystems. With the exception of the impact of unforeseen circumstances, the coupling coordination degree of the three subsystems in 30 regions of China will maintain its increasing trend in 2021 to 2026. After 2026, the coupling degree of the eastern and central regions is above 0.6, which will change to a good coupling coordination state. Some regions, including the Northeast region, Hainan, and Ningxia, need to pay more attention to improving the coupling coordination among the three subsystems. Otherwise, they will continue to run the risk of moderate imbalance and extreme recession in the future. Maybe the rapid development of the economy can also provide high-quality support for tourism and technological innovation in the developed regions, while these regions lack the funds to provide the infrastructure they need in their development process. Hence, they must transform and develop emerging industries to improve their infrastructure.
Implications
Few studies have combined the TD, ST, and EE subsystems into a single research framework and investigated their coupling relationships. In this paper, a comprehensive evaluation index system model of TD, ST, and EE is constructed to quantitatively compare the coupled and coordinated development levels of TD, ST, and EE subsystems in 30 regions of eastern, northeastern, central, and western China. The findings contribute to a better understanding of the coupling development mode and spatial-temporal evolution law of TD, ST, and EE, and expand the scope of tourism coupling research. Furthermore, it confirms earlier conclusions and offers a fresh viewpoint and empirical foundation for future studies on the direction of the interaction between tourism and technological development in the context of industrial synergism.
In terms of practical implications, the development status warns that in the time of big data, we must accelerate the integration of tourism, scientific and technological innovation, and the ecological environment. Furthermore, the results may help to equalize the regional development level further and improve the coordination degree between tourism development, scientific and technological innovation, and the ecological environment in China. The results predict the coupling degree of TD, ST, and EE and provide a theoretical reference for government management and future work plans. The guideline has improved their industrial development structure and effectively promotes sustainable development. The differences among regions of coupling coordination level and infrastructure should be taken into consideration when formulating future plans for TD, ST, and EE sustainable development. Regions with good Infrastructure, high-quality innovation environment, tourism market and passenger flow, and economic support, such as Guangdong, Jiangsu, and Zhejiang, have a high coordination degree and should adopt an expansion strategy and maintain their strengths. They should enhance the application of technological products in the field of tourism and ecology and environment and build a tourism technology platform to support the development of TD, ST, and EE. Areas with moderate imbalances, such as Ningxia and Hainan, must actively use ecological and human resources to optimize the industrial structure and shift from an industry-led development model to emerging industries such as tourism, science and technology, and others. Moreover, regions such as Hunan and Hubei, which are primary coupling coordination, should make efficient use of the existing resources to enhance their critical competitiveness, guide cooperation with neighboring regions, and increase agglomeration capacity.
Due to the limited statistical data acquisition, this paper has the following two limitations. First, the research data coverage needs to be expanded. The data of Tibet and Hong Kong, Macao, and Taiwan is missing and cannot be obtained through the interpolation method. Second, the construction of a comprehensive evaluation index system model needs to be improved. In future studies, more indicators in TD, ST, and EE can be added to optimize the model. Several interesting questions are left unexplored in the present study, which can guide future research on the coordinated development of TD, ST, and EE. When some indicators, such as smart tourism attractions, are available for measurement, indicators of the technological-tourism could be regarded as one new measurement construct. Future studies can also explore the coupled coordination mechanisms within subsystems and use regression models to examine the influences that lead to variation and change within systems. Alternatively, identified significant factors and relationships can be changed if a different sort of region or city is sampled; future research could also consider how the relationships might vary and differ in different areas. What distinguishes major tourist cities from regular cities in terms of TD, ST, and EE coupling relationships? What role does tourism play in the coordination development of tourism, science and technology, and ecology in major tourist cities? How to maximize the role of science and technology on tourism benefits within the carrying capacity of the ecological environment?
Footnotes
Acknowledgements
The authors declare that the paper is being submitted for consideration for publication in Sageopen and that the content has not been published elsewhere, in whole or in part, in any language. All authors have contributed significantly, and all authors are in agreement with the content of the manuscript.
Declaration of Conflicting Interests
The author(s) declared no potential conflicts of interest with respect to the research, authorship, and/or publication of this article.
Funding
The author(s) received no financial support for the research, authorship, and/or publication of this article.
Ethical Approval
Since all the data collected is second-hand data from the statistical yearbooks and official website, it is not applicable.