
Abstract
This study aims to analyze the impact of ownership structure on corporate capital structure, moderated by product market maturity. It employs a sample of 19950 firm-year observations for 1995 firms, which are listed companies on the A-Shares Board in Shanghai and Shenzhen stock exchange markets for the year 2011 to 2020. The data were analyzed using fixed effect regression. A two-step system GMM was used for the robustness test. Results suggested that state and institutional ownership negatively affect the firm’s leverage, which supports the resource-based theory. Furthermore, this study revealed that the negative effect of state ownership and institutional ownership on leverage diminished when firms are located in provinces with more matured product markets. These findings have important implications for the Chinese government in terms of developing and enforcing capital structure regulations to promote de-leverage.
Plain Language Summary
This study aims to analyze the impact of ownership structure on corporate capital structure, moderated by product market maturity. It employs a sample of 19950 firm-year observations for 1995 firms, which are listed companies on the A-Shares Board in Shanghai and Shenzhen stock exchange markets for the year 2011 to 2020. The data were analyzed using fixed effect regression. A two-step system GMM was used for the robustness test. Results suggested that state and institutional ownership negatively affect the firm’s leverage, which supports the resource-based theory. Furthermore, this study revealed that the negative effect of state ownership and institutional ownership on leverage diminished when firms are located in provinces with more matured product markets. These findings have important implications for the Chinese government in terms of developing and enforcing capital structure regulations to promote de-leverage.
Keywords
Introduction
China is currently struggling with the effects of high leverage (Dong et al., 2021; Wang et al., 2019), and this issue has become more prominent (Feng et al., 2021) for non-financial firms. The Bank for International Settlements (BIS) indicated that the non-financial firms’ leverage ratio increased dramatically from 95.2% in 2008 to 152.8% in 2021, and the ratio reached its peak at 160.8% in 2020. During the same period, China’s non-financial firms’ leverage ratio increased significantly faster than the average of developed economies, such as US and Japan and the average of emerging market economies.
The high level of debt could raise the cost of debt and potentially raise the risk of bankruptcy. Moreover, companies with higher leverage are more prone to default when under persistent financial strain, which could cause panic or even disruption in the financial market (Dong et al., 2021). Thus, one of the Chinese economy’s top priorities in recent decades has been preventing and controlling significant financial risks (Dong et al., 2021). In the report of the 19th National Congress of the Communist Party of China (CPC), the de-leverage strategy of China’s supply-side structural reform was to reduce the non-financial firm’s leverage level. The aim was to reduce the current debt ratio to a reasonable level to prevent financial risks (Wang, 2017). Subsequently, the state has introduced relevant stringent regulations. For instance, the “Three Red Lines” policy was introduced in 2020 to regulate the real estate industry to fully reflect the companies’ unreasonable capital structure and high leverage (Gao, 2021).
State and institutional shareholders are unique in China and they play a crucial role in the country’s economy (Xiao, 2005; Xiao & Zou, 2008). China has a largely state-controlled economy (Wang et al., 2019), and the government is a major player in corporate financing (Huang et al., 2018). Some firms with state and institutional ownership have priority access to valuable resources, including internal financial capital (Cui & Jiang, 2012). In this context, companies would have more internal financial resources and have lesser need for external financing, resulting in low leverage. Moreover, there are considerable inequalities in the distribution of resources among Mainland China’s 31 provinces, with some regions receiving numerous resources while others do not (Wan et al., 2021). These regional variations significantly impact how corporations finance themselves (Chen, 2015; Wang et al., 2020; Xiao, 2009).
Before 1978, China’s marketplace was controlled by state-owned enterprises (SOEs), with the government controlling the objectives of production, the regulation of price, and the allocation of resources to manage the national economy (Jiang et al., 2015). However, in the 1980s, there were a number of changes. First, the restrictions on price were lifted; second, free trade and foreign investment were allowed, and third, entry barriers for non-state companies were lowered (Lin & Liu, 2000). China’s accession to WTO further reduced the administrative obstacles and increased the exposure of businesses to international competition (Chen et al., 2014). The government has actively pursued policies to promote product market maturity, making it a crucial factor in economic behavior (Jiang et al., 2015). However, the level of product market maturity varies across Chinese provinces. Most developed regions are coastal cities, such as Guangdong and Zhejiang provinces, which have adopted an open-door policy. This results in the presence of constant entry of new competitors, the threat of substitutes, and the rapid renewal of products. These regions have implemented reforms for deepening marketization. High degree of marketization leads to high market-determined prices, low local protection, fairness, efficiency, and a more competitive market. Therefore, companies operating in different levels of product market maturity need to adapt their operational strategies to the changing institutional environment.
Despite the wide literature discussion of capital structure decisions, existing studies seldom analyze the impact of the institutional environment on capital structure (Wang et al., 2019), and have not considered indirect associations, such as the moderating effect, especially in China. Additionally, the majority of previous studies focus on identifying the influencing factors in a single country or multiple countries (La Rocca et al., 2010). Hence, research into inter-regional capital structures has received limited attention (Daskalakis et al., 2017; Wang et al., 2019).
This study presents empirical evidence on the relationship between ownership structure, product market maturity, and capital structure. There are four main contributions to this study. First, it enriches the literature on inter-regional capital structure by focusing on China, the most significant emerging economy. Second, more existing studies suggest a few gaps in the application of contingency theory in determining the environmental factors that affect organizational management (Robbins et al., 2014). This study provides further evidence for contingency theory, which explains how the institutional environment moderates corporate capital structure decisions. Third, most empirical research in developed countries typically uses trade-off theory or pecking order theory to explain capital structure decisions (Huang et al., 2018). Thus, this paper presents a novel theoretical perspective by using resource-based theory to explain the relationship between ownership structure and capital structure. This provides a valuable supplement to existing studies. Last but not least, the results evaluate the impact of product market maturity heterogeneity on the development and enforcement of capital structure regulations, providing insights for the government’s de-leverage policies from ownership and regional perspectives.
The following sections present the literature review, the hypotheses development, the research design, the results, as well as the conclusion of the study.
Literature Review and Hypotheses Development
Resource-Based Theory
The resource-based theory emphasizes the importance of an internal review of the variations in resource endowments across organizations (Barney, 1991; Wernerfelt, 1984), and explains why some firms in the same industry are successful while others are not (Widhiadnyana & Dwi Ratnadi, 2019). The internal strengths and weaknesses of the firm, not its external environment, determine its success or failure. Resource-based theory has two assumptions (Barney, 1991). First, companies have access to diverse resources even though they operate in the same industry. Resource heterogeneity determines that certain businesses are better at doing certain specific tasks because they have access to certain special resources (Peteraf & Barney, 2003). Second, the resource immobility assumption contends that it is difficult to trade resources across companies, which may cause the resource differences to persist (Barney & Hesterly, 2012).
In resource-based theory, resources are key constructs (Kozlenkova et al., 2014). Recent studies in the field of strategic management have divided firm resources into three categories: tangible, intangible, and human resources. A resource that is valuable, rare, imperfectly imitated, and non-substitutable contributes to a sustained advantage (Barney, 1995). Ownership structure can facilitate a company’s access to critical resources because the owners can determine the type of available resources a company has (He et al., 2016). In China, the government has a crucial role in controlling and allocating resources (He et al., 2016; Luo, 1995), and state ownership has played a role in helping businesses to access resources. Similarly, institutional investors are sophisticated investors who possess excellent resources, and have more capacities than others (Kim & Yi, 2015).
Contingency Theory
The concept of contingency theory implies that managerial decisions are influenced by features of the external environment in which the company operates (Jones & Jennifer, 2003). This suggests that to manage the firms effectively, managers should take into consideration environmental factors while making decisions (Daft, 2004). The essence of contingency theory is that organizational effectiveness comes from adapting the organization’s characteristics to the contingencies that reflect its situation (Burns & Stalker, 1961; Lawrence & Lorsch, 1967). Organizations should acquire new organizational features that match the new levels of contingencies, in order to avoid the misfit that emerges when the environment changes (Donaldson, 1987). Therefore, the organization is affected by the contingencies. To prevent organizational losses and remain sustainable, organizations should make adjustments over time to adapt to changing external environment.
The contingency theory is one of the essential theories related to organizational context and environment (Anwar, 2015). As part of organizational environment theory, companies have to consider the environment when making business decisions. In many corporate departments, including finance, managerial accounting, marketing, production, etc., the contingency theory significantly impacts managerial decision-making (Anwar, 2015). In particular, in finance, the contingency theory has been used in several financial decisions, including decisions on corporate financial planning (Li, 2014). The contingency theory requires firms to maintain good information exchange with the outside world in order to have proper financial planning and to sustain their growth (Li, 2014).
Nexus Between State Ownership and Leverage
Trade-off theory argues that debt usage is determined by trading off the costs and benefits of debt (Huang et al., 2018). The firms should select the optimal capital structure by maximizing interest tax shield minus the cost of debt, and gain the net debt benefits (Haddad & Lotfaliei, 2019). State-controlled banks are pressured to lend primarily to SOEs with little regard for their credit-worthiness (Allen et al., 2005). SOEs benefit from implicit or explicit loan guarantees, which let them borrow at cheap costs and reduce their risk of financial distress (Huang et al., 2018; Lim et al., 2015). Therefore, some studies (Alipour et al., 2015; Le & Tannous, 2016; Wang et al., 2019) suggest a positive impact of state ownership on leverage. Increased leverage provides firms with greater advantages through debt tax shields. However, it also entails higher risk associated with financial distress (De Haas et al., 2022). In the Chinese context, SOEs are risk averse as well as government-backed (Biglaiser et al., 2023; Zhang, 2022).
Pecking order theory prescribes that there is no optimal debt-to-equity ratio (Myers & Majluf, 1984). It suggests that companies prefer to use retained earnings first, then turn to debt and resort to equity financing only as a last option. However, the Chinese stock market is characterized by a government-controlled listing system that favors SOEs (Li et al., 2012), and this market friction undermines the applicability of pecking order theory (Gombola et al., 2019; Huang et al., 2018).
This paper is based on the resource-based theory, which proposes that certain companies are better at doing specific tasks because they have access to certain special resources (Peteraf & Barney, 2003). In China, the state is a medium of resources (Chen et al., 2014), and government involvement may enable SOEs to gain priority access to a variety of valuable resources, such as internal financial capital (Cui & Jiang, 2012). Firms with state ownership are given privileges and these companies have easy access to resources from the authorities (Green & Liu, 2005). In this context, firms with state ownership have more internal financial resources, and they do not need to rely on leverage, resulting in low leverage. Therefore, Hypothesis is proposed as follows:
H1: There is a negative relationship between state ownership and the firm’s leverage level.
Nexus Between Institutional Ownership and Leverage
Agency theory provides mixed results on capital structure. On the one hand, agency theory suggests that institutional ownership’s power has a negative impact on the leverage of institutional shareholders. Specifically, institutional investors have enhanced incentives and capabilities to closely monitor managerial behavior and reduce managerial opportunism (Jensen, 1986; Shleifer & Vishny, 1986; Sun et al., 2016). Institutional shareholders act as an additional monitoring instrument for the company’s operations (Agrawal & Mandelker, 1990; Grossman & Hart, 1980), and it tends to act as a management monitor (Short et al., 2002). Hence, external monitoring by the debt holders is not required, which results in lower agency costs (Zou & Xiao, 2006). On the other hand, the presence of institutional shareholders instills confidence in creditors, who believe that these firms can effectively monitor management’s actions and lower the risk of default (Sun et al., 2016). Thus, the involvement of institutional investors tend to result in higher use of leverage (Bajagai et al., 2018). However, prior research on the relationship between institutional ownership and leverage has failed to reveal a clear link between the two. Some studies (Ashbaugh-Skaife et al., 2006; Bhojraj & Sengupta, 2003; Dimitropoulos, 2014; Huang & Song, 2006) noted the positive impact of institutional ownership on capital structure. Conversely, some studies highlighted that the greater the institutional ownership, the lower the debt levels (Al-Najjar & Taylor, 2008; Xiao, 2004).
From the resource-based view, certain companies are better at doing specific tasks because they have access to special resources (Peteraf & Barney, 2003). Institutional investors are sophisticated investors with greater access to resources and possess higher capacities than other investors (Kim & Yi, 2015). They may provide companies with access to valuable resources, which includes internal financial capital (Fernández & Nieto, 2006; George et al., 2005). Institutional investors in China have short investment histories (Rong et al., 2017), and the majority of Chinese institutional investors are financial companies, such as investment companies, banks, and insurance companies. They are ready to offer funding to assist the companies (Lin & Fu, 2017). Therefore, this study argues that companies with institutional ownership may have easier access to internal financial resources, and are less likely to need external funding, which contributes to reducing leverage. Thus, this study hypothesizes that:
H2: There is a negative relationship between institutional ownership and the firm’s leverage level.
Moderating Role of Product Market Maturity
Previous studies demonstrate how the product market influences corporate decisions, such as financing decisions (Boubaker et al., 2018; Xu, 2012). Normally, matured product markets are characterized by fairness and competitiveness. Competition is typically a key component of an innovation process in developed economies with higher levels of market competition (Chen et al., 2014). When faced with competition, companies constantly look for innovative methods to improve product quality and to reduce costs (Do et al., 2022). Product market competition stimulates firms to engage in innovative activities to meet changing consumer needs and market trends, which helps firms to survive (Bena & Garlappi, 2019; Mukoyama, 2003). In this situation, firms facing fierce competition select a high debt ratio (Li et al., 2010). Similarly, Li and Wang (2017), Su and Sun (2011), as well as Yang and Kong (2010) also found a positive relationship between product market maturity and leverage.
According to the contingency theory, managerial financial decisions are influenced by the external environment in which the company operates (Jones & Jennifer, 2003; Wang et al., 2021). Managerial decisions are seen as making adjustments over time to adapt to the changing external environment, in order to have proper financial planning to sustain their growth (Anwar, 2015; Li, 2014). In China, product market maturity stimulates companies to innovate more actively in order to remain sustainable (Mukoyama, 2003). Essentially, most SOEs and institutional investors are characterized by inefficiency and a lack of innovation (Boeing et al., 2016; Chen et al., 2014; Rong et al., 2017). However, survival pressure incentivizes all companies to improve production efficiency and product quality (Chen et al., 2014; Do et al., 2022). Excessive rely on internal financial resources reduce the efficiency of using funds. Consequently, companies need to obtain external financing for product innovation under the pressure of matured product markets, which leads to an increase in the firms’ leverage.
Additionally, in competitive industries, information leakage has negative effects (Verrecchia, 1983). Banks do not demand much information from the company, thus, protecting the privacy of confidential information. In addition, banks have the ability to assess creditors without leakage sensitive information about the firm (Yosha, 1995). Therefore, companies under greater competitive pressure tend to benefit more from bank debt financing (Boubaker et al., 2018), resulting in high leverage. Hence, Hypotheses and 4 are as follows:
H3: Product market maturity mitigates the negative relationship between state ownership and the firm’s leverage level.
H4: Product market maturity mitigates the negative relationship between institutional ownership and the firm’s leverage level.
Research Design
Sample and Data
This study uses secondary data and a sample comprising of listed companies on the A-shares board in Shanghai and Shenzhen stock exchange markets for the years 2011 to 2020. The sample data about ownership structure is sourced from China Stock Market and Accounting Research Database (CSMAR). Meanwhile, institutional environment data is sourced from China Market Index Database. This database provides a standard index with several indicators that measure the level of institutional development of each Chinese province or provincial municipal city (Chen et al., 2014).
There were a total of 2,343 listed companies on the A-shares board in Shanghai and Shenzhen stock exchange markets on 31st December 2011. However, financial firms’ debt is not directly comparable to non-financial companies’ debt (Rajan & Zingales, 1995). Hence, this study excludes the financial industry from the sample. Furthermore, based on the rules established by China Securities Regulatory Commission (CSRC), a listed company is classified as a special treatment (ST) company if it reports net losses for two consecutive years, and *ST company if it does so for three consecutive years. Furthermore, an *ST company will be delisted if the losses continue for another year. Thus, the sample also excludes ST and *ST type companies, which is consistent with Liu et al. (2018). Moreover, it also does not consider some listed companies with incomplete or relevant data that could not be acquired. The final sample of this study has 19950 firm-year observations from 1995 firms. The sample description is shown in Table 1.
Sample Description.

Selection of Variables
The dependent variable in this study is capital structure. Following prior studies, the study uses leverage as a proxy to measure capital structure (Chow et al., 2018). Leverage is measured as the proportion of the book value of total debt to the book value of total assets (Amin et al., 2022; Wang et al., 2019). In order to determine the effect of ownership structure, the study uses state and institutional ownership. Following Feng et al. (2020), Le and Tannous (2016), as well as Zaid et al. (2020), state ownership (STATE) is defined as the ratio of shareholding of the state shareholders to the total shares in this study. Institutional ownership is defined as the shareholding of institutional investors divided by the total number of shares (Bajagai et al., 2018; Dimitropoulos, 2014).
This study uses a proxy for province-level product market maturity in China, which is consistent with studies by Duan et al. (2012), Li et al. (2009), Liu et al. (2011), and Xiao (2009). The product market development index is used to measure product market maturity. The index is the mean of three sub-indicators: the extent to which prices are determined by the market, the extent of local protection in commodity markets, and the degree of product market competition. The higher the level of the index, the higher the degree of product market maturity. As pointed out by Gujarati (2003), the use of dummy variables in the analysis of moderating effects is a flexible tool that may be applied to a variety of interesting issues. Therefore, this study uses dummy variables as a proxy for product market maturity. If the index is larger than the mean ratio of all companies in the sample firms, it is assigned a value of 1, otherwise 0. Additionally, control variables include firm size, firm growth, tangibility, profitability, non-debt tax shields, board size, director independence, CEO duality and board meeting. This paper selects CEO duality as a non-quantitative control variable because firms that have CEO duality encounter agency problems and are regarded as riskier by lenders. Hence, they have less access to debt (Amin et al., 2022). The definitions of these variables are summarized in Table 2.
Summary of Variable Definition.

Regression Model
The study considers state ownership and institutional ownership as independent variables, which are used to examine whether they impact on capital structure. This study uses the panel regression analysis model to analyze the relationship between ownership structure and capital structure, while controlling for several firm-specific and board characteristics factors. The baseline regression model is presented in Equation 1 as follows:
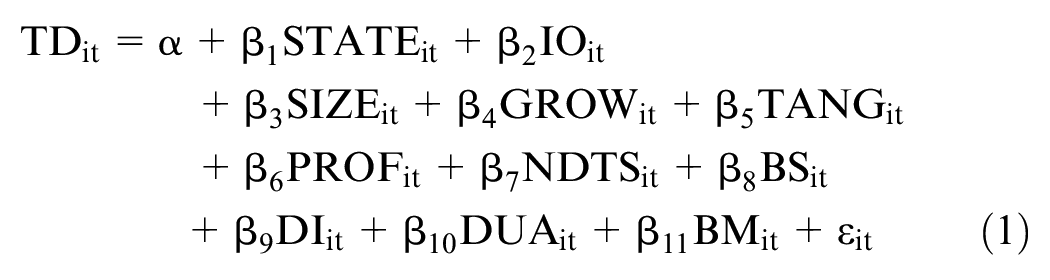
where α is constant term or intercept;
The analyses focus on the influence of ownership structure on capital structure in different regional environments. The moderator variable of this study is product market maturity (DPRO). In order to examine the moderation effect, the moderator variable is added to Equation 2 as follows:

where
Results
Descriptive Statistics
Table 3 reports the descriptive statistics for all variables in this study for 19,950 observations collected from 2011 to 2020. The mean value for leverage (TD) is 0.440, with the minimum being 0.007 and the maximum being 0.994. In addition, the standard deviation is 0.209, which shows that leverage fluctuates wildly among the firms. The average state ownership (STATE) is 0.034, and the standard deviation is 0.112, suggesting that state ownership is a non-trivial percentage in the sample firms. In addition, institutional ownership (IO), with a mean of 0.056, denotes that institutional investors are not dominating in the sample firms. This study uses a dummy variable to construct the interaction terms as a proxy for product market maturity (DPRO). The average DPRO for the sample is 0.687, with a standard deviation of 0.464, indicating considerable inequalities in the distribution of resources among Mainland China’s 31 provinces, resulting in different level of institutional development in each of the Chinese province.
Descriptive Statistics of Variables in this Study.
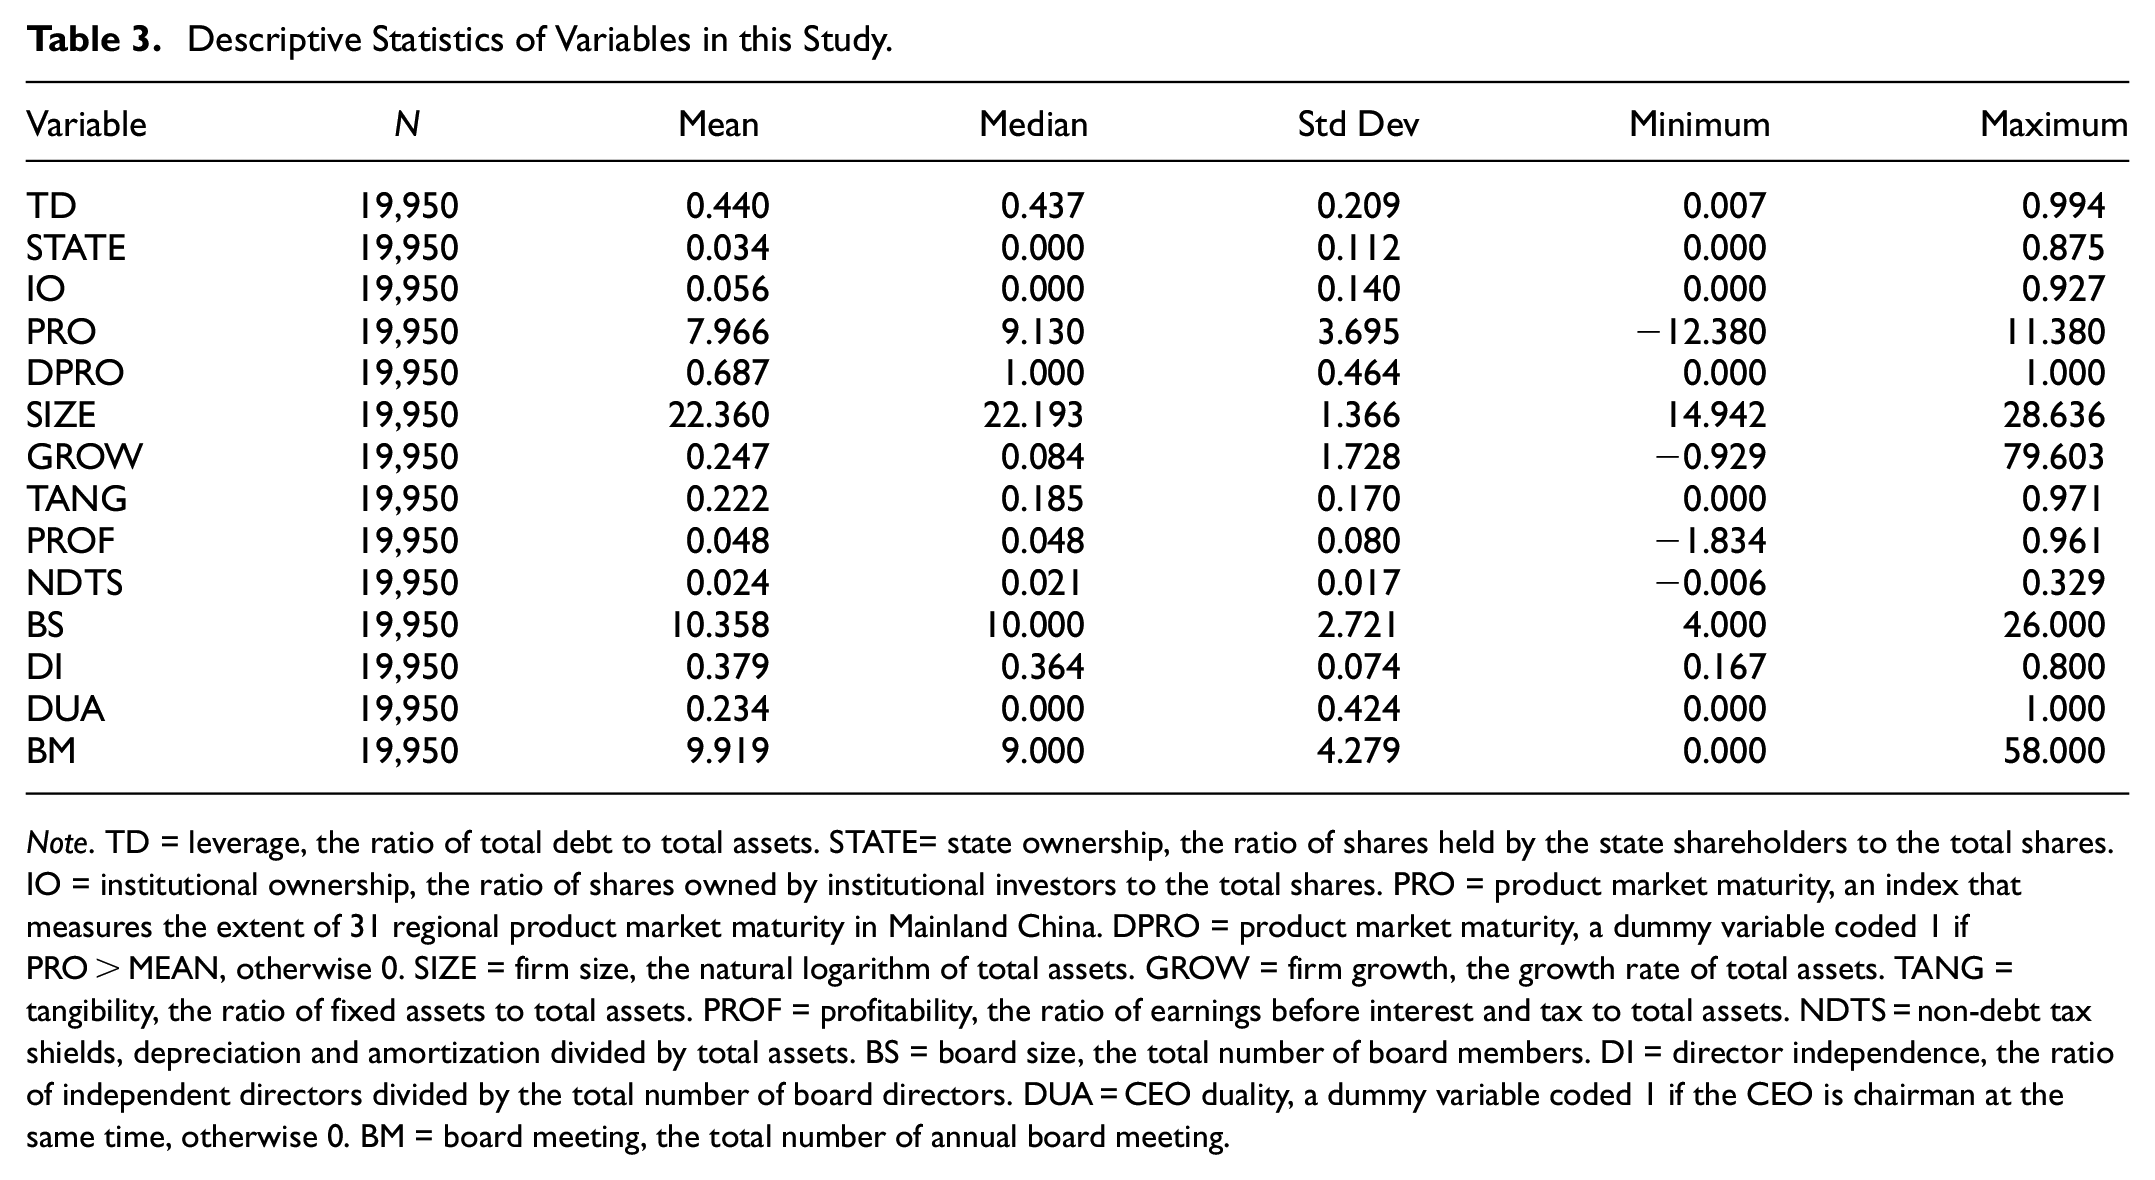
Note. TD = leverage, the ratio of total debt to total assets. STATE= state ownership, the ratio of shares held by the state shareholders to the total shares. IO = institutional ownership, the ratio of shares owned by institutional investors to the total shares. PRO = product market maturity, an index that measures the extent of 31 regional product market maturity in Mainland China. DPRO = product market maturity, a dummy variable coded 1 if PRO > MEAN, otherwise 0. SIZE = firm size, the natural logarithm of total assets. GROW = firm growth, the growth rate of total assets. TANG = tangibility, the ratio of fixed assets to total assets. PROF = profitability, the ratio of earnings before interest and tax to total assets. NDTS = non-debt tax shields, depreciation and amortization divided by total assets. BS = board size, the total number of board members. DI = director independence, the ratio of independent directors divided by the total number of board directors. DUA = CEO duality, a dummy variable coded 1 if the CEO is chairman at the same time, otherwise 0. BM = board meeting, the total number of annual board meeting.
Correlation Analysis
Pearson’s correlation was used to examine the relationship between variables in this study. Table 4 shows the Pearson correlation matrix for the sample variables. The main reason for the Pearson correlation test is to determine if there is a problem with multicollinearity between the independent variables. Gujarati (1995) contends that multicollinearity problems appear when the correlation between the independent variables is more than 0.8. The results in Table 4 show that the variables have correlation coefficients ranging from +.720 to −.177, which do not exceed the maximum limit of .8. Therefore, the results suggest that multicollinearity is not an issue in this study.
Correlation Matrix of the Pearson.

Note. TD = leverage, the ratio of total debt to total assets. PRO = product market maturity, an index that measures the extent of 31 regional product market maturity in Mainland China. DPRO = product market maturity, a dummy variable coded 1 if PRO > MEAN, otherwise 0. STATE= state ownership, the ratio of shares held by the state shareholders to the total shares. IO = institutional ownership, the ratio of shares owned by institutional investors to the total shares. SIZE = firm size, the natural logarithm of total assets. GROW = firm growth, the growth rate of total assets. TANG = tangibility, the ratio of fixed assets to total assets. PROF = profitability, the ratio of earnings before interest and tax to total assets. NDTS = non-debt tax shields, depreciation and amortization divided by total assets. BS = board size, the total number of board members. DI = director independence, the ratio of independent directors divided by the total number of board directors. DUA = CEO duality, a dummy variable coded 1 if the CEO is chairman at the same time, otherwise 0. BM = board meeting, the total number of annual board meeting.
significant at 1% level. **significant at 5% level. *significant at 10% level.
Surprisingly, leverage is positively associated with state ownership (0.094), indicating SOEs have higher borrowings than non-SOEs. On the contrary, leverage is negatively associated with institutional ownership (−0.103), which means that leverage level is lower when the firms have more institutional shareholders. Results of the moderator variable indicate that leverage is negatively associated with product market maturity (−0.028). In addition, leverage is also correlated with a variety of control variables. For example, leverage is positively associated with firm size, firm growth, tangibility, board size, and board meeting, but negatively correlated with profitability, non-debt tax shields, director independence, and CEO duality.
Regression Analysis
There are three methods for estimating panel data regression models, namely the Pooled Ordinary Least Square (POLS), the Fixed Effect Model (FEM), and the Random Effect Model (REM) (Gujarati, 2004). To develop a model that is appropriate for examining the links between ownership structure and capital structure, this study uses F-test, the Breusch Pagan Lagrangian multiplier (LM) test, and Hausman test. First, F-test was employed to choose the best model between the POLS and the FEM. The results revealed that the p-value of F-test was .00. Hence, the null hypothesis was rejected, suggesting that FEM was better than POLS. Second, the LM test was evaluated to determine whether the POLS or the REM was the best model. The results showed the p-value of LM test was .00. Since the null hypothesis was rejected, REM was chosen. Third, the Hausman test determined whether FEM or REM was the best estimator. The result of the Hausman test was 0.00, which meant FEM was superior to REM. Therefore, FEM was the best estimation model.
The results of the panel regression analyses are presented in Table 5. In Model 1, the result suggests that there is a negative relationship between state ownership (STATE) and leverage (TD), and this result supports H1, indicating that firms with state ownership have more internal financial resources and have lesser need for external financing, resulting in low leverage level. This result is consistent with the finding of Feng et al. (2020). Institutional ownership (IO) is found to associate negatively with leverage (TD), supporting H2, suggesting that institutional ownership allows the companies to have easier access to internal financing, and these companies are less likely to require outside funding, contributing to reduced leverage level. The findings of this study are similar to those of Al-Najjar and Taylor (2008) and Xiao (2004).
Regression Estimates of Ownership Structure and Capital Structure.

Note. DPRO = product market maturity, a dummy variable coded 1 if PRO > MEAN, otherwise 0. STATE= state ownership, the ratio of shares held by the state shareholders to the total shares. IO = institutional ownership, the ratio of shares owned by institutional investors to the total shares. SIZE = firm size, the natural logarithm of total assets. GROW = firm growth, the growth rate of total assets. TANG = tangibility, the ratio of fixed assets to total assets. PROF = profitability, the ratio of earnings before interest and tax to total assets. NDTS = non-debt tax shields, depreciation and amortization divided by total assets. BS = board size, the total number of board members. DI = director independence, the ratio of independent directors divided by the total number of board directors. DUA = CEO duality, a dummy variable coded 1 if the CEO is chairman at the same time, otherwise 0. BM = board meeting, the total number of annual board meeting.
Significant at 1% level. **Significant at 5% level. *Significant at 10% level.
This study uses product market maturity (DPRO) as a moderator variable to examine the moderating effect. Models 3 and 4 of Table 5 show the moderating effects of product market maturity on the relationship between ownership structure and leverage. In Model 3, the results show a positive interaction effect between product market maturity and state ownership (STATE×DPRO). This result is consistent with H3, which suggests that the negative effect of state ownership on leverage may diminish in regions with more matured product markets. Model 4 shows that the interaction between institutional ownership and product market maturity (IO×DPRO) has positive effect. This result supports H4, which reflects that institutional ownership’s negative effect on the firm’s leverage will be diminished in regions with more matured product markets. This study argues that survival pressure incentivizes companies to improve production efficiency (Chen et al., 2014). Therefore, firms cannot rely solely on internal resources, but should enhance the efficiency of leverage utilization to adapt to intense competition. These results are consistent with the findings of Li and Wang (2017).
Moving to control variables, firm size (SIZE) impact positively on leverage, suggesting that larger companies, with the higher level of diversification and lower level of bankruptcy risk, tend to have higher leverage. The same result is provided in Bajagai et al.’s (2018) study. Furthermore, firm growth (GROW) exerts a positive influence on leverage. This denotes that growth opportunities increase the value of a company, and increase the company’s debt capacity, which is consistent with Delcoure’s (2007) study. Additionally, tangibility (TANG) and leverage have a positive relationship, which is in line with Huang and Song’s (2006) finding. The results suggest that companies with more tangible assets can issue secured debt and can borrow more easily. Furthermore, the impact of profitability (PROF) on leverage is negative, indicating that profitable companies typically borrow less since they have enough money to support their operations (Zaid et al., 2020). For board size (BS), it has a negative relationship with leverage. This finding is consistent with prior studies, confirming that boards with greater expertise and size can improve their relationships with stakeholders, allowing them to increase their financial resources without depending on leverage (Dimitropoulos, 2014). Moreover, director independence (DI) correlates positively with leverage, suggesting that independent directors, perceived as effective internal control mechanisms, improve the firms’ access to external financing resources, which is consistent with Zaid et al.’s (2020) study. Finally, board meeting (BM) is positively related to leverage, indicating that the more board meeting, the higher the firm’s debt financing level.
Robustness Tests
Alternative Dependent Variable
Table 6 shows the results of regression analyses using an alternative dependent variable, in order to ensure stable results. More specifically, in terms of product market maturity, this study changed the dummy variable (DPRO) to product market maturity index (PRO), which is in line with Li et al. (2009). For the leverage, the ratio of total debt to total assets (TD) was replaced by the ratio of short-term debt to total assets (STD), which is consistent with Liu et al. (2011). The robustness test also uses the panel fixed effects model, adding year dummy variables. Consistent with those in Table 5, the findings show state and institutional ownership impact negatively on firm’s leverage. Similarly, the results show the moderating effect of product market maturity on the nexus.
Robustness Test With Product Market Maturity Index and Short-Term Debt to Total Assets.

Note. PRO = product market maturity, an index that measures the extent of 31 regional product market maturity in mainland Mainland China. STATE= state ownership, the ratio of shares held by the state shareholders to the total shares. IO = institutional ownership, the ratio of shares owned by institutional investors to the total shares. SIZE = firm size, the natural logarithm of total assets. GROW = firm growth, the growth rate of total assets. TANG = tangibility, the ratio of fixed assets to total assets. PROF = profitability, the ratio of earnings before interest and tax to total assets. NDTS = non-debt tax shields, depreciation and amortization divided by total assets. BS = board size, the total number of board members. DI = director independence, the ratio of independent directors divided by the total number of board directors. DUA = CEO duality, a dummy variable coded 1 if the CEO is chairman at the same time, otherwise 0. BM = board meeting, the total number of annual board meeting.
Significant at 1% level. **Significant at 5% level. *Significant at 10% level.
Endogeneity Problems
As Brown et al. (2011) point out, endogeneity could be a severe problem in the interaction between corporate governance and other accounting and financial issues. Due to the fact that the static fixed effects model is biased when there is a significant dynamic relationship between a current dependent variable and future independent variables, the dynamic GMM estimator is recommended (Wintoki et al., 2012). Table 7 shows the results of the two-step system GMM. The results are compatible with those of the FE result, as reported in Table 5.
Regression Estimates of Two-Step System GMM.
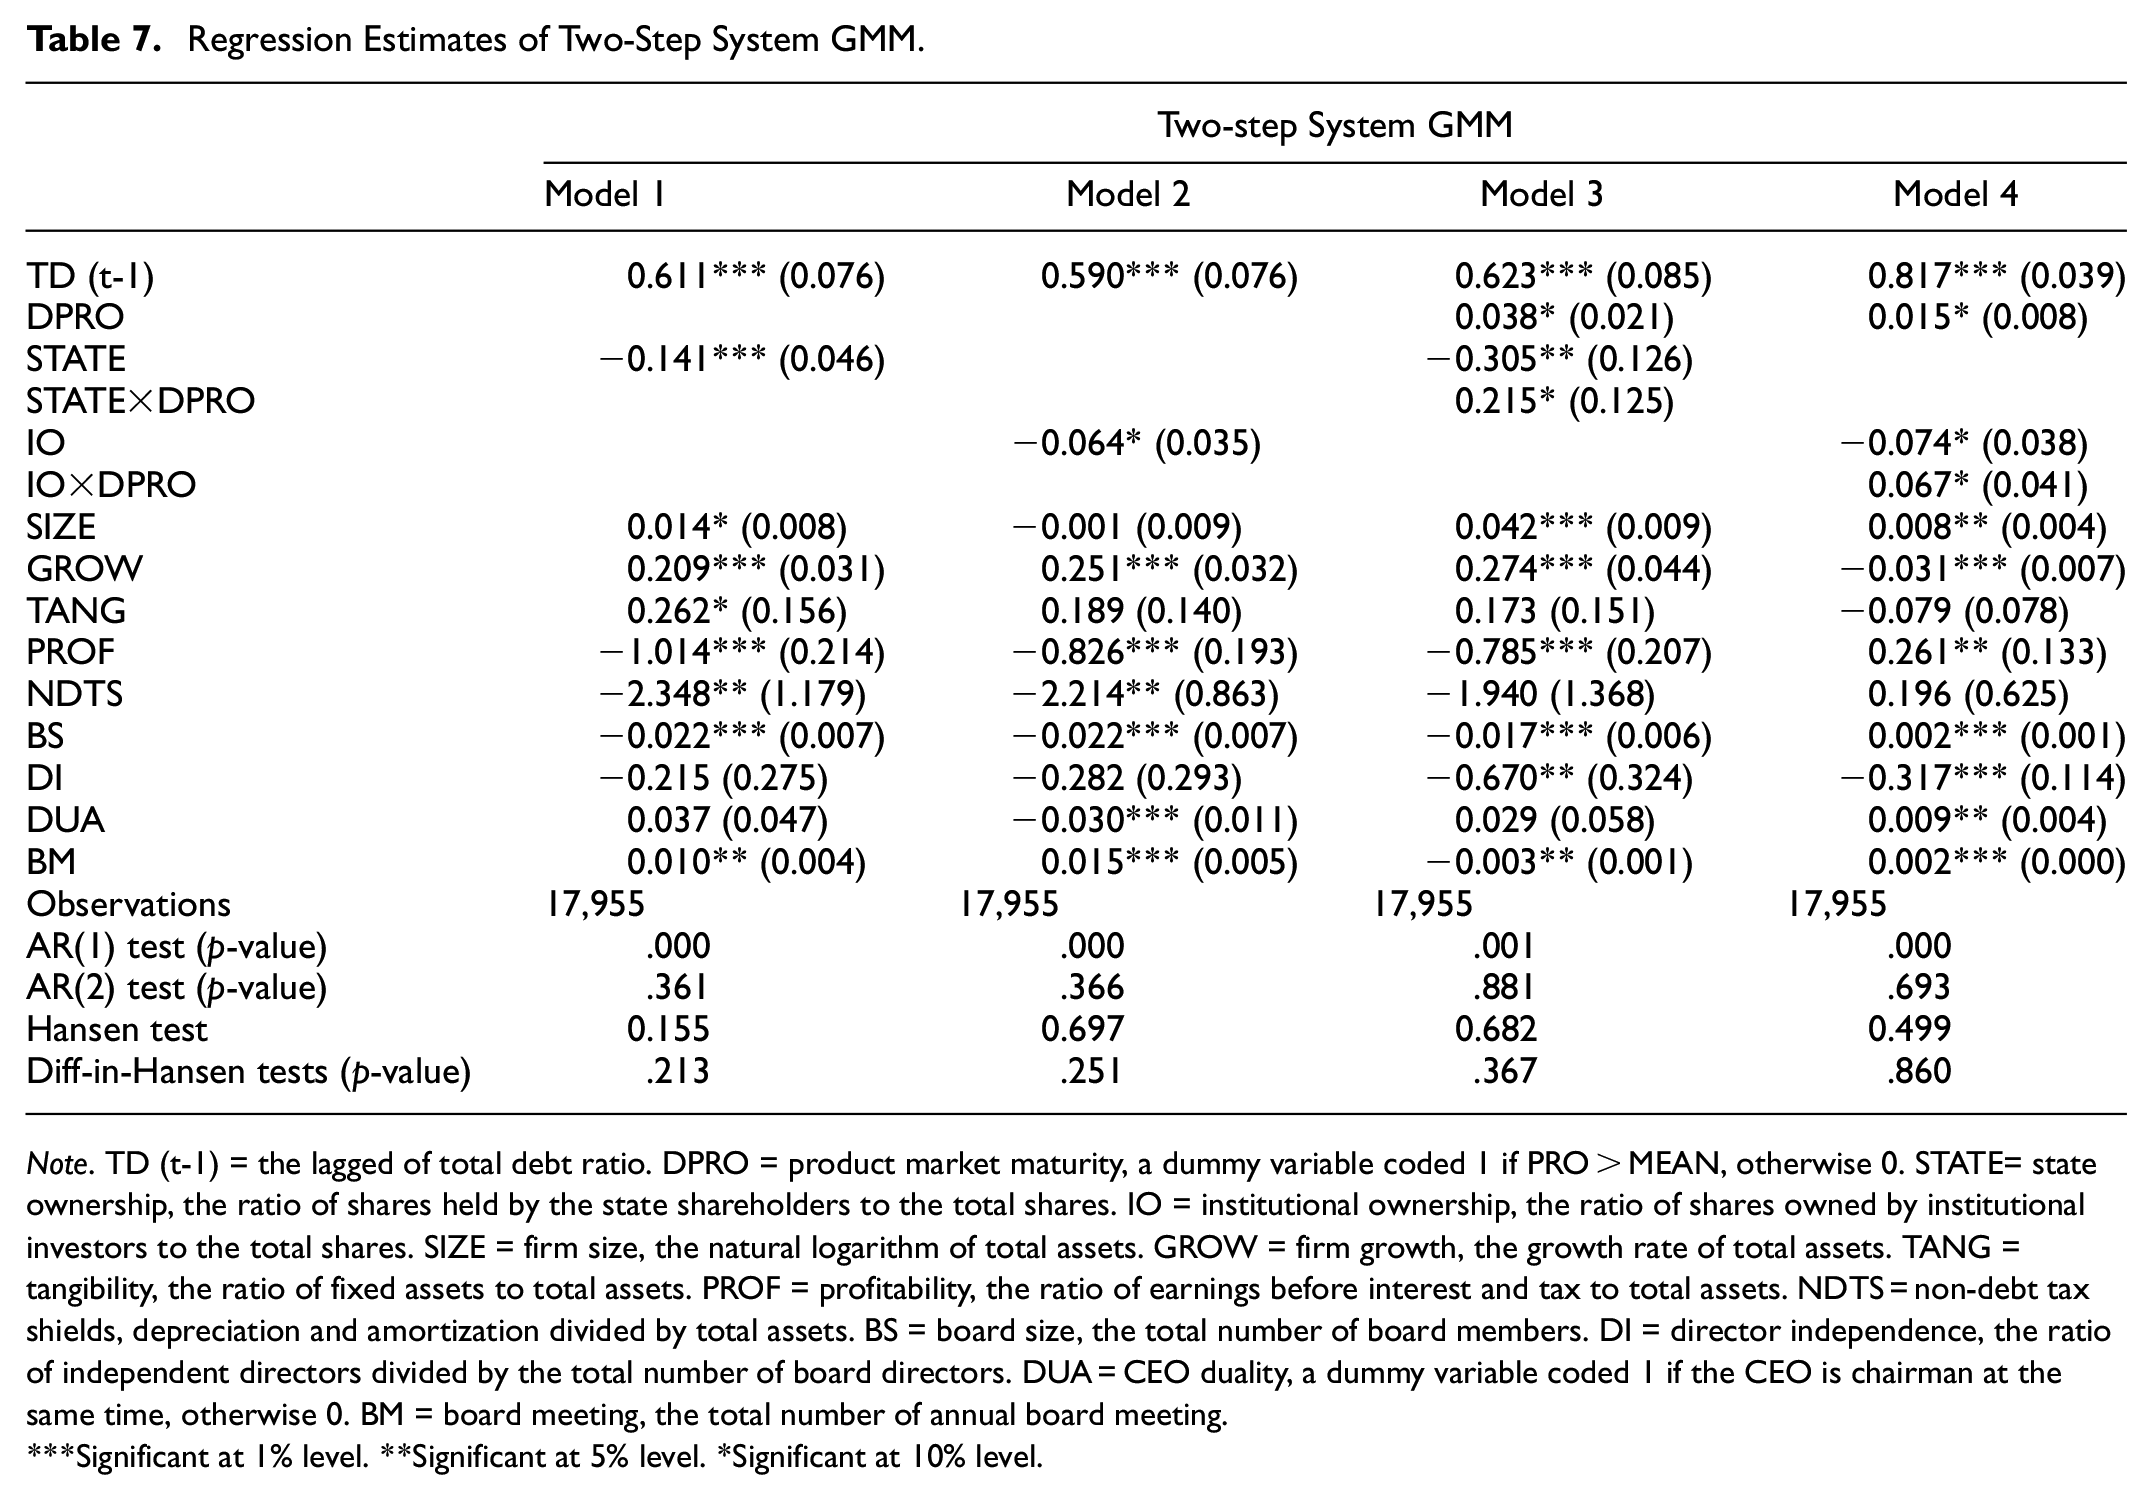
Note. TD (t-1) = the lagged of total debt ratio. DPRO = product market maturity, a dummy variable coded 1 if PRO > MEAN, otherwise 0. STATE= state ownership, the ratio of shares held by the state shareholders to the total shares. IO = institutional ownership, the ratio of shares owned by institutional investors to the total shares. SIZE = firm size, the natural logarithm of total assets. GROW = firm growth, the growth rate of total assets. TANG = tangibility, the ratio of fixed assets to total assets. PROF = profitability, the ratio of earnings before interest and tax to total assets. NDTS = non-debt tax shields, depreciation and amortization divided by total assets. BS = board size, the total number of board members. DI = director independence, the ratio of independent directors divided by the total number of board directors. DUA = CEO duality, a dummy variable coded 1 if the CEO is chairman at the same time, otherwise 0. BM = board meeting, the total number of annual board meeting.
Significant at 1% level. **Significant at 5% level. *Significant at 10% level.
Conclusion
Based on the analyses in this study, it is clear that state ownership is negatively associated with a firm’s leverage. As expected, according to the resource-based theory, the government may enable firms with state ownership to gain priority access to a variety of valuable resources, such as internal financial capital (Cui & Jiang, 2012). Therefore, firms with state ownership have more internal financial resources and have lesser need for external financing, resulting in low leverage level. Additionally, consistent with the resource-based theory, institutional investors may provide companies with access to internal financial capital. This means they are less likely to require outside funding, which contributes to reduced leverage level (Fernández & Nieto, 2006; George et al., 2005).
In line with the contingency theory, the negative effect of state and institutional ownership on the firm’s leverage will be diminished in regions with more matured product markets. Following product market maturity, the external environment has now changed. Product market maturity stimulates companies to innovate more actively (Mukoyama, 2003). Survival pressure incentivizes all companies to improve production efficiency and product quality (Chen et al., 2014). However, excessive internal financial resources reduce the efficiency in the use of fund. Apart from that, companies under greater competitive pressure tend to benefit more from bank debt financing, due to the lowered information requirements from banks, which protects them from releasing private information to the public (Boubaker et al., 2018). In this context, companies need to make dramatic changes to operate in a developing environment, and should obtain financing from banks, thereby increasing the firm’s leverage level.
The findings of this study have important implications for the Chinese government. This paper shows that ownership structure has a positive impact on the deleveraging policy in China, contributing to the literature on the economic consequences of the policy at firm level. Additionally, the findings can assist companies in achieving an optimal capital structure. Specifically, in regions with matured product markets, firms with state and institutional ownership cannot solely rely on internal resources, but should enhance the efficiency of leverage utilization to adapt to intense competition. Meanwhile, the government could allocate additional resources to firms situated in regions with less matured product markets, in order to optimize resource allocation.
Like any other empirical study, this study has a few limitations. First, the study focuses only on the impact of ownership structure, that is, state and institutional ownership. Future research may include other ownership structures, such as ownership concentration and managerial ownership, which might impact capital structure. Second, this study do not consider the moderating effect of other external environmental factors in China, such as financial sector maturity. Hence, future studies may consider including these variables.
Footnotes
Declaration of Conflicting Interests
The author(s) declared no potential conflicts of interest with respect to the research, authorship, and/or publication of this article.
Funding
The author(s) disclosed receipt of the following financial support for the research, authorship, and/or publication of this article: This work was supported by the Ministry of Higher Education Malaysia (MOHE) under the Fundamental Research Grant Scheme (Project Code: FRGS/1/2020/SS01/USM/02/6). This research was conducted while the corresponding author, Char-Lee Lok was on sabbatical leave.