
Abstract
We examine the effect of regulatory capital and ownership structure on banks’ liquidity creation in emerging Asian economies. We find a positive association between regulatory capital and bank liquidity creation, which is consistent with the risk-absorption hypothesis. Bank size has a positive relation with liquidity creation, implying that large banks have more capacity to create liquidity as they enjoy more of the safety net provided by lenders of last resort in the event of crisis, the advantage of reputational benefit, and easier access to external market funding. The negative effect of the bank funding structure is that, as the subordinate debt is typically uninsured, higher funding costs lead banks to reduce liquidity creation. The results imply that an increase in interest rates worsens liquidity creation. For ownership structure, the results show the significance of the impact of ownership concentration on liquidity creation. Banking institutions having higher equity and higher concentration ownership leads to improved liquidity creation.
Keywords
Introduction
The subprime crisis of 2007 led to capital and liquidity shortfall in the banking system worldwide and became a huge risk to the global financial system. To restore the stability of the international financial system, the Basel III accord was proposed by the Basel Committee on Banking Supervision (BCBS), in December 2010, to make financial sector reforms in the areas of liquidity, capital, and credit risk. The Basel framework offered the first standardized agenda on regulatory capital requirements and was a reaction against increasing globalization and diverse capitalization in the banking industry (Tanda, 2015).
In 2008, the subprime financial crisis proved the Basel II provisions insufficient. An essential element of Basel III is the institution of liquidity risk as substantial item, distinct from the earlier risks recognized in Basel II. Basel III improves the requisite capital level with respect to risk-weighted assets, however the financial repercussions of this change are still not clear. Banks can improve their capital ratios, either by growing their capital levels or reducing their risk-weighted investments. A rise in capital level is perceived to be good deleveraging by regulators, whereas a decrease in risk-weighted investment is likely to have an adversarial effect if banks instantaneously reduce the credit supply, that is, decrease consumer and commercial loans, ultimately hindering their role as liquidity creators (Admati et al., 2018). Basel III also proposes two liquidity measures, the liquidity-coverage ratio (LCR) and net-stable-funding ratio (NSFR), to cope with the banking sector’s short- and long-run liquidity needs (BCBS, 2013). Banks create liquidity through financing long-run illiquid assets (i.e., loans) by short-run liquid obligations (i.e., deposits). They also generate off balance sheet liquidity through loan commitments and similar claims. Therefore, the question of how banks amend their liquidity creation in reaction to new capital regulations is critical and has genuine implications.
The literature reveals that banks’ capital and liquidity indicators are closely related, with bank capital either improving or hindering liquidity formation. Although the theory proposes causality from bank equity to liquidity formation, in reality, both could be mutually determined. The debate about the relationship between equity requirements and liquidity creation is summarized by Berger and Bouwman (2009), in two competing views, the “financial-fragility/crowding-out” and “risk-absorption” hypotheses. The financial-fragility/crowding-out proposition forecasts the impact of regulatory capital on liquidity to be negative, as high levels of capital are either linked with reduced monitoring, which leads to low liquidity formation, or high capital ratios crowding out deposits and decreasing liquidity formation. However, the influence of bank equity on liquidity formation is positive with respect to the risk-absorption proposition, as bank capital develops risk-taking ability.
The repeated crises of the past three decades have led to financial sector reforms by presenting new business practices with the conventional role of intermediation. The outcome of these developments has been banking sector consolidation with changes in patterns of ownership, particularly increased numbers of institutional investors. This transforms banks’ risk-taking activities and therefore hampers their role as liquidity creators (Barry et al., 2016). Empirical studies show that liquidity creation is influenced by ownership structure, because of the presence of significant agency problems between management and ownership. According to Gorton and Rosen (1995), entrenched management is apt to take on more risk in an impaired financial structure, consistent with the problem of moral hazard. In a situation of increasing expected competition, management which has enhanced evidence about the quality of portfolios has a greater chance of following a relaxed approach than investors who are likely to be enormously risk-taking ex-post. Thus, this study is an attempt to test the validity of the financial-fragility/crowding-out or risk-absorption hypotheses in the presence of the agency hypothesis.
Previous work provides substantial evidence of the relationships between liquidity formation and regulatory capital (Distinguin et al., 2013; Fu et al., 2016; Horváth et al., 2014; Xie, 2016), liquidity creation and economic growth (Berger & Sedunov, 2017), liquidity creation and government intervention (Berger et al., 2016), liquidity creation and bank governance (Díaz & Huang, 2017) liquidity, capital and risk (Mahdi & Abbes, 2018), and liquidity and credit risk (Hassan et al., 2019), as well as the cyclicality of liquidity creation (Davydov et al., 2018). There exists, however, no study that examines the combined effect of capital requirements and ownership structure on banks’ liquidity creation in emerging Asian economies. We consider the combined impact of regulatory capital requirements, along with ownership structure, on liquidity creation. We examine how liquidity changes with changes in regulatory capital under various ownership structures, to explore which ownership structures are more effective in preserving bank liquidity creation.
This study adds to the existing literature in many ways. First, we examine the relation between liquidity formation and regulatory capital by considering the liquidity indicators associated with the recent Basel III regulatory requirements, that is, the net stable funding ratio (NSFR) and liquidity creation indicator introduced by Berger and Bouwman (2009). Second, ownership structure is considered a factor of liquidity creation, and we examine how it moderates the relation between bank capital and liquidity. This is the first study, to the best of our knowledge, that considers the interaction effect of bank equity requirements on liquidity formation depending on ownership structure. Third, although Basel III was introduced after the subprime crisis of 2007, which largely effected Western nations, the regulatory reforms are not only meant to avoid financial crises, but to close gaps in regulatory frameworks worldwide. Throughout the global crisis, Asian economies and banks fared well in comparison to their developed Western counterparts (Batten, 2011). Hence, we add a crisis dummy that takes the value of 1 during the period 2008 to 2010 and 0 otherwise. We analyze this along with regulatory capital to test how bank capital effects liquidity creation in crisis periods in emerging Asian economies. Fourth, we add a Basel III dummy, taking the value of 1 from 2010 onward and 0 otherwise. We analyze this along with regulatory capital to test how bank capital effects liquidity formation after the introduction of Basel III.
The findings show a positive relationship between capital ratio and liquidity formation consistent with the risk-absorption hypothesis. Bank size and loan-to-deposit ratio have a positive relationship, while bank funding structure has a negative relationship with the liquidity indicator. The results imply that an increase in interest rates worsens liquidity creation. The findings also show a significant negative relationship between economic growth (gross domestic product [GDP]) and liquidity formation, which supports the argument that some financial institutions may act in an extremely lax way during economic booms. They do not consider the cyclic nature of economic growth and are hence inclined to undervalue risk. This lax behavior through times of economic growth hampers banks’ ability to create capital buffers and hence reduces liquidity creation. For ownership structure, the results show the significance of the effect of managerial owners and concentrated ownership structure on liquidity creation. Management ownership has a positive impact, while concentrated ownership has a negative impact on bank liquidity creation. Also, banks with high capital ratios and concentrated ownership structures tend to grow their liquidity creation.
The rest of the study is structured as follows. The literature review and empirical evidence is presented in section “Literature Review.” The selection of the sample and data collection sources are given in section “Data and Variables.” The methodological framework and empirical model are discussed in section “Method and Model.” Section “Results and Discussion” presents the results, and the conclusions are presented in the last section.
Literature Review
Modern financial intermediation theory explains the main roles performed by banks in the economy, that is, risk transformation and liquidity creation. Banks play a transformation role by accepting risk-free deposits and using them to supply risky lending. Banks create liquidity by financing long-run illiquid assets (i.e., loans) by short-run liquid obligations (i.e., deposits). Furthermore, they create off balance sheet liquidity by loan commitment and similar claims. Both functions coincide, so it is important to examine these functions to get an enhanced understanding of banks’ role in the modern financial system. Previous literature related to the banking sector mostly considers risk transformation, while the literature on banks’ liquidity role is scarce, but improving.
Capital Requirements and Liquidity Creation
Previous literature examining the association between capital requirements and liquidity formation is rare. The latest advancement in the literature is the pioneering study of Berger and Bouwman (2009) into the formation of liquidity reforms under Basel III (particularly, NSFR and LCR) (BCBS, 2010). Four liquidity measures are proposed by Berger and Bouwman (2009), built on loan type, maturity, and the decision to contain or omit off balance sheet items. The study uses U.S. banks over the period 1993 to 2003 as a sample, and the findings imply a positive association, between regulatory capital and liquidity formation for big banks, and a negative association for small banks. The findings suggest that high regulatory capital requirements under Basel III improve the liquidity formation of large banks more than smaller institutions.
Distinguin et al. (2013) employ simultaneous equation analysis to examine the relationship between capital requirements and liquidity indicators, measured through on balance sheet activities, using a sample of registered banks in the United States and Europe over the period 2000 to 2006. The findings show that regulatory capital and liquidity measures are closely related: high regulatory capital entails low liquidity formation and banks reduce regulatory capital to generate further liquidity. Horváth et al. (2014) use a dynamic panel generalized method of moments (GMM) estimator and perform Granger causality analysis with a Czech banking sector data set, comprising mostly small banks, over the period 2000 to 2010. Analogous to Distinguin et al. (2013), the findings of the study imply that bank capital has a negative impact on liquidity formation and high liquidity ratios lead to decreased bank equity. Fu et al. (2016) examine the link between regulatory capital and liquidity creation in a sample of 14 Asia-Pacific countries over the period 2005 to 2012. The findings are similar to Distinguin et al. (2013) and Horváth et al. (2014), implying a significant inverse bidirectional relationship between regulatory capital and bank liquidity. Fungáčová et al. (2017) investigate the effect of deposit insurance introduction on the relationship between equity requirements and liquidity formation in an emerging economy. The study shows that the deposit insurance system has a diverse effect on the link between equity requirements and liquidity formation, across various banking categories, and those with somewhat higher domestic deposit ratios are more likely to be affected. Deposit insurance moderates the effect of equity requirements on liquidity formation in case of Russian banks.
Recently, a number of studies emphasize the significance of banking sector contribution for liquidity formation and foreseeing economic crises. Berger and Sedunov (2017) find that liquidity formation directly relates to economic output, showing that both the on and off balance sheet liquidity indicators directly affect the economy. Similarly, Berger and Bouwman (2017) investigate the interaction between liquidity ratios, financial crises, and monetary policy. The study concludes, ceteris paribus, that higher liquidity indicators help to foresee crises, proposing that the system must observe banks’ role as liquidity creators to forecast and lessen the possibility of economic crises.
Tran et al. (2016) investigate the interrelationship between regulatory capital, liquidity formation, and profitability in the U.S. banking sector. The study shows that regulatory capital positively relates to liquidity creation, by keeping bank profitability constant, in the case of small banks in noncrisis periods. Banks showing high illiquidity risk results in low profitability and the relationship between regulatory capital and bank profitability is nonlinear and depends on capital level. Umar et al. (2017) examine the effect of variations in regulatory capital on bank liquidity using data for all Indian banks over the period 2000 to 2014. The results show that the financial fragility/crowding out proposition holds in case of narrow liquidity measure use and change in capital has no effect on broad liquidity measures. The risk-absorption proposition holds in the listed bank scenario before the crisis, where liquidity is measured by employing both on and off balance sheet activities. Casu et al. (2019) investigate the relationship between regulatory capital requirement and bank liquidity formation, employing simultaneous equation analysis, subsequent to Basel III’s implementation. The findings show a bidirectional negative relationship, which proposes that banks decrease liquidity as capital rises, and as liquidity rises, banks decrease capital ratios. Le (2019) finds a negative bidirectional relationship between equity requirements and liquidity formation in the Vietnamese banking sector from 2007 to 2015. The results show that banks’ off balance sheet actions play little part in liquidity creation measures. On the basis of the previous literature, the following hypothesis is tested in this study:
Ownership Structure and Liquidity Creation
In recent decades, the banking sector has been presented with serious challenges and repeated financial crises. Particularly, the crisis in 2007 reveals a convincing substantiation of how rapidly the liquidity in the system can dissolve and the subsequent shortage remain for an extended period of time. Liquidity problems arise in the early stages of crisis, even in institutions with sufficient capital ratios, and the BCBS has determined that the banking industry has been unsuccessful in following the basic moralities of liquidity management in periods of abundant liquidity (Bank of International Settlements [BIS], 2009). Financial deregulation and market integration have reformed banking sector activities resulting in banking sector consolidation and a change in the pattern of ownership, particularly an increased number of institutional investors (Barry et al., 2016).
Foreign ownership of banks in developing countries has been the focus of considerable academic interest, and the literature is divided into two arguments: one side backing the global advantage proposition and the other favoring the home-field advantage proposition. The first hypothesis predicts that foreign-owned banks are more efficient and profitable than domestic-owned banks (Bonin et al., 2005; Brown et al., 2009; Havrylchyk & Jurzyk, 2011; Laidroo, 2016). The reasons include easier access to capital markets, better capacity for risk diversification, and advanced technology for the collection and evaluation of “hard information” (Berger et al., 2005). The other strand of literature proposes the negative impact of foreign ownership on bank efficiency because of the domestic bank advantage, particularly in developing nations, such as easier access to “soft information” related to the native setting (Berger et al., 2003; Lensink & Naaborg, 2007). Previous literature has not, so far, produced decisive evidence for which proposition better fits the banking industry (Andries & Billon, 2010; Bonin et al., 2005).
The literature on bank ownership’s role in influencing liquidity risk is scant and far from conclusive. Brei and Schclarek (2015) take a theoretical view on the lending behavior of public and private banks, findings that private bank lending reduces to a greater extent than that of public banks, as public banks have more access to extra funding and usually do not undergo deposit withdrawal. Comparable findings are obtained by De Haas et al. (2012), Cull and Peria (2013), and Bertay et al. (2012). With reference to foreign versus local ownership, Vazquez and Federico (2015) find that small local banks are comparatively more exposed to liquidity risk during financial crisis, than larger foreign institutes which have better access to internal capital markets and stable financing bases. Conversely, Claessens and Van Horen (2014) and De Haas and Van Lelyveld (2014) state that domestic-owned banks are better insulated from financial crisis and have more stable lending activity than international banks. Mirza et al. (2019) examine the significance of firms’ management political ties on risk-taking in China and show that firms with more political relations are greater risk-takers than those with lesser political ties.
The role of the construction of bank ownership in risk-taking and performance has been the focus of research over the past few years (Barry et al., 2011; Busta et al., 2014; Dong et al., 2014; Hammami & Boubaker, 2015; Haw et al., 2010; Mukhopadhyay & Chakraborty, 2017; Oino, 2018; Saona & Azad, 2018; H. Vu & Nahm, 2013; M. C. Vu et al., 2018; Zheng et al., 2017). Reverchuk et al. (2013) investigate the efficiency of the banking sector in developing countries, before and during the period of the 2007 financial crisis, by employing cluster analysis. However, literature on the role of ownership structure in liquidity management is still disputed and scarce. Duqi and Al-Tamimi (2018) examine the impact of ownership type on regulatory capital ratios and liquidity risk, employing a data set from the Middle East and North Africa (MENA) region. The findings imply that foreign and private ownership show a strong inclination for high capital levels, while the role of government investors in liquidity risk remains indecisive. Furthermore, private ownership banks demonstrate low liquidity risk throughout the 2007 financial crisis, because of tight budgetary restrictions and more convincing liquidity requirements. On basis of this discussion, we formulate the following hypotheses:
Data and Variables
Data Sample
This study employs the Financial Times Stock Exchange (FTSE) Russell (2018) grouping of economies and emerging economies index of Morgan Stanley Capital International (MSCI) for the sample. These indexes are used to measure capital market performance in global emerging economies. Hence, the sample selected comprises the emerging Asian economies which are included in both indexes, that is, the FTSE and MSCI indexes of emerging economies.
The sample selected comprises seven emerging Asian economies, Pakistan, China, Indonesia, India, Thailand, Philippines, and Malaysia. The final sample includes the banks registered on the domestic stock exchanges and the data range is from 2004 to 2017. The sample starts from year 2004 because we have collected the regulatory capital and financial data of seven emerging economies from Standard & Poor’s Capital IQ database. This database contains the data of most of the selected countries and regulatory variables from year 2004. Also, Basel III is introduced in 2010 and we need the data both before and after Basel accord introduction time periods to investigate the new accord introduction effect. The criteria for selection of banks are that they must have sequential availability of 10 or more years’ of data and the availability of regulatory capital data throughout the period.
The regulatory capital ratios and financial data are collected from the selected countries’ banks’ financial reports and Standard & Poor’s Capital IQ database. The annual reports are used to collect ownership data. The World Bank development indicators database and International Monetary Fund are used for macroeconomic information. The study employs the secondary panel data set over the period 2004 to 2017.
Liquidity Creation Measures
The literature related to the banking sector reveals that the majority of studies that examine liquidity creation use ratios calculated from accounting data. But employing such liquidity indicators can be incorrect in certain situations. Consequently, the current study uses two liquidity measures, the first measure being dependent on the regulatory reforms suggested by the BCBS. Besides the various policies, Basel III proposes the use of the NSFR, which creates resilience in the long run by generating extra benefits to finance bank operations with secure sources of funding on a continuous basis (BIS, 2009; Hossain et al., 2018). The NSFR indicator is the ratio of the existing amount of secure funds to the requisite quantity of secure funds. The existing quantity of established funds is the sum of an institution’s equity, debts with a useful life of one or more years, part of the “stable” demand deposits (i.e., short-term funds with less than 1 year maturity that are likely to “stay” in the institution), and of term deposits with less than 1 year maturity that are likely to “stay” in the institution. The requisite quantity of funds is aggregate of specific assets that may not be monetized by sale or utilized as guarantee for safe borrowing throughout a liquidity episode which lasts 1 year. The higher the requisite quantity of stable funds, compared with the existing quantity of stable funds, the more illiquid the bank is believed to be (BIS, 2009). The reciprocal of net stable funds (INSFR) is the ratio of the requisite quantity of stable funds to the available quantity of stable funds. The inverse of the NSFR is calculated as:
= “0 * (cash + interbank assets + short-term marketable assets) + 0.5 * (long-term marketable assets + customer acceptances) + 0.85 * consumer loans + 1 * (commercial loans + other loans + other assets + fixed assets) / 0.7 * (demand deposits + saving deposits) + 0 * (short-term market debt + other short-term liabilities) + 1 * (long-term liabilities + equity).”
The second proxy for liquidity is the narrowed liquidity measure (LCI) given by Berger and Bouwman (2009) that only includes balance sheet items. To calculate this variable, first, all liabilities and assets are categorized as liquid, semiliquid or illiquid with reference to type and maturity. Second, every asset and liability factor is weighted. The liquidity creation indicator (LCI) is computed as:
A high liquidity measure (LCI) shows more liquidity creation in the system and poses banks to accumulation of illiquid investments, since banks put additional liquid liabilities (i.e., deposits) into illiquid assets (i.e., bank loans). To conform with the liquidity creation indicator (LCI), this study considers the reciprocal of the net stable funding ratio (INSFR) as a liquidity indicator (BIS, 2009). A high value of both determinants indicates the more liquidity formation in the system, which means the highly illiquid bank assets that is, investments in bank loans. High illiquidity means that banks put extra liquid debts into illiquid assets, which leads to an increase in bank liquidity creation.
The detail of the variables employed in the study are presented in Table 1.
Description of Variables.

The bank-specific variables are the size, bank market power, subordinate debt ratio (SDR), loan loss provision ratio, profitability, and price-to-book value (PBV). Bank size is included as a control variable in the study, because the previous studies find mixed evidence regarding its impact on bank liquidity creation. Distinguin et al. (2013) find a positive relationship between bank size and liquidity creation, as the large banks have more capacity to create liquidity and enjoy more of the safety net provided by lenders of last resort in the event of crisis. Other studies find a negative relation between bank size and liquidity creation implying that small banks generate more liquidity per asset than large banks (Fu et al., 2016; Horváth et al., 2014). The literature also shows that market competition (i.e., low bank market power) is a significant determinant of bank liquidity creation, but the effect is vague (Berger et al., 2016; Horváth et al., 2014). On one hand, high competition (or low bank market power) leads to more liquidity creation as banks offer more exciting terms to their customers, but on the other, the “financial fragility view” states that bank competition reduces liquidity, as the increase in competition leads to reduced profitability and motivates banks to decrease deposit activity and credit supply to avoid financial runs (Horváth et al., 2014). So, we include the market power as a measure of competition and regulatory pressure variable. The study also incorporates PBV and SDR as determinants of bank liquidity creation. We control for bank profitability by including return on equity in the model, as an increase in profits may impact bank capital positively, which in turn enhances liquidity creation (Flannery & Rangan, 2008; Gropp & Heider, 2010). This argument is in line with pecking-order theory, arguing that bank equity mostly relies on internal funds as external equity issuance is expensive.
Liquidity creation is also affected by the macroeconomic environments of countries, so we control for macroeconomic factors using the annual growth of gross domestic product, inflation, domestic credit to the private sector, and monitory policy indicators. We expect a positive relationship between economic growth and liquidity creation, as, in an economic boom, the bank’s liquidity creation is improved (Distinguin et al., 2013). However, Ayuso et al. (2004) argue that the negative impact of economic growth on liquidity creation supports the argument that some financial institutions may act in an extremely lax way during economic booms. They do not consider the cyclic nature of economic growth and are hence inclined to undervalue risk. This lax behavior in periods of financial growth hinders banks from creating capital buffers and hence reduces liquidity creation. The literature reveals the positive relationship between inflation and liquidity creation, which means that as inflation in an economy surges, banks create further liquidity to restrain its effect in the economy (Singh & Sharma, 2016). We also incorporate central bank policy rate as a monetary policy indicator (MPI), as it may influence the liquidity creation in the system (Berger & Bouwman, 2017).
Method and Model
Estimation Techniques
This study uses the secondary panel data set for the time period 2004 to 2017. There are two types of panel methodology, static and dynamic, with dynamic panel models more suitable to address the problem of endogeneity bias. The causal linkage in the dynamic panel model is usually dynamic across time for a given phenomenon. Dynamic panel estimation techniques employ dependent variable lags as instruments in the model to avoid endogeneity bias (Ullah et al., 2018). Static models are classified by fixed or random effects, considering the individual effects as constants across time in both cases. This restriction limits the effectiveness of the static model for addressing the time varying dynamics or endogeneity issue. However, dynamic data techniques treat the problem of endogeneity within the model by the instrumental variables approach (Mileva, 2007).
The development of dynamic panel data analysis offers new prospects for endogenous variable examination. To address the endogeneity problem, two key methods are used in addition to conventional instrumental variable regression. The first technique, difference GMM, introduced in 1991 by Arellano and Bond (1991), uses the lags in difference as instruments. The second uses the lags in level and difference as instrumental variables and is called system GMM, developed by Arellano & Bover in 1995. System GMM has the option to perform investigation by two methods, depending on the assumptions of the weighting matrix variation, that is, one and two step methods. The literature shows that the two-step GMM methodology is useful when employing a heteroscedastic assumption in the analysis. The two main issues related to two-step GMM are the proliferation of instruments and autocorrelation of error terms (Labra & Torrecillas, 2018). Roodman (2009) undertakes a comprehensive analysis and suggests a mechanism for effectively checking for the presence of the overidentification problem. The number of cross sections should be higher than the number of instruments employed to avoid overidentification.
This study uses Arellano and Bover’s (1995) two-step dynamic panel system GMM technique, due to the endogeneity problem. The panel data used in this study contains a large number of cross sections (155 banks) and a short time period (14 years), which is the most common data type in the dynamic panel, known as a short panel, so the problem of overidentification is avoided. The Arellano and Bond test is employed to examine the autocorrelation problem in error terms.
Model Specification
Earlier empirical literature specifies regulatory capital requirements as a determinant of bank liquidity formation. Most previous studies use simultaneous equation analysis to address the potential endogenous relationship between liquidity formation and regulatory capital ratios (Berger & Bouwman, 2009; Casu et al., 2019; Distinguin et al., 2013; Horváth et al., 2014). However, this study employs the Arellano and Bover (1995) system dynamic panel technique to address the endogeneity problem, between liquidity formation and equity requirements, and the persistence of the relationship over time. The empirical model is specified by the following set of equations (subscripts i and t, stand for cross section and time period, respectively):

In Equation 1 (i.e., the liquidity determinant model), the liquidity factor is regressed on the set of explanatory variables recognized in the literature. In the above equation, CAP and LIQ correspond to regulatory capital and liquidity variables, respectively. BSV m and MACRO n are the mth and nth bank specific and macroeconomic control variables, respectively; RPV represents the regulatory pressure variable measured by bank market power; and Vit is the random disturbance term. In Equation 2, we further add the ownership pattern as a determinant of liquidity creation and in Equation 3 we add the interaction term between regulatory capital and ownership structure:
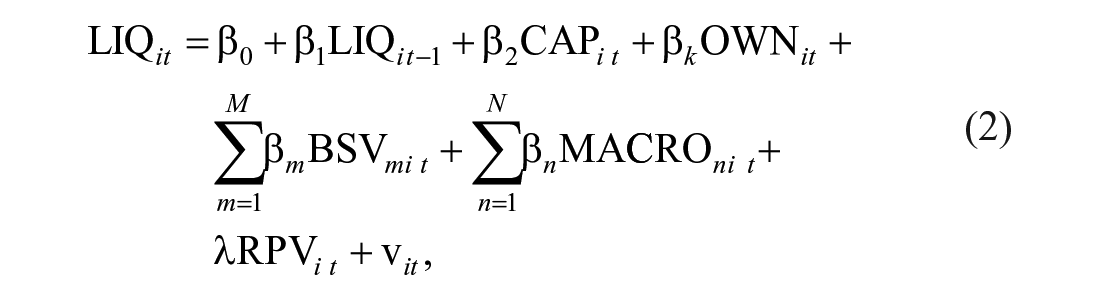

In Equations 2 and 3, OWN it refers to the ownership structure measured by type of ownership and degree of concentrated ownership. The study contributes to the present literature by examining the combined impact of regulatory capital requirements and ownership structure on banks’ liquidity creation. The combined effect is tested by analyzing the interaction between capital ratios and ownership variables.
Results and Discussion
This study employs Arellano and Bover (1995) two-step dynamic panel system GMM technique for model estimation, due to the endogeneity problem. Table 2 shows the sample description, including the sample countries, number of banks, and frequency of data. India comprises 28.5% of sample the data while China and Indonesia comprise 20.8% and 15.6%, respectively. Pakistan and Philippines provide 12.1% and 9.5% of the sample data, respectively. Thailand and Malaysia provide 13.48% collectively.
Sample Description.

Table 3 presents the descriptive statistics and reports the number of observations, mean values, and standard deviations of all the variables in the emerging Asian market sample. The average value of the liquidity variable (i.e., INSFR) is 0.65 with a standard error of 0.87, while the mean value of the liquidity creation indicator (LCI) is 0.23 with a standard error of 1.585. For the regulatory capital ratios, the mean of the tier 1 ratio (T1R) is 13.1% with a standard deviation of 12.3%, which shows a small spread, and the total capital ratio (TCR) has a mean of 15.9% and a standard error of 12.2%. For bank-specific control variables, the net-loan-to-deposit ratio (NLTD) shows a larger deviation from the mean. The macroeconomic and ownership variables do not show very large spreads.
Descriptive Statistics.

Note. T1R and TCR represent the tier 1 capital ratio and total capital ratio (i.e., measures of regulatory capital [CAP]) and INSFR (measure of liquidity creation under Basel III) represents the inverse of the net stable funding ratio. SD = standard deviation; GDP = gross domestic product; MPI = monetary policy indicator; TCR = total capital ratio; ROE = return on equity; DCPS = domestic credit to private sector; SDR = subordinate debt ratio; PBV = price-to-book value; OC = ownership concentration; BMP = bank market power; NLTD = net-loan-to-deposit ratio.
The results of the study show that regulatory capital, ownership concentration, and macroeconomic variables are the most relevant factors determining bank liquidity creation. The base model regression results are shown in Table 4. The results show that regulatory capital is positively related to the inverse of the NSFR, which implies that high capital ratios lead to improved liquidity creation consistent with the risk-absorption hypothesis as more capital enhances the bank’s risk-taking ability. The risk-absorption hypothesis depends on two views expressed in the literature. On one hand, some studies argue that liquidity increases the banks’ exposure to risk-taking. The more liquidity is created, the larger the possibility and strength of losses related to disposal of illiquid assets to cover customers’ liquidity demands (Allen & Gale, 2004). On the other hand, some studies argue that capital absorbs risk and enhances banks’ risk-bearing capability (Repullo, 2004; Von Thadden, 2004). The combination of these two views predicts that high capital ratios can improve banks’ liquidity creation ability. The positive relation between capital requirement and liquidity creation is also consistent with Berger and Bouwman (2009) findings that high capital permits banks to tolerate more risk, consistent with the bank’s risk transformation role.
Base Model Estimation.

Note. Table 4 presents the base model estimations. This study uses the Arellano and Bover (1995) two-step dynamic panel system GMM method for model estimation and hetero-robust errors are reported to tackle the problem of heterogeneity. The liquidity formation is measured by the inverse of NSFR. Capital (CAP) is measured by tier 1 capital ratio and profitability (PROF) is measured by return on equity. The AB test is applied to investigate the problem of autocorrelation in error terms. The number of cross sections is higher than that of instruments employed which avoids the overidentification problem. PBV = price-to-book value; SDR = subordinate debt ratio; BMP = bank market power; NLTD = net-loan-to-deposit ratio; GDP = gross domestic product; MPI = monetary policy indicator; GMM = generalized method of moments.
, **, and *** denote level of significance at 10%, 5%, and 1%, respectively.
In the case of bank-specific control variables, net loan to total deposit (NLTD) and profitability (PROF) have significant positive relationships with liquidity creation. The positive impact of NLTD implies that institutions with larger investments in illiquid assets (i.e., high loan-to-deposits ratios) are likely to create more liquidity. The positive relationship with bank profitability (measured by return on equity) shows that banks with larger returns create more liquidity, as increases in profits may impact bank capital positively, which in turn enhances liquidity creation (Flannery & Rangan, 2008; Gropp & Heider, 2010). The negative impact of bank funding structure on liquidity creation, measured by the SDR, implies that subordinate debt is typically uninsured and uninsured creditors are more likely to suffer losses and show sensitivity toward bank riskiness. So, subordinate creditors have strong incentives to observe and restrain banks and charge them high funding costs (Nier & Baumann, 2006). The high funding costs lead banks to reduce liquidity creation.
In the case of macroeconomic variables, the MPI has a negative relationship with liquidity creation. This result implies that an increase in interest rates worsens liquidity creation (see Table 4). The findings also show a significant negative relationship between economic growth (GDP) and liquidity creation in emerging Asian economies. The negative impact of economic growth on liquidity creation supports the argument that some financial institutions may act in an extremely lax way during economic booms as they do not consider the cyclic nature of economic growth and are hence inclined to undervalue risk. This lax behavior during economic upturns leads banks to not increase capital buffers and hence reduces liquidity creation (Ayuso et al., 2004) (see Table 4).
In Models 2 and 3, we consider ownership pattern as a factor of liquidity creation and focus the combined impact of regulatory capital on liquidity creation through its interaction with ownership structure. The findings show that managerial owners tend to improve liquidity creation (see Table 5), while concentrated ownership leads to a decrease in liquidity creation (see Table 6). This finding confirms the idea that concentrated ownership leads to a reduction in bank risk-taking and hence reduces liquidity. However, the combined effect of regulatory capital is only proved in the case of its interaction with ownership concentration (OC10) and shows the positive effect on liquidity formation. The findings imply that, in the case of higher regulatory capital ratios, banks with concentrated ownership tend to take more risks and create further liquidity, which is in accordance with the risk-absorption hypothesis. The lag of the dependent variable is also significant in (see Tables 5 and 6) and shows the persistence of relationship over time.
Ownership Model Estimation (Ownership Type).

Note. Table 5 presents the ownership model estimations. This study uses Arellano and Bover’s (1995) two-step dynamic panel system GMM method for model estimation and hetero-robust errors are reported to tackle the problem of heterogeneity. The liquidity formation is measured by the inverse of NSFR. Capital (CAP) is measured by tier 1 equity and total equity ratios. The AB test is applied to investigate the problem of autocorrelation in error terms. The number of cross sections is higher than that of instruments employed which avoids the overidentification problem. CAP = capital; PBV = price-to-book value; BMP = bank market power; NLTD = net-loan-to-deposit ratio; GDP = gross domestic product; MPI = monetary policy indicator; GMM = generalized method of moments.
, **, and *** denote significance level at 10%, 5%, and 1%, respectively.
Ownership Model Estimation (Ownership Concentration).

Note. Table 6 presents the ownership model estimations. This study uses Arellano and Bover’s (1995) two-step dynamic panel system GMM method for model estimation and hetero-robust errors are reported to tackle the problem of heterogeneity. The liquidity formation is measured by inverse of NSFR. Capital (CAP) is measured by tier 1 capital ratio and profitability (PROF) is measured by return on equity. The AB test is applied to investigate the problem of autocorrelation in error terms. The number of cross sections is higher than that of instruments employed which avoids the overidentification problem. OC = ownership concentration; PBV = price-to-book value; BMP = bank market power; SDR = subordinate debt ratio; NLTD = net-loan-to-deposit ratio; GDP = gross domestic product; MPI = monetary policy indicator; GMM = generalized method of moments.
, **, and *** denote significance level at 10%, 5%, and 1%, respectively.
The results related to the control variables are the same as the base model findings. Bank size (SIZE) has a positive relationship with liquidity creation, implying that large banks have more capacity to create liquidity as they enjoy more of the safety net provided by lenders of last resort in the event of a crisis, consistent with findings of Distinguin et al. (2013). Also, big banks have the advantage of reputational benefit and more access to external market funding, and hence create more liquidity (Bawazir et al., 2018). GDP and MPI have significant negative relationships, in most of the regressions, with liquidity creation. In the case of bank specific features, SDR has a negative relationship, while NLTD has a significant positive relationship, with liquidity creation, which proves the robustness of previous findings (see Table 6).
Robustness Tests
The robustness of the results is tested in several ways. First, the dependent variable is measured by an alternative measure, that is, the liquidity creation indicator (LCI) given by Berger and Bouwman (2009). The findings are reported in the appendix. The results show a significant positive relationship between regulatory capital and liquidity creation and validate the risk-absorption hypothesis. In the case of control variables, we add PBV into the model, which has a positive relationship with bank liquidity formation, suggesting banks with high charter value (i.e., high PBV) have easier access to capital markets, leading to an increase in liquidity creation. We also add bank market power (BMP) as a measure of regulatory pressure into the model, which has a negative and significant relationship with bank liquidity.
Second, in the ownership model case, managerial ownership and foreign ownership do not prove significant, which is in accordance with previous results. The ownership concentration has a negative impact on liquidity creation, but the finding is not significant. The effect of regulatory capital through its interaction with ownership structure is also not proved to be significant.
Third, as the Basel III accord was presented in response to the global subprime crisis of 2007, we add a crisis dummy into the model which takes the value of 1 during the period 2008 to 2010 and 0 otherwise. We analyze its interaction with regulatory capital to test how bank capital effects liquidity creation in crisis periods. The crisis dummy has a negative relationship with liquidity creation; however, it is not proved to be significant.
Fourth, we add a Basel III dummy, taking the value of 1 from 2010 onward and 0 otherwise. We analyze its interaction with regulatory capital to test how bank capital affects liquidity creation after the Basel III introduction; however, it is not proved to be significant. Regulatory capital, PBV, and NLTD have positive relationships, while SDR and BMP have negative relationships, with liquidity creation in all models, which shows the significance of the previous model’s findings.
Conclusion
This study investigates the effect of bank equity requirements and ownership patterns on liquidity creation in emerging Asian economies during the period 2004 to 2017. The study uses Arellano and Bover (1995) system dynamic panel technique to address the endogeneity problem, between equity requirements and liquidity formation, and the persistence of the relationship over time.
The results of study show that regulatory capital is positively related to the inverse of the NSFR, implying that a high capital level improves bank liquidity creation consistent with the risk-absorption hypothesis, as more capital enhances a bank’s risk-taking ability. The findings support the view of Berger and Bouwman (2009) that higher capital permits banks to tolerate more risk, consistent with their risk transformation role.
In the case of bank-specific control variables, net loans to total deposit and profitability have a significant positive relationship with liquidity creation. The positive relationship of net loans to deposit ratio implies that banks with larger investments in illiquid assets (i.e., high loan-to-deposit ratios) are likely to create more liquidity. The positive association between the profitability measure and liquidity formation shows that banks with larger returns create more liquidity, as an increase in profits may impact bank capital positively, which in turn enhances liquidity creation (Flannery & Rangan, 2008; Gropp & Heider, 2010). The negative relationship between bank funding structure (measured by SDR) and liquidity creation shows that, as subordinate debt is typically uninsured, subordinate creditors have strong incentives to observe and restrain banks and charge them high funding costs. These high funding costs lead banks to reduce liquidity creation. Bank size has a positive relationship with liquidity creation, implying that large banks have more capacity to create liquidity as they enjoy more of the safety net provided by lenders of last resort in the event of crisis, consistent with the findings of Distinguin et al. (2013). Also, big banks have the advantage of reputational benefit and more access to external market funding, and hence create more liquidity (Bawazir et al., 2018).
The results imply that an increase in interest rates worsens the liquidity creation and this confirms the idea that banks facing troubled economic situations reduce liquidity creation. The findings show a significant negative relationship between economic growth (GDP) and liquidity creation in emerging Asian markets. The negative impact of economic growth on liquidity creation supports the argument that some financial institutions may act in an extremely lax way during economic booms. They do not consider the cyclic nature of economic growth and hence tend to undervalue risk. This lax behavior during times of economic growth hampers banks from creating capital buffers and hence reduces liquidity creation (Ayuso et al., 2004).
The findings regarding ownership structure models show that managerial ownership has a positive impact on liquidity creation, while ownership concentration tends to decrease bank liquidity creation. However, the combined effect of regulatory capital is only proved in the case of its interaction with ownership concentration (OC10), where it has a positive effect on liquidity formation. The findings imply that, in the case of high capital, a bank with concentrated ownership tends to take more risks and create further liquidity.
The study results suggest several policy measures. First, the effect of regulatory capital on liquidity formation is positive, which shows that banks with high capital ratios are more likely to create liquidity, as high capital improves the risk-bearing capability. Second, the formation of new liquidity standards under Basel III may support the solvency of banks, with regulatory capital requirements, but limit the funds offered to businesses and families, and may reduce the economic activity in emerging markets. So, in the case of emerging Asian economy, where the banking sector remains a key source of financial intermediation, constructing a resilient banking structure is a need of paramount importance. However, the regulators besides nurture a wide range of innovative markets comprising derivatives and corporate bond markets to improve the spirit of the financial system.
Footnotes
Appendix
Correlation Matrix.

| INSFR | LCI | T1R | TCR | BMP | SIZE | SDR | PBV | NLTD | PROF | LLPR | GDP | MPI | MO | FO | OC5 | OC10 | DCPS | INF | |
|---|---|---|---|---|---|---|---|---|---|---|---|---|---|---|---|---|---|---|---|
| INSFR | 1 | ||||||||||||||||||
| LCI | .061* |
1 | |||||||||||||||||
| T1R | .074* |
.010 |
1 | ||||||||||||||||
| TCR | .065* |
.008 |
.955* |
1 | |||||||||||||||
| BMP | .023 |
−.017 |
−.036 |
−.022 |
1 | ||||||||||||||
| SIZE | .031 |
.023 |
−.253* |
−.245* |
.405* |
1 | |||||||||||||
| SDR | −.186* |
−.219* |
.060* |
.104* |
−.119* |
−.043 |
1 | ||||||||||||
| PBV | −.047* |
.044* |
.056* |
.062* |
−.013 |
−0.039 |
−.084* |
1 | |||||||||||
| NLTD | .003 |
=.002 |
.020 |
.016 |
−.011 |
−.020 |
−.022 |
−.002 |
1 | ||||||||||
| PROF | .175* |
−.014 |
−.025 |
−.023 |
.042 |
.011 |
−.063* |
.099* |
.002 |
1 | |||||||||
| LLRR | −.195* |
−.032 |
.009 |
.006 |
−.061* |
.029 |
.068* |
−.004 |
.014 |
−.346* |
1 | ||||||||
| GDP | −.009 |
−.010 |
−.098* |
−.102* |
−.203* |
−.055* |
−.020 |
.102* |
−.004 |
.158* |
−.071* |
1 | |||||||
| MPI | −.012 |
.084* |
.110* |
.121* |
−.173* |
.287* |
.120* |
.009 |
−.030 |
−.146* |
.133* |
−.263* |
1 | ||||||
| MO | .080* |
−.011 |
.034 |
.032 |
−.032 |
−.198* |
−.086* |
−.023 |
−.111* |
.008 |
−.086* |
−.251* |
.096* |
1 | |||||
| FO | −.042 |
.103* |
.062* |
.086* |
.215* |
.214* |
−.055 |
.020 |
.140* |
.100* |
−.066* |
.037 |
−.098* |
.036 |
1 | ||||
| OC5 | −.035 |
.077* |
.163* |
.161* |
.059* |
.114* |
.090* |
−.124* |
.020 |
−.128* |
.062* |
−.100* |
.264* |
−.204* |
−.222* |
1 | |||
| OC10 | −.106* |
.078* |
.128* |
.137* |
.104* |
.193* |
.072* |
−.087* |
.052 |
−.192* |
.118* |
−.148* |
.304* |
−.267* |
−.208* |
.913* |
1 | ||
| DCPS | .003 |
−.047* |
−.146* |
−.152* |
.094* |
−.091* |
−.140* |
−.008 |
.014 |
.122* |
−.075* |
.259* |
−.818* |
−.145* |
.103* |
.339* |
−.374 |
1 | |
| INF | −.004 |
.045* |
.045* |
.054* |
−.175* |
−.007 |
.071* |
−.011 |
−.016 |
−.073* |
.082 |
−01.79* |
.680* |
.141* |
−.151* |
.133* |
.156* |
−.576* |
1 |
Note. The p values are given in parenthesis and represent significance level at 5%. LCI = liquidity creation indicator; TCR = total capital ratio; BMP = bank market power; SDR = subordinate debt ratio; PBV = price-to-book value; NLTD = net-loan-to-deposit ratio; GDP = gross domestic product; MPI = monetary policy indicator; OC = ownership concentration; DCPS = domestic credit to private sector.
Declaration of Conflicting Interests
The author(s) declared no potential conflicts of interest with respect to the research, authorship, and/or publication of this article.
Funding
The author(s) received no financial support for the research, authorship, and/or publication of this article.