
Abstract
The Capital Asset Pricing Model (CAPM) is a widely used and tractable model relating financial risk and return. However, it has been less successful when taken to the data. In their seminal paper, Frazzini and Pedersen propose a Betting Against Beta (BAB) factor to take advantage of this fact. In their construction, the BAB factor is a portfolio which longs low-beta stocks and shorts high-beta stocks. Since its construction, the BAB factor has been widely cited and used both in financial academics and in industry. This paper proposes a novel betting on and against beta (BOAB) strategy, which bets on beta on days with macroeconomic announcements and bets against beta on days without. Here, macroeconomic announcement days are defined as days when inflation, unemployment, or interest rate decisions are released. Our findings confirm the persistent positive beta-return relationship observed on macroeconomic announcement days. We show that compared to the BAB strategy, BOAB delivers higher average daily excess returns over the time period 1964 to 2021 when applied to the U.S. stock market. This outperformance of the BOAB strategy is robust to different constructions of the BAB factor and is economically and statistically significant when compared with the usual asset pricing factors such as value, size, and momentum. The outperformance of the BOAB strategy could be used to inform agents’ portfolio allocation choices. Limitations are also discussed.
Plain Language Summary
Trading strategies are important because they impact how financial market participants invest and manage risk-return tradeoffs. This paper proposes a betting on and against beta (BOAB) strategy, which takes long positions on beta on a subset of trading days and short positions on other days. We determined which days to take long beta positions by testing the prediction of asset pricing models on days with macroeconomic announcements. We carefully constructed macroeconomic announcement days and used the Fama-MacBeth two-step testing procedure to evaluate predictions of the CAPM model. We conclude that the BOAB strategy outperforms the BAB factor, especially due to its outperformance on days with macroeconomic announcements. In the process, we consider varying ways of constructing the betting against beta factor to address critiques of the original BAB factor. We also demonstrate that the large, positive returns of the BAB factor has diminished since the publication of the original BAB paper.
Introduction
The capital asset pricing model (CAPM) developed by Sharpe (1964), Lintner (1965) and Mossin (1966) is the benchmark model for explaining the cross-section of asset returns. While the CAPM model provides a tractable way for investors to understand financial risk and return, its ability to match empirical facts has been challenged. Recent studies have sought to explain when CAPM predictions hold and when they do not (Ben-Raphael et al., 2021; Da et al., 2020; Hasler & Martineau, 2021; Savor & Wilson, 2014). This paper contributes to extant literature by documenting positive return-beta relationship on a subset of trading days and by proposing a trading strategy and comparing it against the canonical Betting Against Beta (BAB) factor.
The CAPM states that inside any market with risky and risk-free assets, the expected return of the risky asset can be measured by the product of its market risk and the expected excess return of the market portfolio. The intuition is that investors are only compensated for holding risk positively correlated with the market. However, stocks with high beta have been found to deliver low risk-adjusted returns (Baker et al., 2011; Black et al., 1972). In their seminal paper, Frazzini and Pedersen (2014) propose a BAB factor to take advantage of this fact. In their construction, the BAB factor is a portfolio which longs low-beta stocks and shorts high-beta stocks. Under this definition, Frazzini and Pedersen show that the BAB factor earn large alphas relative to what is predicted by the CAPM.
The BAB factor is important to study because the factor is widely cited and used both in financial academics and in industry. For example, the BAB factor is perceived by institutional investors as an important defensive equity strategy, a major investment category with asset inflows (Novy-Marx & Velikov, 2018). The significance in studying the BAB factor can also be seen in more recent works, which have attempted to modify the BAB factor in different ways. For instance, Moreira and Muir (2017) shows that a volatility-managed version of the BAB portfolio earns large alphas relative to the buy-and-hold BAB portfolio. As such, the BAB factor is still an active area of study and different versions of the factor are used as controls in asset pricing papers and widely cited.
The objective of this study is to document the varied performance of the BAB factor on days with and without macroeconomic announcements and to use this variance to motivate a novel betting on and against (BOAB) strategy. The BOAB strategy is defined as holding a portfolio that longs low-beta assets and shorts high-beta assets on days with no macroeconomic announcements and doing the reverse on days with macroeconomic announcements. To compare with the definition of the BAB strategy introduced above, the BOAB strategy takes the opposing side of the BAB strategy on days with macroeconomic announcements. We define macroeconomic announcement days to be days when unemployment and inflation data are released and on days with scheduled FOMC meetings. In our sample from 1964 to 2021, 13% of trading days are categorized as macroeconomic announcement days under our definition. Thus, our proposed BOAB strategy differs from the BAB strategy on 13% of the trading days in our sample period. We hypothesize that the BOAB strategy outperforms the BAB strategy given that BOAB takes advantage of the positive return-beta relation on macroeconomic announcement days.
In our analysis, we use daily returns of U.S. stocks from The Center for Research in Security Prices (CRSP) to compute daily market betas of individual stocks. The focus on U.S. stocks is necessary because it allows us to situate our findings within existing literature, which also focus on U.S. stocks and U.S. informational events (Chan & Marsh, 2022; Savor & Wilson, 2013, 2014). We focus on macroeconomic announcements given its importance in asset pricing and economic policy (Hendershott et al., 2020; Khan et al., 2021, 2022). To test predictions of the CAPM model, we construct both equal-weighted and value-weighted beta portfolios and perform Fama-MacBeth regressions.
We provide methodological contribution by re-constructing the BAB portfolio in response to the Novy-Marx and Velikov (2018) critiques. To address critiques of the rank-weighting and beta estimation procedure used in the original construction of the BAB portfolio, we weight stocks in proportion to their market capitalizations and estimate betas as slope coefficients form the CAPM regressions. This differs from the methodology used by Frazzini and Pedersen (2014) which measures betas using estimates of volatilities estimated with one year of daily returns data.
Our main findings support our hypothesis that going long beta on days with macroeconomic announcements and going short beta on days without such announcements outperform the canonical short beta strategy. By incorporating a correction to the BAB strategy, we achieve higher average daily excess returns on both beta-neutral and non-beta neutral portfolios. Furthermore, our findings are robust to different constructions of the BAB factor. When we construct the BAB factor using top and bottom deciles of beta portfolios, the BOAB strategy generates an outperformance of 3 bps on average. When we construct the BAB factor using an averaging methodology, where we long the average of the bottom five deciles of beta portfolios and short the average of the top five deciles of beta portfolios, the BOAB strategy generates an average outperformance of over 1 bp. The magnitude of the outperformance of the BOAB strategy is economically and statistically significant when compared with the usual asset pricing factors such as value, size, and momentum.
Given our findings, the contributions of this article are mainly divided into the following aspects. First, one may wonder whether the positive beta-return relationship on macroeconomic announcement days continue to hold after being documented in recent literature. Our findings confirm the persistent positive beta-return relationship observed on macroeconomic announcement days. Importantly, we show that this relationship remains robust in the context of recent years’ stock returns. Second, we introduce two alternative methods for constructing the betting against beta factor, effectively addressing criticisms regarding its original construction. Moreover, we establish that the outperformance of the constructed BOAB factor over the BAB factor remains consistent, regardless of the approach used to compute the betting against beta factor. Third, our research reveals that the proposed factor exhibits economic significance and magnitude comparable to conventional asset pricing factors. This highlights the potential of the BOAB factor as a valuable control variable for explaining excess returns in future asset pricing studies.
The rest of the paper is organized as follows. Section 2 introduces related literature. Section 3 describes the data used in our analysis, regression specifications, and the construction of our portfolios. Section 4 presents the main results and contextualizes our findings. Section 5 concludes and provides empirical implications. Section 6 discusses limitations. Section 7 proposes directions for future research.
Literature Review
An important question in asset pricing is whether prices are predictable. To that end, many models have been developed to identify factors which predict asset prices significantly. Among those proposed, the capital asset pricing model (CAPM) developed by Sharpe (1964), Lintner (1965), and Mossin (1966) is the most widely used model by academics and practitioners alike.
In the return-beta language, the CAPM states that

where
While the CAPM presents a tractable model relating financial risk and return, it has been less successful when taken to the data. Almost all of the literature has noticed that empirically, CAPM fails to hold, giving rise to various asset pricing puzzles such as the equity premium puzzle and the risk-free rate puzzle. For instance, previous studies by Black et al. (1972) and Fama and French (1992) find no direct relationship between market betas and stock returns empirically. In a widely read piece by Frazzini and Pedersen (2014), the authors document that the security market line (SML) for stocks in the U.S. are too flat relative to the CAPM.
In an attempt to identify whether the CAPM might hold for a subset of trading days, Savor and Wilson (2014) evaluates the CAPM by examining its performance separately on days with pre-scheduled macroeconomic news versus on days without such news. Their main finding is that there exists a positive beta-return relationship on announcement days for various portfolios, including beta-sorted portfolios, book-to-market sorted portfolios, and industry portfolios. Importantly, Savor and Wilson shows that it is important to distinguish between the behavior of stocks on announcement versus no-announcement days given stocks generate most their risk premium on announcement days.
This work by Savor and Wilson is followed by a wave of literature attempting to document when CAPM holds and when it does not. For example, Hong and Sraer (2016) document that CAPM holds for certain assets and not others due to investor disagreement. Their main conclusion is that high-beta assets are overpriced compared to low-beta assets when disagreement about the common factor of firms’ cash flows is high. Compared with the Savor and Wilson approach, Hong and Sraer explains the beta puzzle by introducing heterogeneity within market participants. A similar approach is used by Antoniou et al. (2016), which conclude that CAPM holds in periods of optimism, but not in periods of pessimism. In particular, Antoniou et al. argue that unsophisticated traders are drawn to high-beta stocks in period of market optimism, and the difference in the timing of participation by sophisticated and unsophisticated traders gives rise to performance discrepancy of the CAPM.
Even more recently, Hendershott et al. (2020) revisits the idea of explaining variation in the CAPM performance using time variation. Methodologically, their methods are more similar with Savor and Wilson (2014) by estimating rollinwg 12-month stock market betas and then sorting stocks into beta deciles. Their main conclusion is that whether the CAPM holds for stocks or not depend on whether markets are open for trading or closed. Namely, they find that the beta-return relationship is positive when the stock market is closed, while the converse is true when the stock market is open. This result corroborates Lou et al. (2019) and Bogousslavsky (2019), which perform similar analysis on the cross-section of intraday and overnight returns of U.S. stocks.
Continuing to focus on macroeconomic announcements, Hirshleifer and Sheng (2022) explore how asset prices react to macroeconomic news when it is released in conjunction with microeconomic news. The main contribution of this paper is the presentation of a complementary framework as opposed to a substitution framework, which was first introduced in the model by Peng and Xiong (2006). Hirshleifer and Sheng find that when macroeconomic announcement days overlap with firm-specific announcements, the sensitivity of returns to earnings news is higher and post-earnings drift is lower.
While recent literature (Bogousslavsky, 2019; Hendershott et al., 2020; Hirshleifer & Sheng, 2022; Lou et al., 2019) affirm the finding that asset prices could be reconciled using the CAPM on certain days but not others, absent from these papers is the proposal of a strategy taking advantage of these newly documented empirical facts. To contribute to this vacancy, we revisit the Betting Against Beta (BAB) strategy developed by Frazzini and Pedersen (2014) and update it to take advantage of the heterogeneity in when positive beta-return relationship holds.
Since the introduction of the BAB factor, several explanations have been offered to account for the outperformance of the BAB factor, relative to the Fama and French factors, for example. In particular, Novy-Marx and Velikov (2018) critique the methods used in the original BAB factor computation. First, the authors critique the “rank-weighting” procedure used in the Frazzini and Pedersen paper of assigning each stock to either the “high” portfolio or the “low” portfolio with a weight proportional to the cross-sectional deviation of the stock’s estimated beta rank from the median rank (Non-standard procedure #1). Second, the authors critique the methodology of measuring beta by combining market correlations using 5 years of overlapping 3-day returns with volatilities estimated using 1 year of daily data (Non-standard #3 in BABAB). Motivated by these critiques, we provide variations in the construction of an updated BAB factor and show that results hold regardless of how we construct the factor.
Our paper also has analogues in the line of financial economics research studying the behavior of asset prices around earnings. For example, many recent papers have investigated the role of earnings in disseminating information into the financial markets, thereby impacting stock returns (Chang et al., 2017; DellaVigna & Pollet, 2009; Frazzini & Lamont, 2007). The most closely related paper in this line of work is Chan and Marsh (2022), which studies a subset of trading days named lead announcement days (LEADs). LEADS are defined as days on which an aggregate of large influential S&P 500 companies disclose earnings news early in the earnings season. In their paper, Chan and Marsh (2022) confirm that market-beta relation is linear and strongly positive across securities on LEAD days.
In our paper, instead of examining stock-specific informational events such as earnings releases, we explore the full cross-sectional relationship between expected returns and beta. We document that the differences in behavior of assets on days with macroeconomic announcement days and on days without such announcements continue to persist, even after the publication of papers documenting this anomaly (Savor & Wilson, 2014), which suggests that the anomaly has not been traded away in the market. Furthermore, we fill the vacancy in the literature by proposing an updated BOAB trading strategy, while addressing critiques to the original BAB factor outlined above.
Data and Methods
Macroeconomic Announcement Days
We define announcement days to include unemployment announcement dates, consumer price index (CPI) announcement dates, producer price index (PPI) announcement dates, and Federal Open Markets Committee (FOMC) scheduled interest rate announcement dates. We obtained the historical unemployment, CPI, and PPI release dates from the Federal Reserve Bank of St. Louis website. Importantly, we only include CPI announcement dates before February 1972 and PPI announcement dates after. This is because after February 1972, PPI numbers were released prior to CPI numbers, diminishing the market impact of the information released on CPI announcement days.
Following Kuttner (2001), we assume that the FOMC decisions became public information one day after the meeting date for all meetings before February of 1994. This means that the announcement days in our sample prior to 1994 are not what is shown on the Federal Reserve website, but one day after. For example, if the FED reported meeting days of February 2 to February 3, 1994, as meetings often occur over the course of 2 days, we record February 4, 1994 as the announcement day in our sample. For meetings after 1994, we do not amend any data collected from the Federal Reserve website. In cases where the meeting took place over 2 days, the second day is recorded as the announcement day. We discard any meetings that are labeled as unscheduled on the Federal Reserve website. We also exclude any conference calls listed on the website. After filtering for appropriate dates for analysis, we observe 329 meetings before 1994, 144 meetings between 1994 and 2011, and 84 meetings between 2011 and 2021, for a total of 557 meeting dates in our overall sample.
Combining CPI, PPI, and FOMC decision days, we present summary statistics of the behavior of stock returns on announcement days (a-days) and no-announcement days (n-days) in Table 1. In Table 1, N denotes the number of days in each category, and average excess returns denotes the average daily returns of the U.S. stock market reported in bps. We see that while a-days account for 13% of the number of trading days within our sample, the average daily excess return is much higher for a-days (9.14 bps) than for n-days (1.87 bps). Thus, a large amount of risk premium for U.S. stocks are observed on a small fraction of trading days. This further motivates a trading strategy which distinguishes between these two types of days, as opposed to the BAB strategy, which is homogenous across days.
Summary Statistics For Announcement and No-Announcement Days.

Beta-Sorted Portfolios
To construct beta-sorted portfolios, we download daily returns of U.S. stocks, compute daily market betas of individual stocks, sort the stocks into 10 portfolios, compute the daily returns of each portfolio over the course of each month, and rebalance these portfolios monthly. We obtained stock return data from The Center for Research in Security Prices (CRSP). Our universe of stocks includes all US-listed stocks with share codes 10 and 11 whose returns correspond to dates with valid permno-specific information. For each of these stocks, we query both the market capitalization and the one-month lagged market capitalization. Missing market capitalizations are imputed by a 0 value. We obtained market returns and the risk-free return from Fama’s website.
We compute the market beta of asset

where
Fama-MacBeth Procedure
Following asset pricing literature, we employ the Fama-MacBeth two-step testing procedure to evaluate predictions of the CAPM model. In the second-stage regressions, we perform separate regressions for asset returns on announcement days and no-announcement days. We regress the cross-sectional excess returns of portfolio j on day t + 1 on the portfolio beta at time t. The second-stage regressions for announcement days are given by:

The second-stage regression for no-announcement days are given by:

After performing the second step for each t, we obtain T observations of each

and

Finally, after computing
Computing Factors
We compute BAB and BOAB factor returns in two ways. First, we use the original BAB factor returns from Frazzini and Pedersen (2014). We are able to do so using the BAB factors from AQR’s website (http://aqr.com/Insights/Datasets/Betting-Against-Beta-Equity-Factors-Daily). To construct the BOAB factor, we bet against beta on days when there are no macroeconomic announcements and bet against beta on days with macroeconomic announcements. Namely, on no-announcement days, we assume the same portfolio as in Frazzini and Pedersen (2014), longing low-beta securities and short-selling high-beta securities. On announcement days, we compute returns of the reverse strategy where we long high-beta securities and short-sell low-beta securities.
Second, we come up with our own BAB factors and demonstrate that BOAB continues to outperform BAB. Methodology in this section is directly motivated by the critiques of BAB raised by Novy-Marx and Velikov (2018). In particular, we address two concerns raised by Marx and Velikov. First, the authors critique the “rank-weighting” procedure used in the original Frazzini and Pedersen paper of assigning each stock to either the “high” portfolio or the “low” portfolio with a weight proportional to the cross-sectional deviation of the stock’s estimated beta rank from the median rank. To address this, we weight stocks in proportion to their market capitalizations. Second, the authors critique the methodology of measuring beta by combining market correlations using 5 years of overlapping three-day returns with volatilities estimated using 1 year of daily data. To address this, we apply the standard methodology of estimating betas as slope coefficients from CAPM regressions.
We conduct robustness checks by coming up with two versions of the BAB factor. First, we compute the BAB factor by taking a long position in the bottom decile and a short-short position in the top decile of beta-sorted portfolios over the entire sample period. Second, we compute the BAB factor as the average return on the five low-beta portfolios minus the average return on the five high-beta portfolios. Let

and
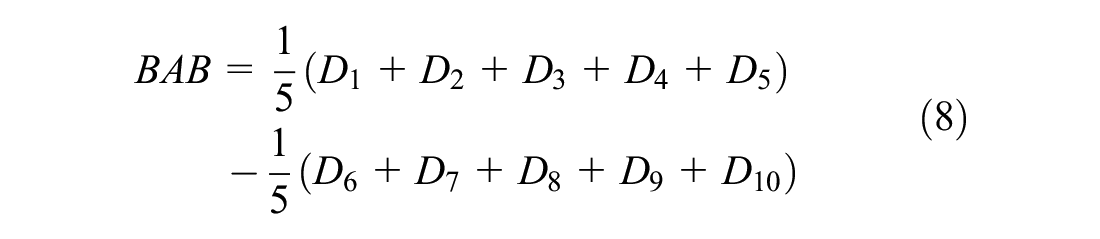
The BOAB returns simply take the BAB strategy on no-announcement days and the reverse strategy on announcement days.
We also consider the case of a beta-neutral portfolio by hedging our portfolios with the underlying value-weighted market portfolio on announcement days. Thus, on announcement days, we achieve a zero beta portfolio by holding the value-weighted market in proportion to the overall beta of the strategy in equations (7) and (8).
Results and Discussion
Preliminary Results
In this section we show the results from (1) plotting average daily excess returns against full-sample unconditional betas and (2) regressing daily average excess returns on 12-month rolling betas. We also perform this analysis for (a) 10 beta-sorted portfolios, value-weighted, (b) 10 beta-sorted portfolios, equal-weighted, (c) 25 Fama-French book-to-market and size portfolios, value-weighted, and (d) 10 industry portfolios, value-weighted.
For all figures shown in this section, square markers denote the average excess return and the unconditional full-sample betas on announcement days. Circle markers denote the same variables on no-announcement days. The solid and dashed lines denote the line of best fit for announcement and no-announcement days, respectively.
From Figure 1, it is immediately clear that there is a positive relationship between market betas and excess returns on announcement days, while this relationship does not exist on no-announcement days. Taking Figure 1a as an example, for no-announcement days, an increase in beta of one is associated with a reduction in average daily excess returns by 1.1 bps, with a t-statistic of −7.37. This corresponds to what is documented in Savor and Wilson (2014), where the decrease in returns per unit increase in beta was found to be 1.5 bps.

Average excess returns for (a) 10 beta-sorted portfolios using value-weighted and (b) equal-weighted methodologies from 1964 to 2021.
For announcement days, the relationship between average excess returns and beta is strongly positive. Continuing to take Figure 1a as an example, an increase in beta of one is associated with an increase in average daily excess returns by 6.1 bps, with a t-statistic of 8.67. This indicates that the coefficient corresponding to the slope of the SML is highly statistically significant. The R^2 for the announcement day SML line is found to be 90.4%. This supports the conclusion from Savor and Wilson (2014) that from full-sample betas, it appears that almost all variation in announcement day average excess return can be explained by variation in market betas. For comparison, Savor and Wilson (2014) documented an R^2 of 95.9% for the announcement day SML, compared with the 90.4% that we found. Similarly, they documented an R^2 of 63.1% for the no-announcement day SML, compared with the 70.1% that we found.
Figure 2 shows very similar conclusions when we examine the 25 Fama-French portfolios and the 10 industry portfolios. Asset pricing behavior on no-announcement days continues to contradict the predictions by the CAPM, predicting a decrease in average excess return for an increase in beta. For the 10 industry portfolios, an increase in a unit of beta corresponds to a decrease in average excess return by 1.8 bps, with a t-statistic of −1.86. The SML line for announcement day returns for the 10 industry portfolios matches CAPM predictions almost perfectly. An increase in a unit of beta corresponds to an increase in average excess return by 10.4 bps. The slope coefficient is also found to be highly significant, with a t-statistic of 3.15.

Average excess returns for (a) 25 Fama-French portfolios and (b) 10 industry portfolios from 1964 to 2021.
We take a moment to note one discrepancy between our findings in Figure 2a and Figure A2 from Savor and Wilson (2014). Upon visual inspection of the two figures (as exact coefficient estimates are not separately provided for the 25 Fama-French portfolios in the original paper), it appears that our SML line for asset returns on announcement days is flatter in comparison, while our SML line for no-announcement days is steeper. This suggests that for these specific portfolios, we found stronger evidence suggesting CAPM does not hold for no-announcement days. However, we found weaker evidence that CAPM does hold for announcement days. Examining the outliers on the SML line for announcement days, we find that the outliers to the bottom of the SML line correspond to ME5-BM4 and BIG-HiBM, the last two portfolios of the 25 Fama-French portfolios. One reason we offer for the differences in results is that these portfolios are inherently harder to price and may be more sensitive to any variations in the estimated market betas. Savor and Wilson (2014) did not specify the exact parameters they used in fitting rolling betas. While we made the reasonable assumption of discarding anything without a minimum of 60 observations, Savor and Wilson (2014) may have imposed different restrictions that led to different market betas in the first-stage of the Fama-MacBeth regression.
Regression Results
In this section we focus on the regression results for the 10 beta-sorted portfolios using value-weighted and equal-weighted returns calculations. Table 2 reports the Fama-MacBeth regression results for announcement days and no-announcement days from 1964 to 2021. The same regression procedure of regressing daily excess returns on betas calculated using the rolling method is repeated for four portfolios. Panel A and B display results from the regression on beta-sorted portfolios using value-weighting and equal-weighting, respectively. Panel C and D display results from the 25 Fama and French portfolios formed on book-to-market and size and the 10 industry portfolios.
Fama-MacBeth Regression Results.

In Panel A of Table 2, we observe that on days with no important macroeconomic announcements, the stock market beta is found to command a negative risk premium (−0.5 bps, with a t-statistic of −0.43). The intercept of the SML is also estimated to be non-zero with a high significance, with a t-statistic of 3.98. This is in contrast to the estimated coefficients of the excess returns regression on announcement days. Importantly, the implied risk premium is estimated to be 7.8 bps, with a t-statistic of 2.39. The results from our simple t-test also agree with what was reported in Savor and Wilson (2014). We observe that the difference in the slope coefficients of the 2 days is 8.3 bps with a high t-statistic. This is strongly indicative that beta is an important measure of systematic risk for announcement days.
We also conclude similar findings when regressing equal-weighted returns on the rolling betas, as reported in Panel B of Table 2. Again, the no-announcement days correspond to a negative relationship between average excess returns and beta with the SML slope estimated to be −3.8 bps and the intercept to be 8.1 bps, both with very high t-statistics. This is against the prediction of the CAPM, as we would expect to see a positive slope and a non-statistically significant intercept. The announcement day regression results, on the other hand, better correspond with the predictions given by CAPM. We observe a positive and statistically significant positive relationship between average risk premia and market beta.
Repeating the same analysis for the 25 Fama-French portfolios and the 10 industry portfolios lead us to very similar conclusions, shown in Panels C and D of Table 2. Because these portfolios are formed according to different characteristics, similar regression results are important evidence that the relevance of market betas on announcement days is not specific to portfolios formed on “pre-ranking” betas, but apply to a variety of portfolios.
Analysis Using the Original BAB Factor
Table 3 reports the average daily excess returns for announcement days and no-announcement days from 1964 to 2011. Panel A presents average returns for the betting against beta (BAB) factor. Panel B presents average returns for the market (Mkt-RF), small-minus-big (SMB), high-minus-low (HML) factors. Numbers are expressed in basis points. T-statistics are in brackets.
Average Daily Excess Returns for Announcement Days and No-Announcement Days.

Panel A of Table 3 shows that the positive average returns from betting-against-beta (Proposition 1 of Frazzini and Pedersen) is driven by the out-performance of the strategy on days when there are no important macroeconomic announcements. The BAB factor generated average daily returns of 4.3 bps over the time period from 1964 to 2021. Conversely, the factor generated average daily returns of −0.66 bps on no-announcement days. The difference in means between the two types of days is statistically significant, with a t-statistic of 3.35.
For comparison purposes, we generate Panel B to compare with Table 3 of Savor and Wilson (2014). We similarly conclude that the out-performance of small stocks occur on announcement days. The differences in average returns for the SMB factor across the two types of days is statistically significant, with a t-statistic of 2.49. When extending the sample to 2021, we do not see similar conclusions as in Savor and Wilson that low book-to-market portfolios outperform the high book-to-market portfolios on announcement days. While the average access return for the HML factor on announcement days is close to 0, it is not negative in sign as it was for the sample period 1964 to 2011.
Results shown in Table 3 suggests that the outperformance of the BAB strategy is largely driven by its performance on days without macroeconomic announcements. In fact, on days when there are announcements, the BAB factor performs worse than the set of Fama and French factors. Overall, only the BAB factor average excess return reverse in sign between the two types of days, motivating us to propose an alternate strategy to exploit the varied performance of the BAB factor across the two types of days.
We propose a new betting on and against beta strategy where we bet against beta on days when there are no macroeconomic announcements and reverse the strategy on days with macroeconomic announcements. That is, on no-announcement days, we assume the same portfolio as in Frazzini and Pedersen, longing low-beta securities and short-selling high-beta securities. On announcement days, we compute returns of the reverse strategy where we long high-beta securities and short-sell low-beta securities. We directly use the BAB returns from Frazzini and Pedersen (2014).
We compare the average daily excess returns of the BAB and BOAB strategies over the time period 1964 to 2021 in Table 4. Table 4 reports the average daily excess returns for betting against beta and betting on and against beta strategies over the time period 1964 to 2021. Average returns are calculated using the Frazzini and Pedersen BAB factors. Returns are reported in basis points. Standard errors are reported in brackets. Since on no announcement days, the BAB and BOAB strategies are the same, the differences in the average daily excess return is solely driven by the difference in performance on a-days. Several explanations have been offered to account for the outperformance of the BAB factor on n-days (when compared with the Fama and French factors, for example). In particular, Marx and Velikov have critiqued the methods used in the original BAB factor computation. We address these concerns in the next section. Despite the way that the BAB factor was computed, we see that the BOAB portfolio still sees a marginal improvement over the BAB portfolio over the time period 1964 to 2021.
Average Daily Excess Returns For Betting Against Beta and Betting On and Against Beta Strategies.

Analysis Using the Updated BAB Factor
In the previous subsection, we analyzed the BAB and BOAB strategy using the original BAB factors from Frazzini and Pedersen (2014). In this section we come up with our own BAB factors and demonstrate that BOAB continues to outperform BAB. Methodology in this section is directly motivated by the critiques of BAB raised by Novy-Marx and Velikov (2018) in Betting Against Betting Against Beta.
In particular, we address two concerns raised by Novy-Marx and Velikov (2018). First, the authors critique the “rank-weighting” procedure used in the original Frazzini and Pedersen paper of assigning each stock to either the “high” portfolio or the “low” portfolio with a weight proportional to the cross-sectional deviation of the stock's estimated beta rank from the median rank (Non-standard procedure #1 in BABAB). To address this, we use the standard methodology of weighting stocks in proportion to their market capitalizations. Second, the authors critique the methodology of measuring beta by combining market correlations using 5 years of overlapping 3-day returns with volatilities estimated using 1 year of daily data (Non-standard procedure #3 in BABAB). To address this, we apply the standard methodology of estimating betas as slope coefficients from CAPM regressions, as described in Section 2 of the paper.
Figure 3 shows monthly alphas. The test assets are beta-sorted portfolios. Stock market betas are estimated using rolling windows of daily returns from 1964 to 2021. We then sort the stocks into one of 10 beta-decile value-weighted portfolios. This figure plots alphas from low beta (left) to high beta (right). We do this to demonstrate that after updating the procedure in the original BAB paper by weighing stocks in proportion to their market capitalizations and by estimating betas as slope coefficients of CAPM regressions, we still successfully validate that high beta is low alpha (Proposition 1 in BAB). Thus, Figure 3 should still motivate a BAB strategy. Despite this, we demonstrate next that BOAB performs better.

Alphas of the 10 beta-sorted portfolios.
We now compute the BAB factor in two different ways and demonstrate that BOAB achieves superior performance under both methodologies, as specified in equations (3) and (4). Table 5 reports the average daily excess returns for the BAB and BOAB strategy over the time period 1964 to 2021. Panel A shows the average returns for the two strategies with the BAB factor constructed using the top and bottom deciles of beta-sorted portfolios. Panel B shows the average returns for the two strategies with the BAB factor constructed using the average of the low- and high- beta portfolios. Returns are reported in basis points. Standard errors are reported in brackets.
Average Daily Excess Returns Using Alternative Constructions of the BAB Factor.

Table 5 shows the average daily excess returns of BAB and BOAB strategies over 1964 to 2021 for both methodologies of computing BAB. Panel A shows the performance of the factor when we compute the BAB factor using equation (7). We see that when using the extreme deciles of beta-sorted portfolios, the average daily excess return of the BOAB portfolio outperforms the BAB portfolio by 2.65 bps. This outperformance is entirely driven by the outperformance of the BOAB strategy over the BAB strategy on announcement days. In fact, the outperformance of the BOAB strategy on announcement days alone is much larger in magnitude. However, since announcement days only comprise of 13% of the trading days in our sample, the overall outperformance of the strategy is expectedly more muted.
Panel B of Table 5 shows the performance of the factor when we compute the BAB factor using equation (8), in the spirit of how the Fama-French factors are constructed. As one may expect, averaging across portfolios as opposed to looking at the extreme portfolios yields average daily excess returns that are smaller in magnitude. Despite this, we see that BOAB outperforms BAB by over one basis point on average.
Analysis of Beta-Neutral Portfolios
In this section we consider whether the difference between Tables 4 and 5 could be attributed to the lack of hedging in our new construction of the BAB factor. Recall that the original BAB factor achieved market neutrality via leverage by scaling the underlying portfolios by their predicted betas. By leveraging (de-leveraging) the low (high) beta portfolios, the long/short strategy net to a beta of zero overall.
Following the BABAB critique of the leveraging strategy, we adopt the conventional approach of achieving beta-neutrality by hedging our portfolios with the underlying value-weighted market portfolio on announcement days. We care about announcement days in particular because based on the results from Table 5, it appears that the biggest differences between our factors and the original BAB factors occur on announcement days. Thus, on announcement days, we achieve a zero beta portfolio by holding the value-weighted market in proportion to the overall beta of the strategy in equations(7) and (8).
Table 6 reports the average daily excess returns for the BAB and BOAB strategy over the time period 1964 to 2021. Panel A shows the average returns for the two strategies with the BAB factor constructed using the top and bottom deciles of beta-sorted portfolios. Panel B shows the average returns for the two strategies with the BAB factor constructed using the average of the low- and high-beta portfolios. The left-hand side shows returns of non-hedged portfolios. The right-hand side shows returns of portfolios hedged to be market-neutral on announcement days using value-weighted market returns. Returns are reported in basis points. Standard errors are reported in brackets.
Average Daily Excess Returns For Beta-Hedged and Not Beta-Hedged Strategies.

Table 6 allows us to compare the returns of the beta-neutral portfolio with the previously formed portfolios, which are not hedged to be beta-neutral. The left-hand side of Table 6 reports the same results as shown in Table 5. The right-hand side of Table 6 reports the returns of portfolios which are beta-hedged on announcement days. Panel A continues to show the result from constructing the BAB factor using top and bottom deciles. Comparing the left-hand side panel with the right-hand side, we observe minimal differences. While the BAB strategy performed 0.02 bps better on announcement days and overall, the impact of beta-hedging our portfolios on announcement days is negligible. We observe very similar results when we examine Panel B, which displays the returns of the two strategies when the BAB factor is constructed using an averaging method. Again, the BAB strategy when hedged on announcement days performs marginally better, and the BOAB strategy performs marginally worse on announcement days and overall. However, differences are nearly negligible. We observe no changes in standard errors of the returns the hedged portfolios versus the original, non-hedged portfolios.
The key take-away from Table 6 is that comparing beta-neutral BAB and BOAB portfolios do not diminish the outperformance of the BOAB portfolio. We thus find consistent evidence in favor of our hypothesis. By introducing a correction to the BAB strategy by taking the opposing position on days with macroeconomic announcements, we gain higher returns both in non-self-financing (non-beta-neutral) and in self-financing (beta-neutral) portfolios. This is evidence that the BOAB strategy, which longs beta on macroeconomic announcement days and shorts beta on days without macroeconomic announcements, may be of interest to funds which hold beta-neutral investment mandates. Of course, the implications of the strategy for investment decisions also rests upon analysis of transaction costs in switching in and out of long/short positions. This is an avenue for future research.
Conclusion
This paper studies how beta-return relationships differ on days with macroeconomic announcements and on days without. Furthermore, this paper takes advantage of the heterogeneity in beta-return relationship on different types of days to propose a novel trading strategy. We show that a portfolio which is long beta on macroeconomic announcement days and short beta on days without macroeconomic announcements outperforms the canonical betting against beta portfolio referenced in much of the financial literature. Over the time period of 1964 to 2021 considered, we show that our novel trading strategy outperforms BAB regardless of the construction of the BAB factor. When the BAB factor is constructed using the top and bottom deciles of portfolios, BOAB outperforms BAB by 3 bps on average. When the BAB factor is constructed using the averaging method, BOAB outperforms BAB by over 1 bps on average. These results hold regardless of if our portfolios are made to be beta-neutral or not.
The findings of this study have several empirical implications. First, one may wonder whether the positive beta-return relationship on macroeconomic announcement days continue to hold after being documented in recent literature. We show that, indeed, the opposing beta-return relationship on different types of days continue to hold true, even for stock returns in recent years. Second, we provide two alternative ways of constructing the betting against beta factor, which addresses the critiques of its original construction. Furthermore, we show that the outperformance of the BOAB over the BAB is invariant to the way in which the betting against beta factor is computed. Third, we show that the proposed factor rivals standard asset pricing factors such as value, size, and momentum in terms of economic magnitude and significance. This suggests that the BOAB factor could be used as a control in explaining excess returns in future asset pricing research.
This research adds value to existing literature by bridging the gap between documenting empirical facts regarding asset price behavior and suggesting a trading strategy that capitalizes on these findings. Namely, this paper captures fact that the CAPM holds on a subset of trading days and not others and provides a correction to the BAB strategy to take advantage of this fact. In addition to the empirical implications outlined above, the results of this research can also inform agents’ portfolio choices and asset allocations.
Research Limitations
The results in this study is subject to some limitations. First, results in this study are limited to the U.S. stock market and its response to U.S. macroeconomic events. Therefore, the results of this research does not provide commentary on other asset classes nor other economies. Second, results in this study consider macroeconomic events as a whole. This study does not intend to comment on whether these macroeconomic events are positive or negative overall. This simplification is necessary as it is difficult to classify macroeconomic events as positive or negative objectively. The contribution of this paper is to fill a vacancy between documenting the behaviors of asset prices on a subset of trading days and proposing a trading strategy to take advantage of these behaviors. Therefore, this paper does not engage with existing research which explains beta-return relationships through investor disagreement regarding whether times are good or bad (Antoniou et al., 2016; Hong & Sraer, 2016).
Suggestions for Future Study
Given the above limitations, a related and interesting avenue for future research is to examine the behavior of individual stocks as opposed to portfolios. Focusing on the earnings of individual stocks would allow us to objectively categorize news events as positive or negative news. For example, if a stock beats earnings expectations, we would categorize the event as a positive event.
Furthermore, from a theoretical perspective, we are motivated to study earnings events because earnings announcement days also correspond to days of larger volatility among individual stocks and across the general market. While stock-specific catalysts and events are hard to predict and may occur less frequently, earnings releases are similar to the macroeconomic dates as their dates are also scheduled and generally announced within a few weeks of the actual release, barring surprise announcements. We may also relate this back to the work done in this paper to understand whether our results are driven by announcement days or more generally by periods when risk premia are high, as is often the case around earnings.
Footnotes
Acknowledgements
Not applicable.
Declaration of Conflicting Interests
The author(s) declared no potential conflicts of interest with respect to the research, authorship, and/or publication of this article.
Funding
The author(s) disclosed receipt of the following financial support for the research, authorship, and/or publication of this article: The research is supported by the Doctoral Research Start-up Fund of Jiangxi Science and Technology Normal University (1904251462).
Ethical Approval
Not applicable.
Data Availability Statement
Data sharing not applicable to this article as no datasets were generated or analyzed during the current study.