
Abstract
This study provides new insights to predict the excess return of a security. As if factor premia are getting influenced by the sentiments that means sentiments are ultimately affecting the excess return of a security. To meet the objective, a composite index developed by Baker and Wurgler is used as sentiment proxy. Monthly data are used from July 1965 to September 2015 in U.S. context. Granger casualty, Vector Autoregression (VAR), and Fama–Macbeth regression are applied to get the results. Results show that investor sentiments significantly drive the Fama factors’ premia: size premium and profitability premium. Sentiments also contain some information to explain the investment premia but fail to explain the market risk premium and value premium. Furthermore, results suggest that sentiments increase the explanatory power of model measured by R square. In short, this study suggests that investor sentiments play a role in explaining the Fama–French five-factor premia.
Keywords
Introduction
Premium is an important feature for bearing the risk, more specifically the systematic risk, in stock market. Fama and French (1993, 2015) attempt to explain the premia, that is, market risk premium (Mkt-Rf), size premium (SMB [Small Minus Big]) and value premium (HML[High Minus Low]), profitability premium (RMW [Robust Minus Weak]), and investment premium (CMA [Conservative Minus Aggressive]). Rational asset pricing theories interpret these premia as a compensation to bear the systematic risks which is not captured by the market factor (Berk et al., 1999; Chan & Chen, 1991; N. F. Chen and Zhang, 1998; Chordia & Shivakumar, 2002; Fama and French, 1993; Liu & Zhang, 2008). On the other side, behavioral theories view these premia as limits to arbitrage or behavioral biases (Barberis et al., 1998; Daniel & Titman, 1997; Lakonishok et al., 1994). Market sentiments exert a persistent effect on prices of risky assets if the premia factors get influenced by the sentiments.
To predict the market premia and excess return of stock market, prior studies have used a range of variables including financial ratios and macroeconomic fundamentals. The question of whether market sentiments also predict the excess returns of stock market has caught the considerable attention of researchers over the last two decades. Many studies (Baker et al., 2012; Baker & Wurgler, 2006; Barberis et al., 1998; Habibah et al., 2017; Ho & Hung, 2009; Huang et al., 2014) provide insights on stock returns predictability through investor sentiments. Some researchers confirm the Stock returns predictability through investor sentiments (Baker et al., 2012; Baker & Wurgler, 2006; Habibah et al., 2017; Ho & Hung, 2009) and some researchers find the contradicting evidences depicting that investor sentiments play no role in stock returns predictability (Jansen & Nahuis, 2003; Kling & Gao, 2008).
This study contributes in existing literature by employing the sentiment index developed by Baker and Wurgler (2006, 2007) to explain the Fama–French five-factor premia. This is a composite index using the principal components of different sentiment proxies: the dividend premium, the closed-end fund discount, the number of initial public offerings (IPOs), first-day returns on IPOs, and the equity share in new issues. This study is related to Shamsuddin and Kim (2015) who examine the dynamic effect of Fama–French three factor premia (market premium, size premium and value premium) along with the momentum premium with on series of investor sentiment proxies. However, this study differs from theirs by adopting a composite sentiment index to explore the association between the investor sentiments and Fama–French five-factor premia. This study also adds in literature by adding the sentiment as an additional factor to capture the variations unexplained by five factors. Granger (1969) Causality test is applied to test the causal relationship between sentiments and Fama–French five-factor premia. Results of Granger causality are then supported by VAR models. Furthermore, Fama–Macbeth regression is performed to compare the explanatory power of model with and without the sentiments.
This article contributes in literature by providing new evidences that investor sentiments significantly drive the Fama–French factors’ premia (FFP); size premium (SMB) and profitability premium (RMW). Sentiments also contain some information to explain the investment premium (CMA) but fail to explain the market risk premium (Mkt-Rf) and value premium (HML). These finding suggest that investor may use the Baker and Wurgler sentiment index to predict the changes in excess return of securities. As the sentiment are explaining the Fama–French five-factor premia, ultimately it will be able to explain the excess return of securities. Further, regression coefficients of investor sentiments are significant in some portfolios; size & B/M, size & OP, OP & Investment, Size & B/M &Investment, Size & B/M &OP, and Size & OP & Investment. This shows the significance of investor sentiments that sentiments may be added as an additional factor to explain the portfolio’s returns.
This article proceeds as follows: Second section provides the review of literature review followed by data in the third section. Methodology and empirical results are reported in the fourth section, and final section concludes the article.
Review of Relevant Literature
Basically, Stock market is a typical complex system with different types of agents (Stauffer & Sornette, 1999) generating lots of financial anomalies which do not conform to the Efficient Market Hypothesis. These financial anomalies open the doors for behavioral finance theories. Research in behavioral finance argue that investors are not fully rational. Their behavior in stock market get influenced by many irrational factors like information asymmetry, herding, overconfidence, and many other irrational factors (Barberis et al., 1998; Daniel et al., 1998; De Long et al., 1990; Hong et al., 2000). An individual investor, as an important kind of agent in stock market, may affect the movements of the market price and volatility. Their sentiment waves affect the individual firms and the stock market as a whole (Baker and Wurgler, 2006, 2007).
Investor sentiment can be measured through direct measures and indirect measures. Direct measures are based on surveys (Brown & Cliff, 2005; Fisher & Statman, 2000), while indirect measures use the market-based proxies (Baker & Wurgler, 2007). Lee et al. (2002) utilize the investors’ intelligence sentiment survey as a direct measure, and report that sentiment is a priced systematic risk. VIX (Volatility Index) is used as sentiment proxy by Giot (2005); Habibah et al. (2017); Simon and Wiggins (2001); and Whaley (2000), while Schmeling (2009) use the consumer confidence proxy. On the other hand, Da et al. (2015) use daily internet search volume to construct a Fear’s index as a measure of market-level investor sentiment.
Furthermore, the findings of Verma and Verma (2020) also suggest that institutional investors have a significant power to cause pricing errors due to unpredictable changes in their sentiments, while small investors lack such ability to move stock prices away from their intrinsic values. Concetto and Ravazzolo (2019) also investigated the effect of investor sentiment on returns of stock market and evaluated the predictability power of sentiment indices on returns of U.S. and European Union stock market.
In addition, Shamsuddin and Kim (2015) find that investors revise their sentiment upward in response to the advisor sentiments that show the flow of sentiment from more informed market agent to less informed market agent. While investors’ extrapolative sentiments have positive correlation with the stock market returns (Greenwood & Shleifer, 2014). The dynamic effect of investor sentiment and premium factors (Carhart, 1997; Fama & French, 1993) is examined by Shamsuddin and Kim (2015). They find that premium factors have strong dynamic effects on investor sentiments rather than otherwise. They study the Fama–French three premium factors (Fama & French, 1993) along with momentum premium (Carhart, 1997) with a range of investor sentiment proxies, namely the implied market volatility, investment advisor sentiment, and individual investor sentiment. Durand et al. (2011) also found that the variation in the expected return of Fama–French 3 factors and the momentum factor are to be predicted by change in VIX which is taken as investor sentiment measure by many authors (e.g., Sadhwani et al., 2018). So this leads to the given hypotheses:
In short, this study is an attempt to provide another brick in building the relationship between investor sentiments and Fama–French Factors’ Premia (FFP).
Data
This study uses the monthly data from July 1965 to September 2015. Fama and French five factors’ data are obtained from data library of Kenneth R. French (can be accessed at http://mba.tuck.dartmouth.edu/pages/faculty/ken.french/data_library.html) and the investor sentiment index data are taken from Jeffrey Wurgler’s website (http://people.stern.nyu.edu/jwurgler/). To calculate the sentiment index value, Baker and Wurgler followed two approaches. In the first, sentiment index value is based on first principal component of five (standardized) sentiment proxies that are Value-weighted dividend premium, First-day returns on IPOs, IPO volume, Closed-end fund discount, and Equity share in new issues. While in the other, the sentiment index value is based on first principal component of five (standardized) sentiment proxies where each of the proxies has been orthogonalized with respect to a set of six macroeconomic indicators that are Nominal durable consumption, Nominal nondurable consumption, Nominal services consumption, NBER Recession indicator, Employment and Consumer price index. The former index value is denoted with SENTa and later denoted as SENTb.
As it is the time series data, so the first assumption to be satisfied is to check for statistical stationarity of variables taken in the analysis. Im, Pesaran and Shin statistics, Augmented Dickey–Fuller (ADF; Dickey & Fuller, 1981) chi-square, and Phillips–Perron (PP)-chi-square statistics are applied to check the stationarity of data.
Table 1 reports the descriptive statistics of variables taken in this study for the period of July 1965 to September 2015. Results depict that MKT_RF has the highest variation in all five factors and both sentiment indices; SENTa and SENTb have the same standard deviation.
Descriptive Statistics.

Note. This table reports the descriptive statistics of sentiments index and FFP. The variables are Baker and Wurgler’s sentiment indices (SENTa and SENTb) and Fama–French five factors including MKT_RF, SMB (Small minus Big), HML (High minus Low), RMW (Robust minus Weak), and CMA (Conservative minus Aggressive). This analysis uses the monthly data from July 1965 to September 2015.
To check the stationarity of variables, ADF and PP tests are applied on level and first difference of data series. Results are shown in Table 2 depicting that all variables are stationary at level.
Unit-Root Test Results.

Note. This table reports the Augmented Dickey-Fuller (ADF) test statistic and Phillips-Perron (PP) test statistic for stationarity checking. The variables are Baker and Wurgler’s sentiment indices (SENTa and SENTb) and Fama–French five factors including MKT_RF, SMB (Small minus Big), HML (High minus Low), RMW (Robust minus Weak), and CMA (Conservative minus Aggressive). This analysis uses the monthly data from July 1965 to September 2015.
Refers to significance at 5%. ***Refers to significance at 5%.
Methodology and Results
To test the causal relationship between variables, Granger (1969) Causality test is applied. Granger causality is such statistical method which is used to determine either one variable drive the other one. To find the causal relationship between FFPs and investor sentiments, following Granger Causality model is used:
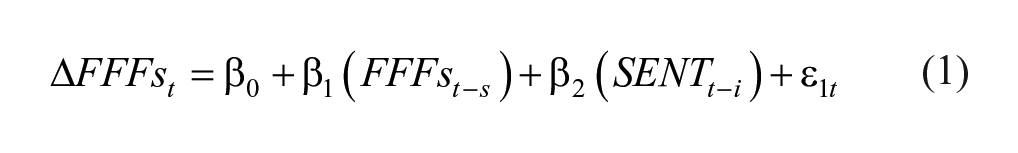

Here, FFP stands for Fama–French five Factors: Mkt-Rf, SMB, HML, RMW, and CMA. Mkt-Rf is return on value weighted market portfolio minus risk-free return, SMB is the difference of return on diversified portfolios of small stocks and big stocks, HML is the difference of returns on diversified portfolios of high and low B/M (book to market) stocks, RMW is the difference between the returns on diversified portfolios of robust profitability and weak profitability stocks, and CMA is the difference between the returns on diversified portfolios of low and high investment firms, simply called as conservative minus aggressive firms.
Furthermore, the SENT stands for Baker and Wurgler sentiments index (SENTa and SENTb) which consists of five proxies: Closed-end fund discount, NIPO (number of IPOs), RIPO (the average first-day returns), Equity share (gross equity issuance divided by gross equity plus gross long-term debt issuance), and dividend premium (the log difference of the average market-to-book ratios of payers and nonpayers). P and q define the lags of SENT and FFP, respectively.
Table 3 shows the results of Granger causality (GC). Granger (1969) causality demonstrates whether variations in factor investor sentiments “cause” variations in FFPs, or if variations in FFPs cause variations in investor sentiments, or if variation in investor sentiments and FFPs cause each other. The GC test does not show the direction either there is positive correlation between investor sentiments and FFPs or negative. But the direction could be explained by the VAR models which are discussed after this.
Granger Causality Results.
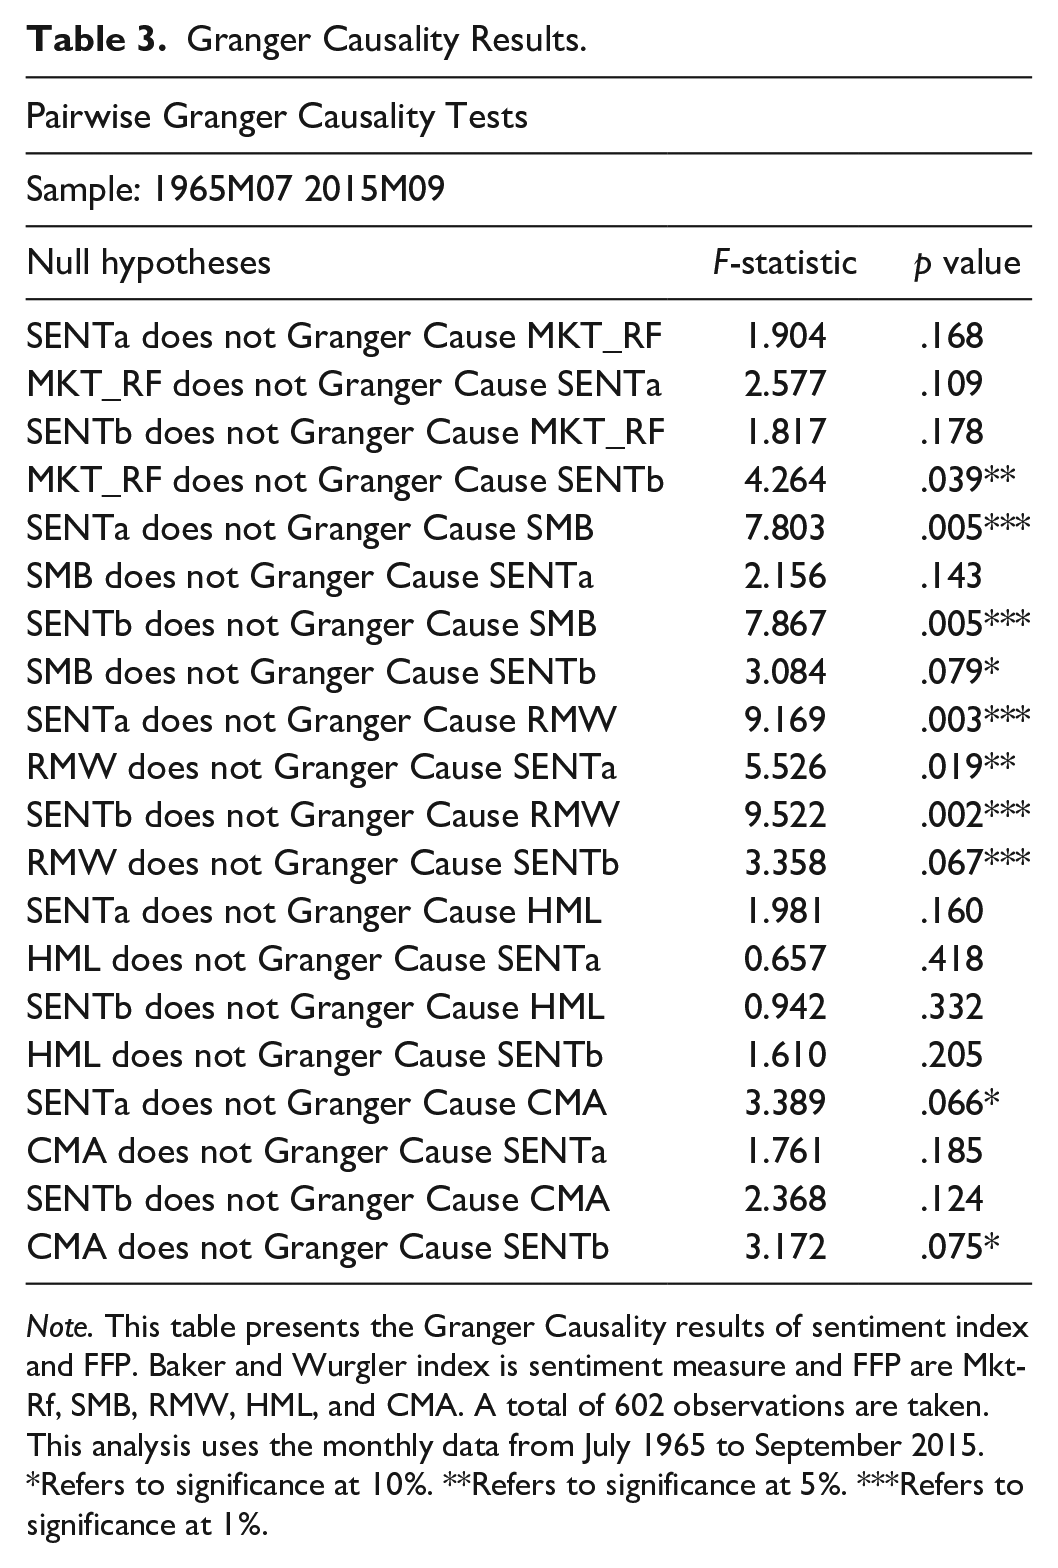
Note. This table presents the Granger Causality results of sentiment index and FFP. Baker and Wurgler index is sentiment measure and FFP are Mkt-Rf, SMB, RMW, HML, and CMA. A total of 602 observations are taken. This analysis uses the monthly data from July 1965 to September 2015.
Refers to significance at 10%. **Refers to significance at 5%. ***Refers to significance at 1%.
Results show that in case of Mkt-Rf and HML, we do not reject the null hypothesis depicting that sentiments do not cause the Mkt-Rf and HML. On the other side, HML do not have causal effect on variations in sentiments but Mkt-Rf somehow explains the variations in sentiments. In case of SMB and RMW, we reject the null hypothesis and depict that variations in sentiments cause the variations in SMB and RMW. Furthermore, variations in SMB and RMW also cause the variations in sentiments. While in case of CMA, both are somehow causing each other but the significance level is not as much as the SB and RMW.
These findings suggest that as the factor premia (SMB, RMW, and CMA) are getting influenced by the sentiments, then investor sentiments exert an effect on prices and expected return of securities under the Fama–French five-factor model. According to the Fama–French five-factor model, expected return of a security is explained by factor premia. So, in short, investor sentiments are ultimately affecting the expected returns of securities through causing the variation in factor premia.
Results of Granger causality are then supported by VAR models. Equation 3 represents the general VAR model.

Results of Granger causality are supported by the VAR model. Results, given in Table 4, estimate the vector auto-regression model (using Equation 3) for each factor premia separately as an endogenous variable. Before applying VAR, an adequate lag length is chosen. The study applies lag order selection based on likelihood ratio (LR) test statistics and information criteria such as Final Prediction Error (FPE), Akaike Information Criterion (AIC), Schwarz Information Criterion (SC), and Hannan–Quinn Information Criterion (HQ). The results (shown in Table 5) recommended one lag. VAR Lag order selection criteria’s results are shown in Table 5. So, for VAR model, one lag is considered. Lag consideration is on the basis of AIC, SC, and HQ criteria.
Results of VAR.
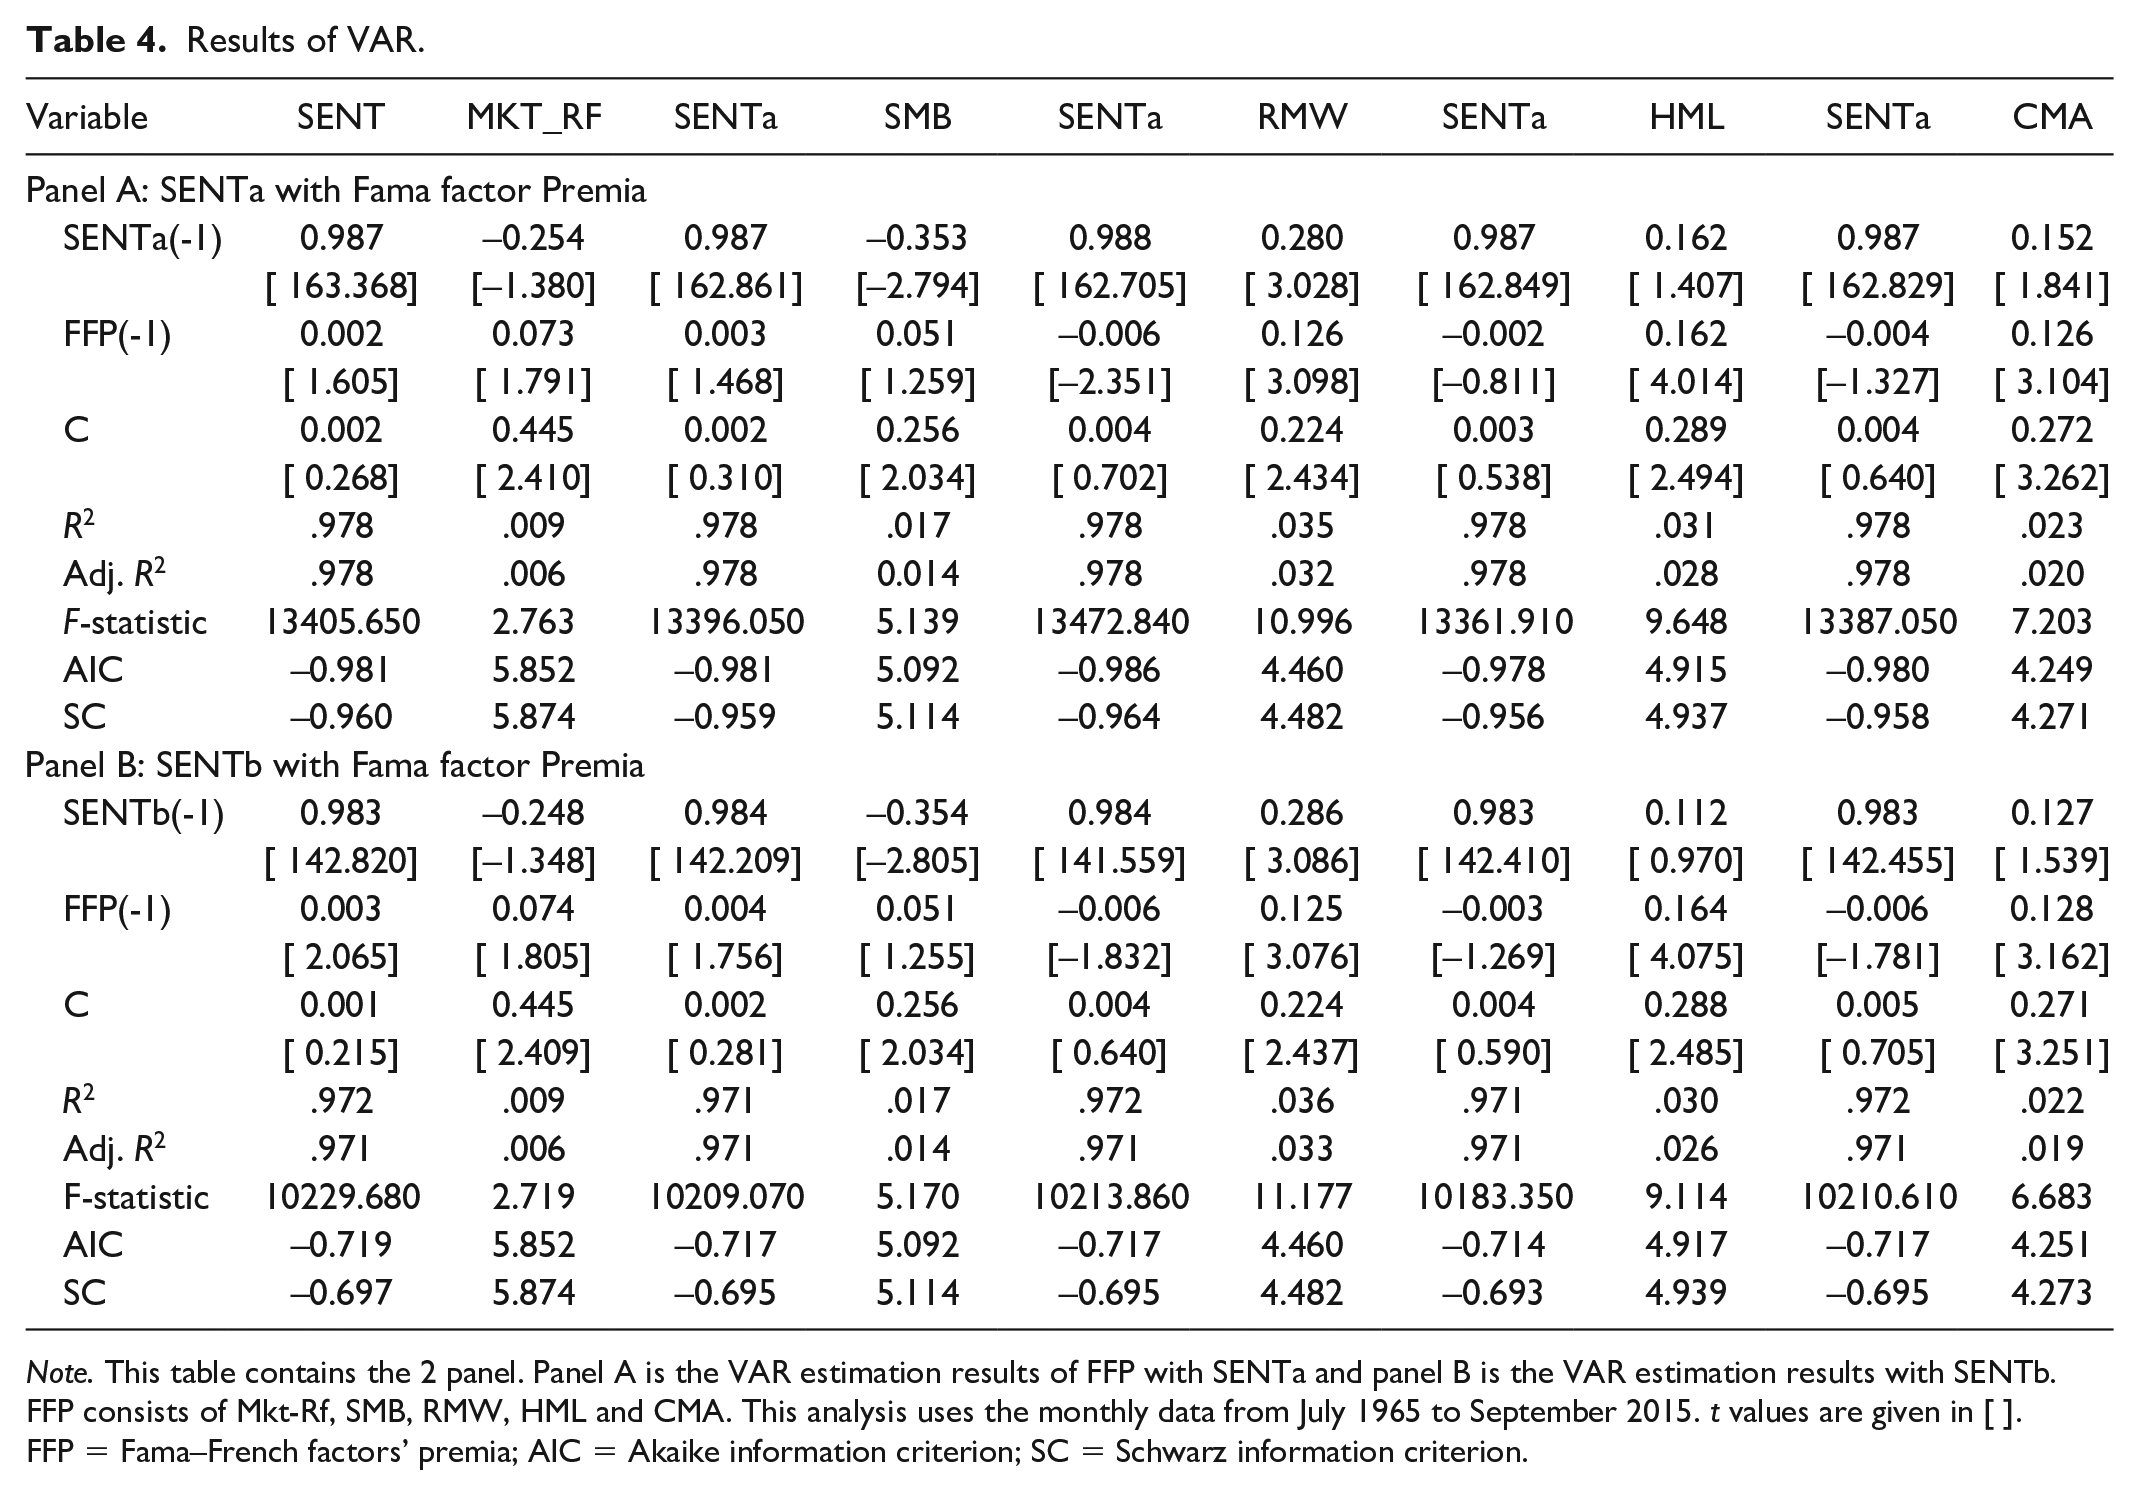
Note. This table contains the 2 panel. Panel A is the VAR estimation results of FFP with SENTa and panel B is the VAR estimation results with SENTb. FFP consists of Mkt-Rf, SMB, RMW, HML and CMA. This analysis uses the monthly data from July 1965 to September 2015. t values are given in [ ]. FFP = Fama–French factors’ premia; AIC = Akaike information criterion; SC = Schwarz information criterion.
VAR Lag Order Selection.

Note. FPE = final prediction error; AIC = Akaike information criterion; SC = Schwarz information criterion; HQ = Hannan–Quinn information criterion.
indicates lag order selected by the criterion.
VAR results show that, for the Mkt-Rf, first lag of sentiments has statistically insignificant negative relationship with the Mkt-Rf factor premia. On the other side, first lag of Mkt-Rf factor premia is somehow defining the sentiments with the positive coefficient parameter. These findings support Whaley (2009) interpretation that when market sentiments are high then market participants are induced to rebalance their portfolios by investing in less risky asset class. As a result, stock returns immediately decline.
For the SMB factor premia, first lag of sentiments is defining the SMB factor premia with the negative coefficient parameter and first lag of SMB factor premia is also somehow defining the sentiments with the positive coefficient parameter. These findings suggest that when sentiments are high, investors prefer to invest in big firms, and when sentiments are low, investors prefer to invest in small firms. In other words, investors move from small firms to big firm in case of low sentiments following the flight to quality theory. According to this theory, investors start moving their money (capital) away from the riskier investment and invest in safest option. Small firms are considered as more risky than big firms. So withdrawing capital from small firms and investing in large firms shows the “flight to quality” mode of investors.
In case of CMA factor premia where first lag of sentiments is somehow defining the CMA factor premia but the coefficient parameter is positive and first lag of CMA factor premia is also somehow defining the sentiments with the negative parameter coefficient. While in the case of HML factor premia, first lag of sentiments and HML factor premia are positively related. This relation is not statistically significant. Same as stated by Baker and Wurgler (2007) that firms with high B/M ratio are relatively less influenced by sentiments. In case of RMW, first lags of sentiments and RMW factor premia are significantly explaining each other depicting that investor sentiments predict the excess return of security by explaining the RMW, profitability premium.
One may interpret as BW index conveys information about excess return of securities but it is not fully reflecting the Fama–French five-factor premia.
Furthermore, Fama–Macbecth (1973) regression is applied to test how investor sentiments explain the asset returns along with the Fama–French five-factor premia. It involves two steps: The first step is regressing the each portfolio’s return against investor sentiments along with Fama–French five-factor premia. This step determines how exposed each portfolio’s returns are to the investor sentiments and to the Fama–French five-factor premia. This step gives the factor exposure
In the second step, the portfolios’ cross section returns are regressed on the βs calculated in first step. This gives time series of factor coefficients. Fama–Macbeth regression calculates averages of these coefficients and gives the expected premia for every factor exposure to each factor, including investor sentiments and Fama–French five-factor premia.
The first step regression is given as follows:


Here
The second step regression is given as follows:


Here
Table 6 reports the results of Fama–Macbeth regression in which investor sentiment is added as an additional factor to FFP. While in Table 7, each Fama factor premia is added with investor sentiment separately. This process is done to see the influence of investor sentiments more precisely. Table 6 shows that regression coefficient of investor sentiments is significant in some portfolios: Size & B/M, Size & OP, OP & Investment, Size & B/M & Investment, Size & B/M & OP, and Size & OP & Investment. This shows the significance of investor sentiments that sentiments may be added as an additional factor to explain the portfolio’s returns.
Fama–Macbeth Regression (Sentiment as an Additional Factor to FFP Collectively).
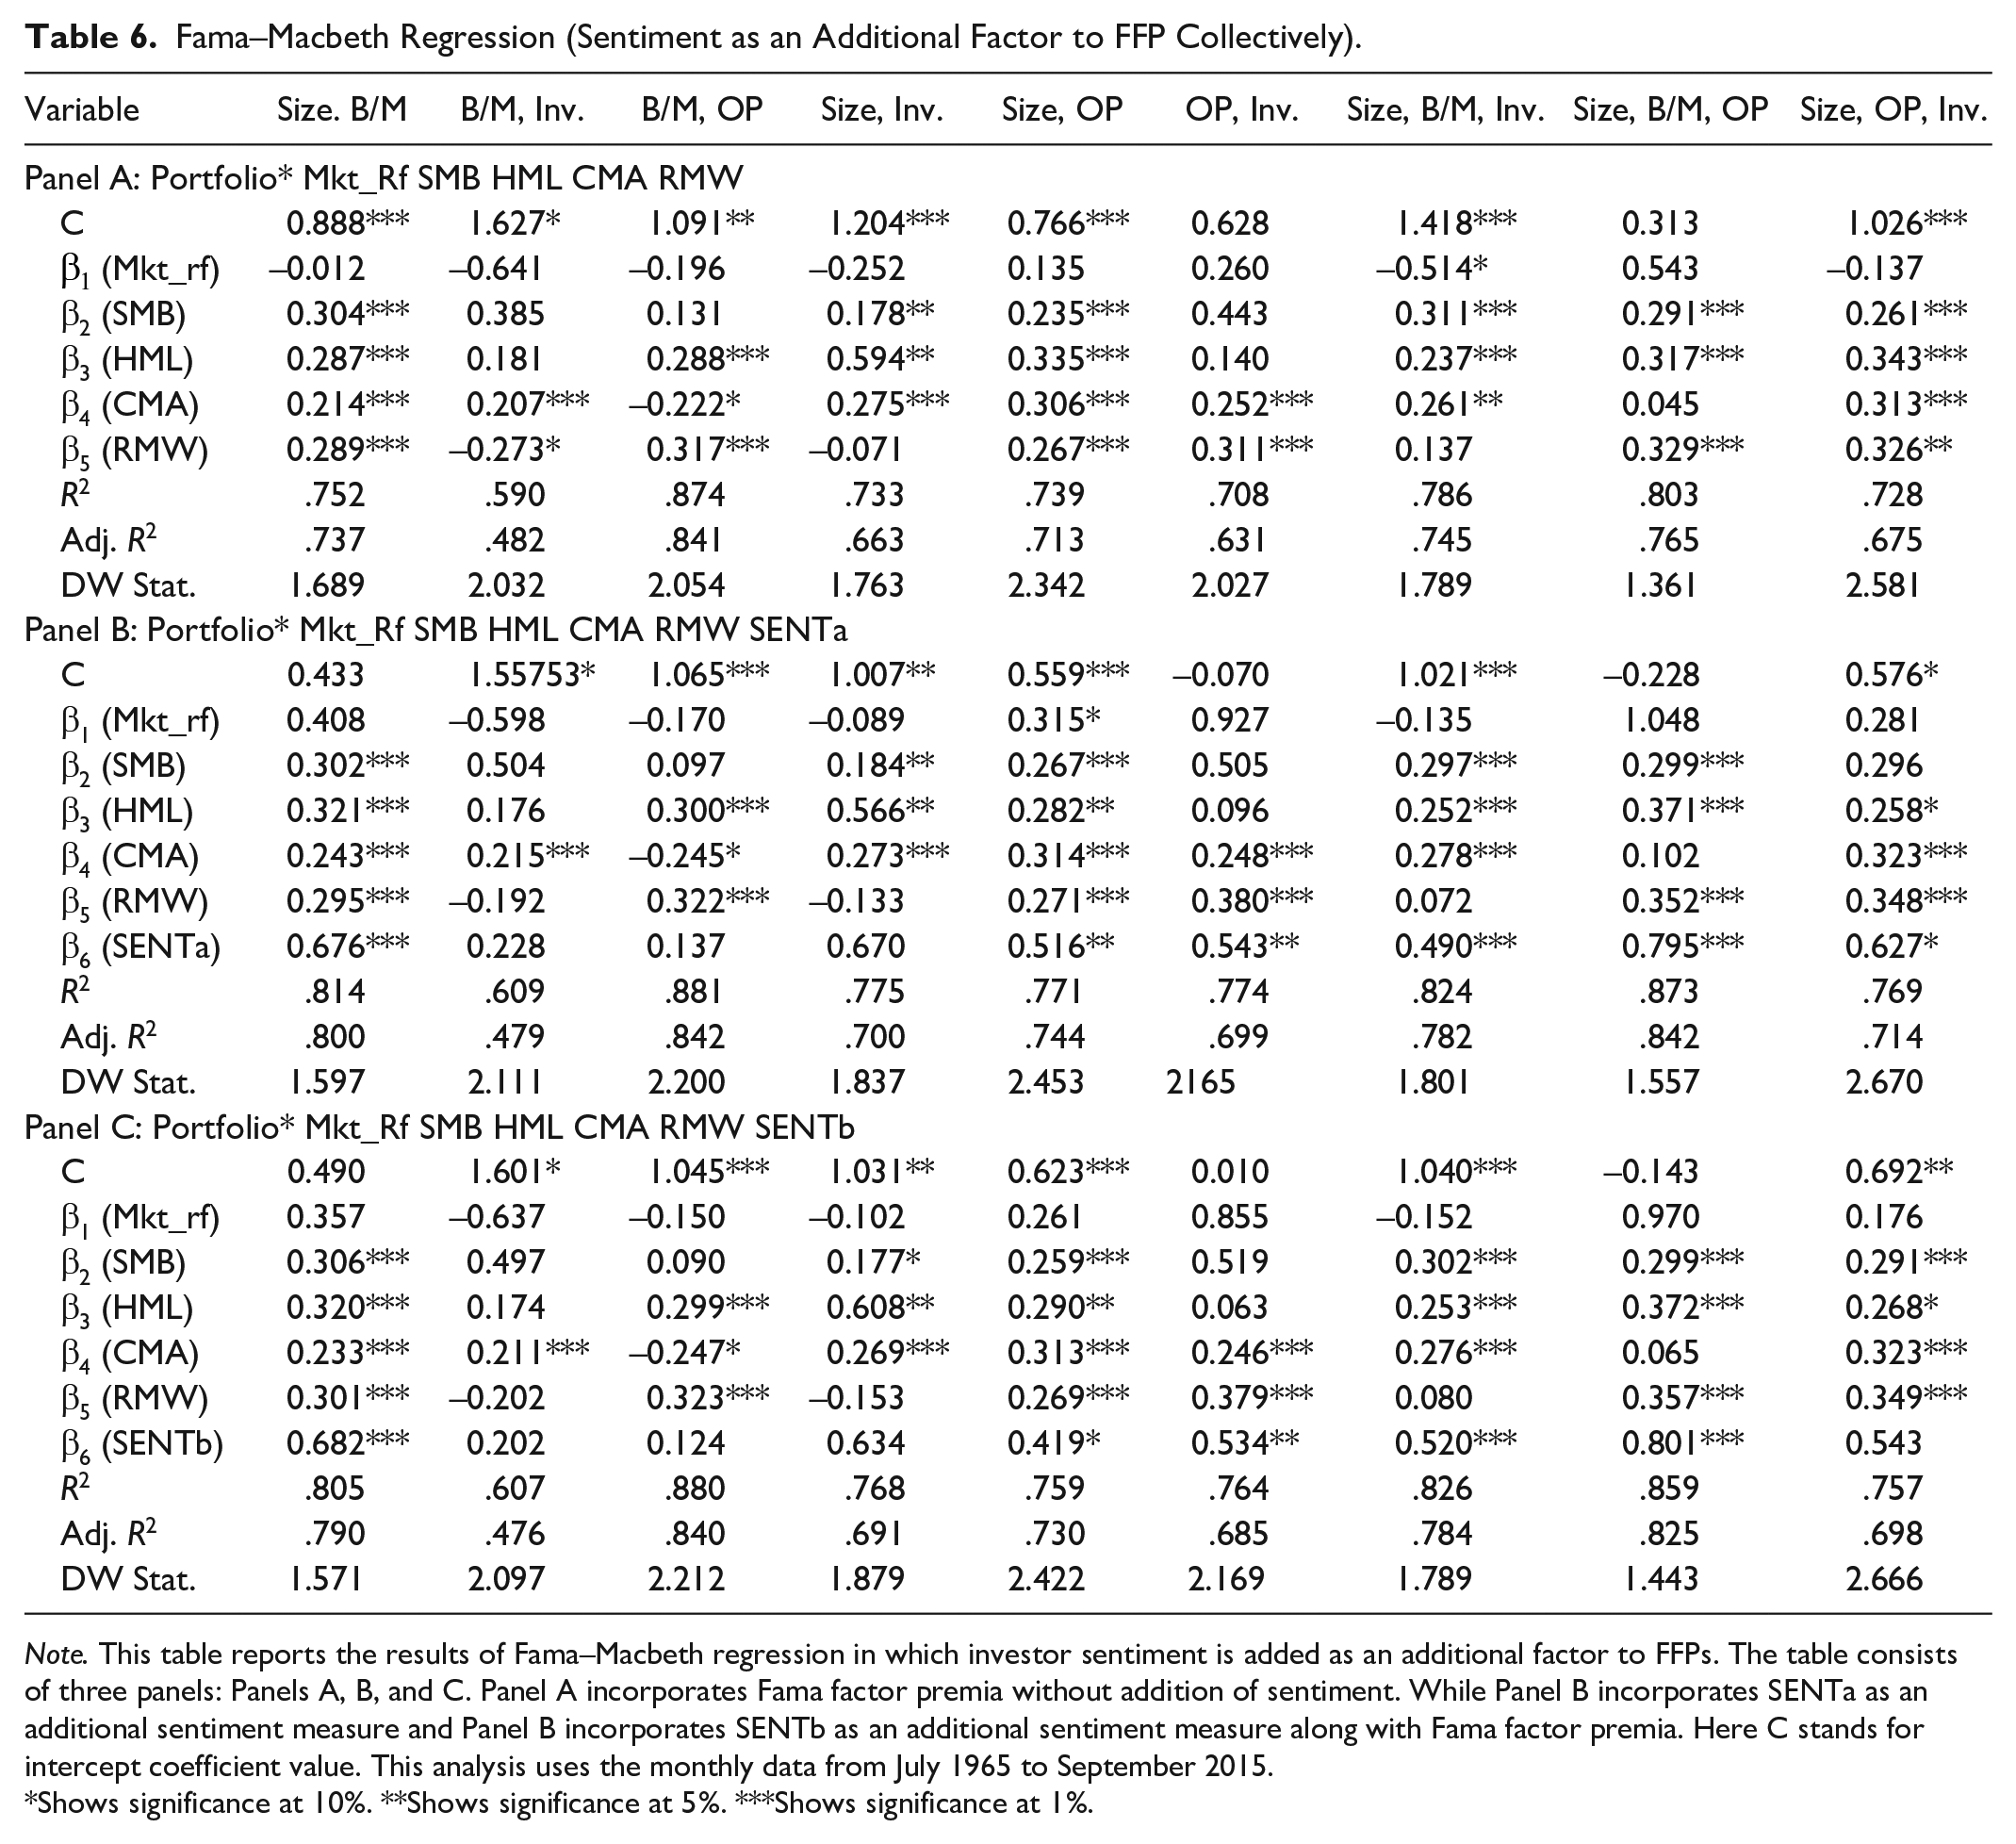
Note. This table reports the results of Fama–Macbeth regression in which investor sentiment is added as an additional factor to FFPs. The table consists of three panels: Panels A, B, and C. Panel A incorporates Fama factor premia without addition of sentiment. While Panel B incorporates SENTa as an additional sentiment measure and Panel B incorporates SENTb as an additional sentiment measure along with Fama factor premia. Here C stands for intercept coefficient value. This analysis uses the monthly data from July 1965 to September 2015.
Shows significance at 10%. **Shows significance at 5%. ***Shows significance at 1%.
Fama–Macbeth Regression (Sentiment as an Additional Factor to FFP Individually).
Note. This table reports the results of Fama–Macbeth regression in which investor sentiment is added as an additional factor to each FFPs. The table consists of two panels: Panel A and Panel B. Panel A incorporates SENTa as sentiment measure and Panel B incorporates SENTb as sentiment measure. Here C stands for intercept coefficient value. This analysis uses the monthly data from July 1965 to September 2015.
Shows significance at 10%. **Shows significance at 5%. ***Shows significance at 1%.
Comparing the statistical results of Panel A (Table 6) with Panels B and C, it is found that addition of sentiment reduced the size and significance of intercept depicting that sentiments have captured some of the variations which is also evidenced by the significant coefficients of sentiments in Panels B and C. Almost all other coefficients becomes insignificant/less significant/reduced in size with addition of sentiments.
Like coefficient of SMB becomes statistically insignificant (Panel B) and reduces in size (Panel C) in case of Size & B/M portfolio, coefficient of RMW becomes insignificant in case of B/M & Investment portfolio, coefficient of SMB becomes less significant (Panel C) in case of Size & Investment portfolio, coefficient of RMW becomes less significant in case of Size & Operating Profit portfolio and Investment & Operating Profit portfolio, and coefficient of HML becomes less significant in case of Size & operating profitability & Investment portfolio with addition of sentiments.
In addition, comparing the statistical results of Panel A (Table 7) with panels B and C, it is found that addition of sentiment reduces the size and significance of intercept depicting that sentiments play a significant role along with other factor premia. Results show that coefficient of sentiment is statistically significant in most of the cases confirming the results reported in Table 6.
It is also noted that investor sentiment as an additional factor increases the explanatory power of model measured in terms of R-square value. Furthermore, sentiment reduce the explanatory power of all other factors (see Table 6).
Conclusion
It is evident from prior researches (i.e., Baker & Wurgler, 2006; Shen et al., 2017) that financial securities are not rationally priced when investor sentiments are high. However, very limited research has been done to develop a model incorporating the sentiment as an additional factor to capture the stock market variations.
In this study, sentiment is taken as an additional factor to Fama & French five-factor model. Along with this, effect of sentiment on five-factor premia and vice versa is also analyzed by applying the VAR and Granger causality tests. This study incorporates composite investor sentiment index developed by Baker and Wurgler (2006, 2007) using the principal components of different sentiment proxies. This index is widely being used by many studies to measure the investor sentiments. Results conclude that investor sentiments contain some information to explain the Fama–French five-factor premia specially profitability premium, size premium, and investment premium. Results of Granger Causality tests suggest that sentiments drive FFP (RMW, SMB, and CMA), while sentiments fail to drive Mkt-Rf and HML. This study depicts that value premium, profitability premium, and investment premium increase in the span of high sentiments (a positive relationship) and market risk premium and size premium increase in the span of low sentiment (a negative relationship).
This study provides new insights to predict the excess return of a security. As if factor premia are getting influenced by the sentiments that means sentiments are ultimately affecting the excess return of a security. Furthermore, sentiments are easy to understand for all kind of investors, especially the investors do not knowing complex investment decision-making process and do not having the access to the market (insider) information. So, by taking sentiment index into consideration, investor can go for the optimal decision making.
Furthermore, it is also evident from results that addition of sentiment increases the explanatory power of model measuring in terms of R-square. The significant effect of sentiments is justifiable in many reasons, as change in government monetary and fiscal policy decisions affect the general business environment in any country. Furthermore, profitability and riskiness of any firm is affected by the capital budgeting and capital structuring decisions of any firm and firms’ profits and their market shares is affected by the way in which firms operate. These all actions create the sentiments in market (Hilliard et al., 2016).
Footnotes
Author Contributions
All authors contributed equally.
Declaration of Conflicting Interests
The author(s) declared no potential conflicts of interest with respect to the research, authorship, and/or publication of this article.
Funding
The author(s) received no financial support for the research, authorship, and/or publication of this article.
Availability of Data and Material
The data sets analyzed during the current study are available from the corresponding author on reasonable request.