
Abstract
This study examines asymmetric and the lag effects of oil price, gas price, and exchange rate on stock performance of the Malaysian oil and gas sub-industries. Using company-level data and multi factor asset pricing models, this study found that oil price, gas price, exchange rate, and common systematic risk factors such as market, size, and book-to-market have significant effects on the stock performance of Malaysian oil and gas sub-industries, but these exposures remain heterogeneous. Oil price and exchange rate show strong asymmetrical impacts on stock performance when decomposed into oil price increases (decreases) and exchange rate depreciation (appreciation). Increases in oil price and exchange rate depreciation have a greater impact on stock performance of oil and gas industry than decreases in oil price and exchange rate appreciation. Oil price, gas price, and exchange rate exhibit lag effects on the performance of oil and gas stocks. The findings have important asset pricing implications for profitable investment and portfolio strategies based on oil and gas risk factors for oil-exporting country.
Introduction
The Malaysian oil and gas (O&G, hereafter) industry has over thousands of small and large companies, in which less than 40 firms are listed on the stock exchange’s main board. These Malaysian oil and gas firms have been price takers of international crude oil and gas prices, and their cash flows and stock prices are affected by the volatility in oil and gas prices (Malaysia Petroleum Resources Corporation, 2016). Energy market uncertainty also induces volatility in the profit and stock performance of O&G industry. Moreover, “as Malaysia is a net oil and gas exporter, exchange rates, therefore, also play an important role in influencing energy inventory prices” (Hoque et al., 2020a, 2020b). Figure 1 shows that the returns of the O&G industry react rapidly to oil and gas price fluctuations. Figure 1 also demonstrates the concurrent movements of O&G industry returns and exchange rate swings. In particular, the stock of O&G industry appreciates at a high margin in response to a marginal decrease in exchange rates and vice versa. In addition, Table 1 also indicates that profits and stock prices of O&G companies are vulnerable to the oil sector’s conditions and innovations. Therefore, it can be inferred that oil price, gas price and exchange rate are important factors of risk, which can affect O&G stock returns significantly.

Movements of oil industry portfolio returns with exchange rate, oil, and gas returns.
Changes in Earning Per Share and Stock Price of Selected Firms for Period of 2014 to 2017.
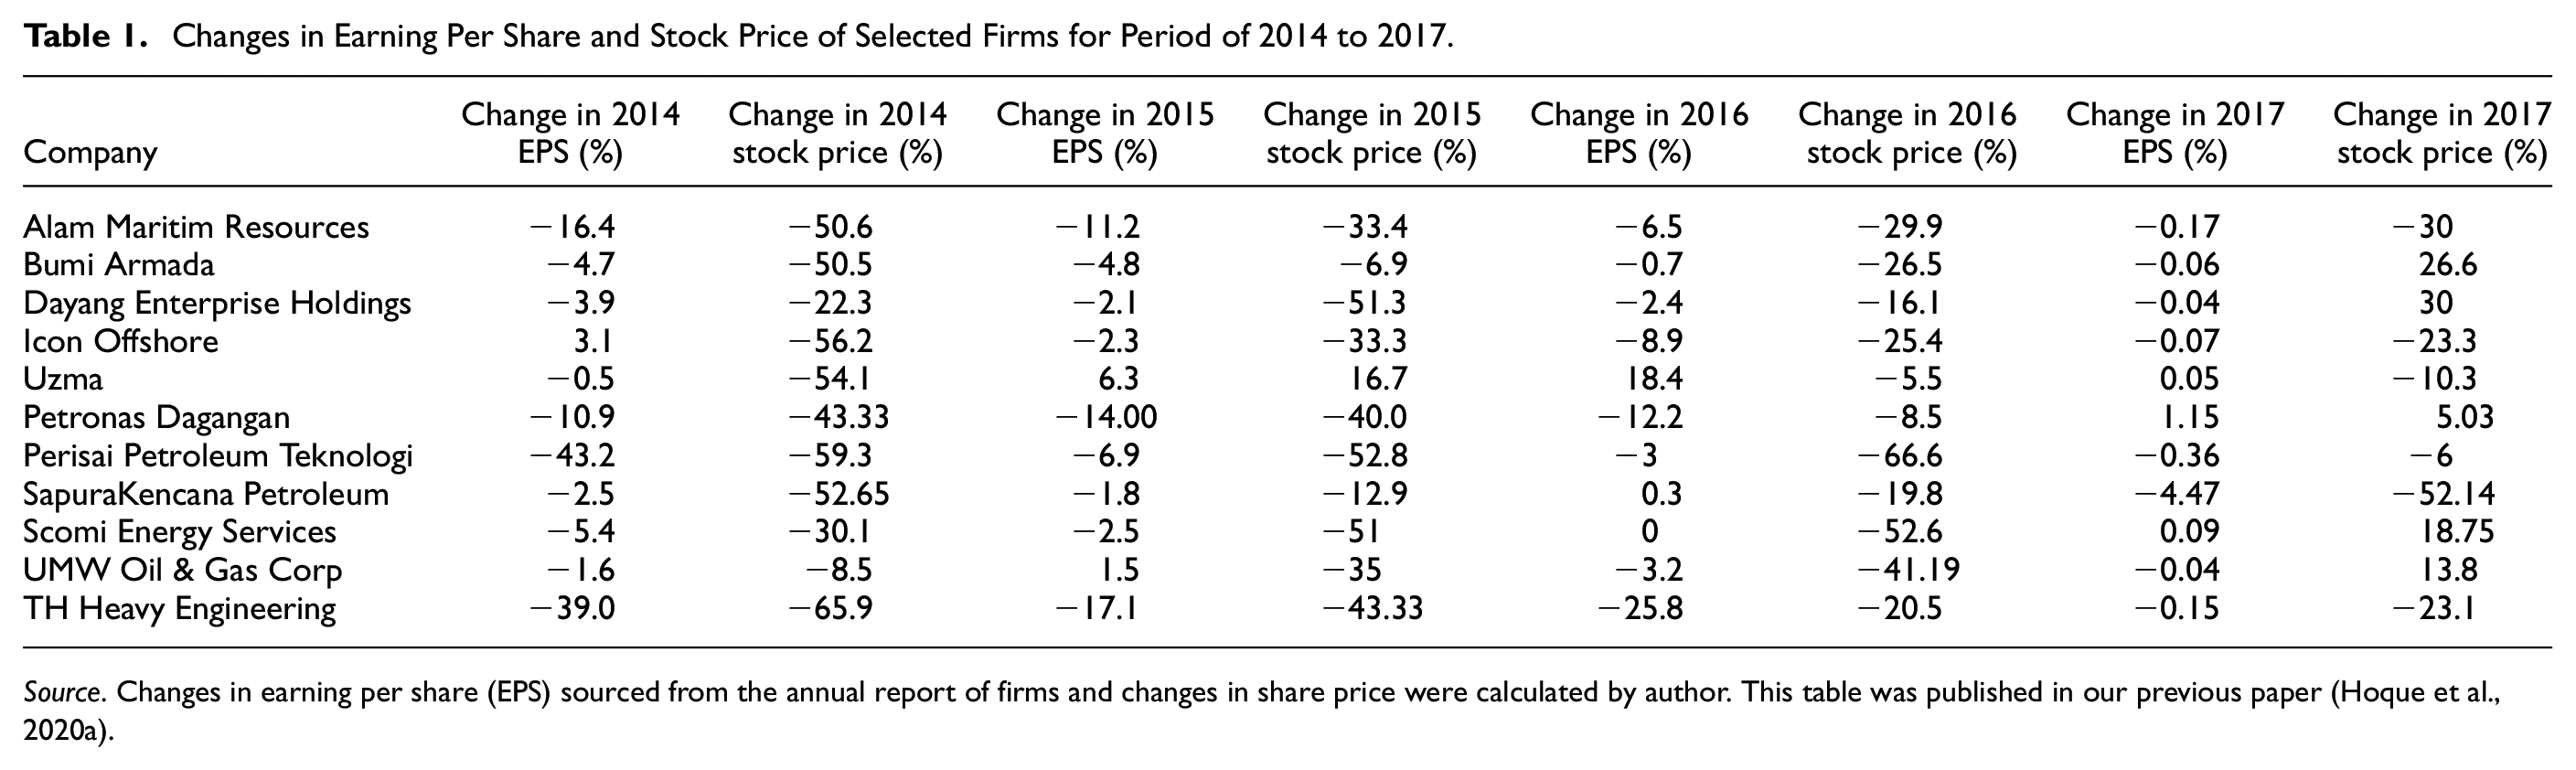
Source. Changes in earning per share (EPS) sourced from the annual report of firms and changes in share price were calculated by author. This table was published in our previous paper (Hoque et al., 2020a).
The cash flow of oil and gas (O&G) companies is highly affected by the fluctuations in the O&G markets, because O&G companies’ operating costs and profits are vulnerable to the volatility of oil and gas price. Certainly, fluctuations in the oil and gas price have a direct impact on O&G industry stock returns (see Kretzschmar & Kirchner, 2009; Ramos & Veiga, 2011; Ramos et al., 2017; Sanusi & Ahmad, 2016; Ulusoy & Özdurak, 2018). From a theoretical point of view, the theory of financial economics states that “any asset price should be determined by its expected discounted cash flows” (Filis, 2011, pp. 153), and any factor affecting expected discounted cash flows would influence asset or stock prices (Arouri & Rault, 2012; Hamilton, 1983; Huang et al., 1996; Lin et al., 2014). Therefore, changes in oil price, gas price, and exchange rate can also contribute to changes in cash flow, income, and shareholders’ expectation, thus leading inevitably to changes in equity price (e.g., Hamilton, 1983, Huang, 1996; Jones et al., 2004). On the basis of the above claims, oil price, gas price, and exchange rate can be inferred to be major risk factors for O&G stock price and return.
Existing empirical studies have identified several risk factors such as market, size, value, momentum, and oil price, gas price, and exchange rate that have significant impacts on oil and gas stock returns (e.g. Basher & Sadorsky, 2006; Boyer & Filion, 2007; Mohanty & Nandha, 2011; Mohanty et al., 2010; Narayan & Sharma, 2011, 2014; Phan et al., 2015; Sadorsky, 2001, 2008; Sanusi & Ahmad, 2016). Multifactor asset pricing models have been employed by most researchers to investigate the impact of the risk factor on O&G stock return (e.g Arouri et al., 2011; Carson, 2020; Janor et al., 2013; Mohanty et al., 2010; Narayan & Sharma, 2011; Phan et al., 2015; Ramos & Veiga, 2011; Sanusi & Ahmad, 2016). In previous studies, it has also been shown that oil price effects differ across the O&G sub-industry (e.g. Narayan & Sharma, 2011, 2014; Phan et al., 2015). This group of studies mainly focused on developed markets and economies. In addition, some of these studies find asymmetric trends (e.g. Kösedağlı, 2021; Narayan & Sharma, 2011, 2014; Ramos & Veiga, 2011; Sadorsky, 2001, 2008; Sanusi & Ahmad, 2016) and lag patterns (Phan et al., 2015; Sanusi & Ahmad, 2016) in the O&G stock price response to oil price risk factor. However, these studies have overlooked the asymmetric and lag effects of other O&G industry risk factors that may also influence O&G stock returns as much as the oil price risk factor.
Against this backdrop, this study explores asymmetric and the lag effects of oil and gas risk factors on O&G sub-industries returns. Similar to Mohanty and Nandha (2011), this study also considered oil and gas stocks and sub-industry classification. However, this research differs considerably from their study by examining the asymmetric and lag impacts of oil price change. Thus, this study extends Mohanty and Nandha’s (2011) study by offering new evidence on asymmetric and lag impacts of oil price on O&G sub-industries returns in oil exporting countries and emerging markets. Furthermore, this study contributes to the growing body of knowledge that O&G industry risk factors exhibit lag effect and supports Hong and Stein’s under-reaction theory/information diffusion hypothesis (1999 and 2000). Such findings also imply the existence of semi-strong form efficiency in the Malaysian O&G industry. Thus, arbitrage opportunities may exist for investors who want to invest in the Malaysian O&G stock. Moreover, this study also introduces new empirical findings that gas price and exchange rate factors exhibit asymmetric effects on O&G stock returns, alongside the asymmetric effects of oil price. These empirical results suggest that O&G industry risk factors including oil price, gas price, and exchange rate could have an asymmetrical impact on oil and gas sector stock returns. This study extends Ramos and Veiga (2011), Sadorsky (2001, 2008), and Sanusi and Ahmad (2016). Further, the results empirically support Mork’s (1989) and Mork et al.’s (1994) hypotheses by showing the asymmetric impact of O&G industry risk factors. The results provide additional empirical evidence for Mork’s (1989) and Mork et al.’s (1994) hypotheses that it also relates to other value-creating impacts of O&G industry risk factors within the oil and gas sector. This would then draw researchers’ interest in exploiting the asymmetrical patterns of other O&G industry factors in addition to the oil price factor.
The remaining paper is organized as follows. Section 2 presents the testable hypothesis of the study. The next section presents the empirical frameworks and dataset. Section 4 discusses the empirical findings and section 5 concludes the study.
Related Studies and Hypothesis
The hypothesis of asymmetric effect of oil price on stock return has been introduced by Mork (1989) and Mork et al. (1994). According to him, oil price increase has different effects on stock returns compared to oil price decreases. Increases in oil price are said to have a larger impact on stock market performance than decreases in oil price (Phan et al., 2015; Ramos & Veiga, 2011). The asymmetric impact of oil price changes on stock returns at market, industry, and company level has been documented in numerous studies (see, Basher & Sadorsky, 2006, Janor et al., 2013; Narayan & Sharma, 2011, 2014; Park & Ratti, 2008; Phan et al., 2015; Sadorsky, 2008). Furthermore, Mork’s asymmetric concept has been extended for different macro-economic factors and exchange rate factor is one of them. A ton of empirical studies has noted the asymmetric effect of exchange rate/currency on stock price (e.g., Bahmani-Oskooee & Saha, 2018; Bhutto & Chang, 2019; Salisu et al., 2020; Sikhosana & Aye, 2018). Bahmani-Oskooee and Saha (2016) documented the asymmetric effect of exchange rate/currency on Malaysian stock price.
With an emphasis on the O&G sector, Ramos and Vegas (2011) have shown that the oil and gas sectors are responding asymmetrically to the changes in oil price, and that increasing oil price have higher impacts than decreasing oil price. Mohanty et al. (2010) reported that increase in oil price had a favorable or negative effect on business share prices. They explained that the rise in oil price had a favorable impact on the profits of oil and gas firms by allowing oil and gas companies to increase their profits. Similarly, Mohanty and Nandha (2011) also demonstrate evidence that fluctuations in oil price impact equity returns asymmetrically at the stock market and industry levels. Sanusi and Ahmad (2016) find that the U.K.’s O&G stock returns were impacted asymmetrically by changes in oil price. Using multifactor factor model, Carson (2020) found inadequate evidence of asymmetric effects of oil price on US oil and gas stock returns. Based on these empirical evidence, it can be conjectured that positive and negative changes in O&G industry risk factors may influence the stock returns of O&G sub-industries differently as well. Therefore, we hypothesized that
According to the “Efficient Market Theory” of Fama (1970) and “information Diffusion Theory” of Barberis et al. (1998), Hong and Stein (1999) and Hong et al. (2000), the speed of price adjustment to the arrival of new information depends on information flow efficiency. These theories argue that investors’ reactions to news are heterogonous as they react based on their expectations. If investors presume that the news is good, they tend to over-react to the information. On the other hand, if they think that the news is bad, they under-react to that given information. To support the under-reaction theory, Barberis et al., (1998) suggest that investors require time to absorb and react to new information related to the stock market. Furthermore, according to Narayan and Sharma (2011, 2014), the presence of lag effects of oil price on stock price can be explained using information diffusion theory of Hong and Stein (1999) and Hong et al. (2000). The theory suggests that under-reaction from investors to oil price changes occurs when “(a) changes in oil prices have a substantial effect on economic activity and investors have difficulty in assessing the impact of information on the value of stocks; and (b) when investors react to information at different points in time” (Phan et al., 2015, pp. 247). The existence of lag effects suggests that investors do not react instantly to the arrival of new information, which means investors take time to interpret and react to the new information. Furthermore, the information diffusion theory of Hong and Stein (1999) and Hong et al. (2000) can also be applied to gas price and exchange rate as changes in these factors are related to information in many aspects. Therefore, investors may observe and need time to absorb the information which consequently results in under-reaction to changes in gas price and exchange rate. Hence, the lag effects of these factors are expected on oil and gas stock price and return.
Empirically, Huang et al. (1996) show that in an inefficient stock market, asset or stock prices may take time to adjust to oil price changes, which indicates the presence of lag effects of oil price on stock price. In the oil and gas industry context, Sanusi and Ahmad (2016) find that the U.K. oil and gas stock returns also exhibit lag reaction to changes in oil price. Following the study of Carson (2020), Sanusi and Ahmad (2016) has investigated the lag of oil price on US oil and gas stock returns and found the presence of asymmetric effects. Henceforth, in support of the information diffusion hypothesis and empirical studies, the current study conjectures that changes in oil and gas risk factors have lag effects on the stock returns of the oil and gas industry. Hence, we hypotheses the followings.
Empirical Model and Dataset Description
Multifactor Pricing Model
Multi-factor asset pricing models have been widely used in examining the effects of oil price on oil and gas stock returns (e.g. Arouri et al., 2011; Janor et al., 2013; Mohanty et al., 2010; Narayan & Sharma, 2011; Phan et al., 2015; Ramos & Veiga, 2011; Sanusi & Ahmad, 2016). Thus, this study adopts multi-factor pricing models for estimating the effects of oil and gas risk factors on stock returns. The models are supported by arbitrage pricing theory and multi-beta capital asset pricing theory. In multi-factor asset pricing models, this study includes Carhart’s (1997) risk factors because extant studies relating to the O&G industry have shown that Carhart’s (1997) risk factors influence stock performance of the O&G industry (see, Mohanty & Nandha, 2011; Ramos et al., 2017; Sanusi & Ahmad, 2016).


where,
In the oil and gas industry context, it has been proven that cash flow, investment and profitability of firms depend directly on oil price, gas price, and exchange rate (See Dayanandan & Donker, 2011). The future cash flows also depend on oil and gas price, as oil and gas price movements are important factors for business activities (see Cormier & Magnan, 2002; Ramos & Veiga, 2011). According to Mohn and Misund (2009), higher oil price increases both the investment and profitability of oil and gas firms through the undertaking of new investment projects and international contracts. In addition, oil and gas companies change their investment policies in a low oil price environment. In other words, “higher oil price uncertainty will cause firms to postpone irreversible investment decisions, preferring to wait for more information if the cash flow from the investment is dependent upon the oil and gas price” (see, Ahmadi et al., 2019; Elder & Serletis, 2010; Henriques & Sadorsky, 2011; Phan et al., 2019). Therefore, oil price, gas price and exchange rate factors can capture anomalies that are related to investment and profitability factors. Henceforth, the current multi-factor asset pricing model contains not only market-based risk factors but also O&G industry risk factors, which is shown in equation (2). Hereafter, equation (2) are used to re-formulate the new multi-factor pricing models with the lag and the asymmetric components of O&G industry risk factors.


Asymmetric Effects Test
For non-linear measurement, the current study follows the procedure of Mork (1989) and Mork et al. (1994). The following process has been employed for the non-linear measurement of O&G industry risk factors.
positive changes in oil price
negative changes in oil price,
positive changes in gas price
negative changes in gas price,
positive changes in exchange rate
negative changes in exchange rate,
For testing asymmetric effects, this study adopts a multi factor pricing model with non-linear measures of oil price change, LNG price change, and exchange rate change. The current study follows the study of Arouri et al. (2011), Janor et al. (2013), Mohanty et al. (2010), Narayan and Sharma (2011), Phan et al. (2015), Ramos and Veiga (2011), and Sanusi and Ahmad (2016) for finding asymmetric effects of O&G risk factors. The following equation (3) presents the multi factor pricing model for the asymmetric test.


where subscript j represents each oil and gas sub-industry.
Lag Effects Test
This study adopts a new multi-factor pricing model with a lag factor of O&G industry risk factors for investigating whether lagged information contributes to stock returns. Hence, the following equation (4) is modelled for investigating the lag effects of O&G industry risk factors on the Malaysian O&G industry’s stock returns. In this model, this study includes the lag variables of O&G industry risk factors to test for the presence of lag effects. This study uses one lag with weekly frequency data. Given five trading days in 1 week, the selection of one lag is supported by Sanusi and Ahmad (2016) as they have employed five lags with daily frequency data.


where
Dataset Descriptions
Following extant empirical studies, the study uses weekly stock price of publicly listed Malaysian O&G firms, oil price, gas price, and exchange rate (e.g., Arouri et al., 2011; Caporalea et al., 2015; Mohanty & Nandha, 2011; Moya-Martínez et al., 2014). We have followed the study of Moya-Martínez et al. (2014) for choosing weekly frequency data, which explained in detail about the advantages of employing weekly data over daily and monthly. The study sample contains 417 weeks, starting in January 2010 and ending in December 2017. This study employs a 90 days T-bill rate as risk-free rate, which is obtained from the Bank Negara website. Stock price data of 33 O&G companies are obtained from Malaysia and Yahoo Finance, and these 33 firms are categorized into seven sub-industries based on their respective global industry classification standard code for building sub-industry portfolios.
Furthermore, this study uses international oil price which is proxied by Brent crude oil price as most studies related to oil price and stock market have employed Brent crude oil price as a proxy for international oil price (Daiz et al., 2016; Demirer et al., 2015; Sanusi & Ahmad, 2016).The weekly Brent crude oil price data were compiled from the Energy International Administration website. In addition, this study uses international LNG price to proxy for gas price, because Malaysia is considered the second largest LNG (Liquefied natural gas) in the Asia-Pacific region (Badeeb et al., 2016). Consequently, changes in LNG price can influence the O&G company’s stock returns.
Moreover, this study employs the value of a unit of national currency against per unit of USD as a proxy for the exchange rate which is extracted from the Bank Negara website and DataStream. Even though Malaysia’s foreign exchange market follows floating exchange rate system, it is a managed floating system due to central bank’s intervention. In the study, exchange rate increase refers to depreciation of ringgit against the USD, vice versa.
This study follows the procedures suggested by Fama and French (1993, 2012) for constructing small-minus-big (SMB) and high-minus-low (HML) factors. The study uses a two-by-three sorting technique dependent on scale and book to market value to create SMB and HML factors. In order to define size groups, all stocks are ranked based on their market capitalization. Two types of portfolios are developed based on median market capitalization value: small stocks portfolio and big stocks portfolio. Similarly, all stocks are ranked and sorted into three categories using the book-to-market ratio, with the top 30%, middle 40%, and bottom 30% of the book-to-market values being classified as high, medium, and low book-to-market portfolios, respectively (see, Demirer et al., 2015; Fama & French, 1993, 2012; Sanusi & Ahmed, 2016).
The intersections of the two size portfolios and the three book-to-market portfolios culminated in the creation of six portfolios after sorting them. These portfolios are price weighted and are categorized as small-low (SL), small-medium (SM), small-high (SH), big-low (BL), big-medium (BM), and big-high (BH). For each week, the SMB factor is defined as the average of the difference between a small and a large portfolio. The HML factor, on the other hand, is described as the weekly average of the difference between high and low portfolios. The SMB and HML variables are calculated using equations (5) and (6), respectively.


In order to generate WML factor, this study follows the study of Fama and French (2012). Thus, this study separated all stocks into three groups based on lag cumulative momentum returns of month-12 (in this study week-52) and month-2 (in this study week-5) during portfolios formation, where top 30%, middle 40%, and bottom 30% of the book-to-market values are defined as winners, losers, and neutral portfolios respectively. After sorting, intersections of size and momentum portfolios resulted in the formation of six portfolios such as small-loser (SL), small-neutral (SN), small-winner (SW), big-loser (BL), big-neutral (BN), and big-winner (BW). Henceforth, the WML factor can be obtained from the difference between the average of returns on winner portfolios and loser portfolios. The following equation (7) is used for obtaining WML factor.

Empirical Findings
Preliminary Analyses
Table 2 exhibits descriptive statistics and normality test results for the Malaysian O&G sub-industries and portfolios for the period from January 2010 to December 2017. The findings of the Jarque-Bera test confirm that the returns of firms and market have non-normal distributions. Furthermore, the market return over the study period is 0.3%, suggesting that the Malaysian stock market is volatile and therefore stock market returns tend to be closer to zero and are non-normally distributed. In addition, we also found the existence of ARCH effect in the return series. Therefore, the Generalized Autoregressive Conditional Heteroskedasticity (GARCH) regression process fits the empirical estimations. Furthermore, this study also employs “augmented Dickey-Fuller” (ADF) and “Phillips-Perron” (PP) unit root tests for detecting stationarity in data series (the unit test results will be provided upon request). Both unit root tests show that all returns series are stationary at the level form, and therefore, the co-integration approach is not required in the estimation. Moreover, the study reports Pearson correlation coefficients between risk factors in Table 3. The correlation results indicate that the oil risk factor is significantly and positively associated with all risk factors excluding the exchange rate factor with correlation coefficients ranging from 0.177 to 0.331. Collectively, the coefficient values among the risk factors are low, indicating the absence of multicollinearity problem.
Descriptive Statistics and Normality for Sub-Industry.

Note. This table reports the results of the normality test with some summary statistics. Column 1 lists sub-industry in oil and gas sector. Market represents the stock market return. Column 2 and 3 report the weekly mean returns and annualized mean returns of firms over the sample period, respectively. Column 4 reports the standard deviation. Columns 5 through 7 report the Jarque-Bera test estimated for each sub-industry and portfolio as JB: N[s2/6 + (k − 3)2/24], where s, k, N are the value of skewness, the value of kurtosis, and the number of data applied for the test, respectively. Column 8 shows the estimated p-value of the test Jarque-Bera, where the value that is lower than .05 indicates the rejection of the null hypothesis of the independent test at the significance level of .05. GICS Structure code is used for categorizing sub-industries under the oil and gas industry as shown in AppendixTable A1.
Statistical significance at 10% level.
Statistical significance at 5% level.
Statistical significance at 1% level.
Correlation Matrix of Risk Factors.
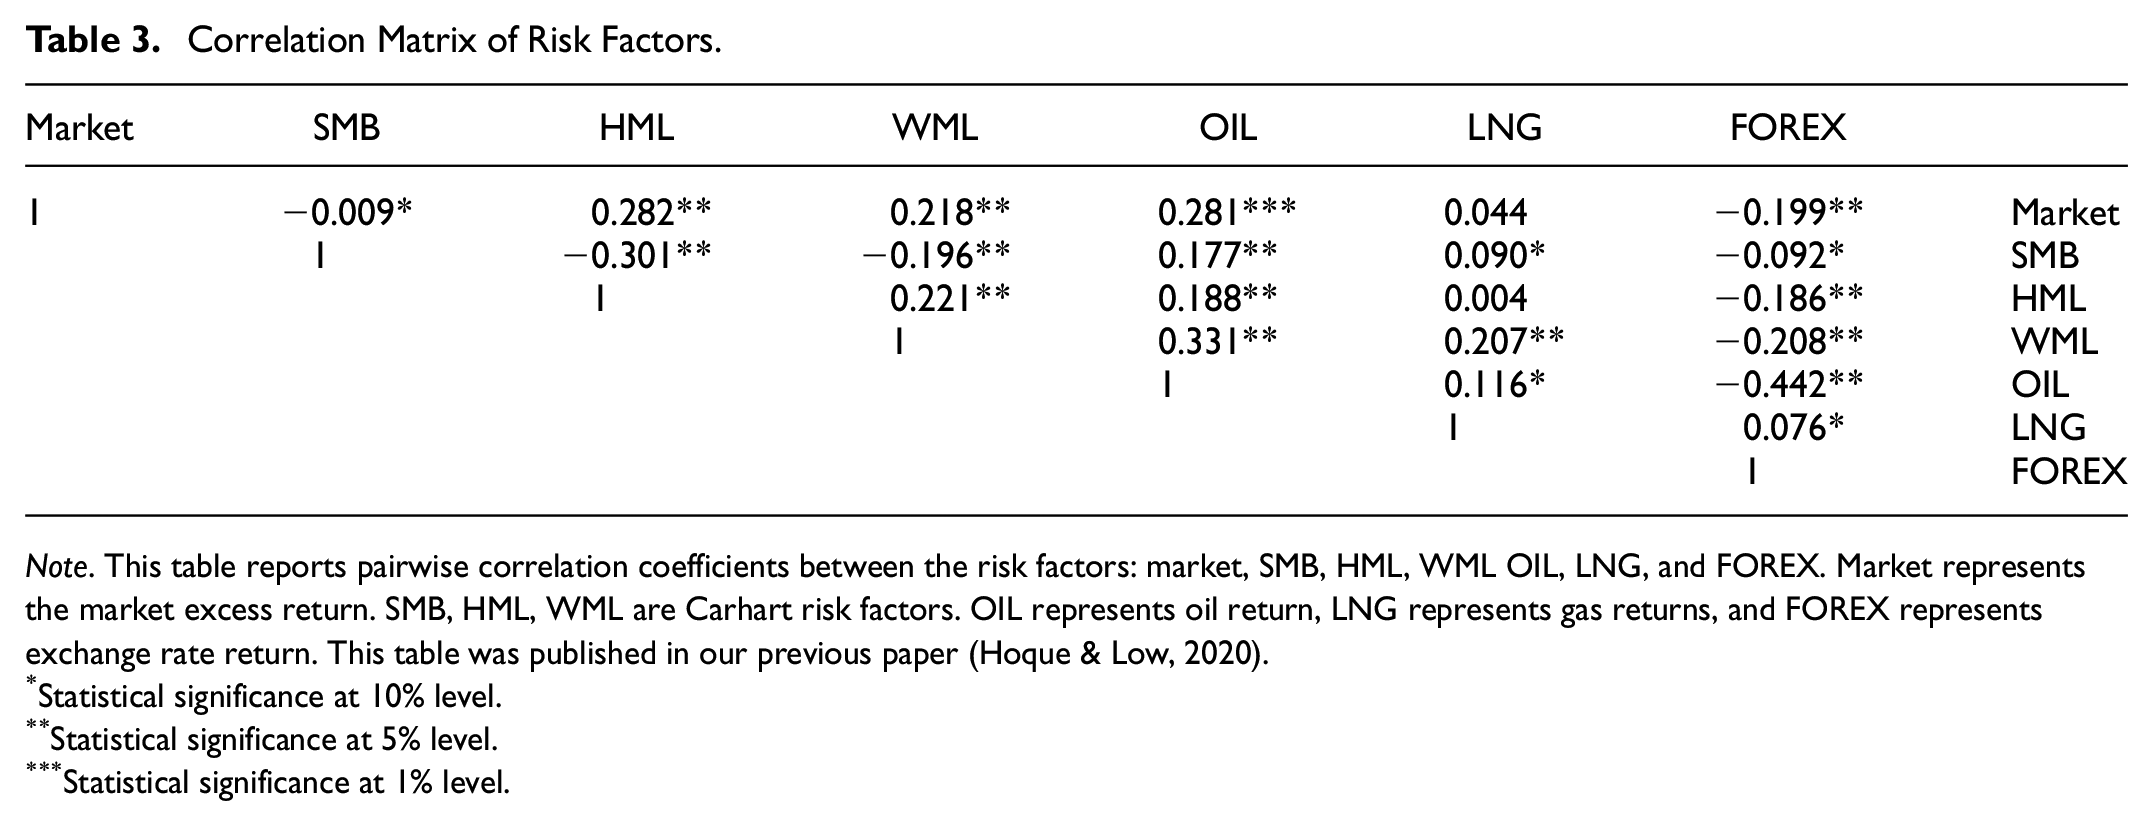
Note. This table reports pairwise correlation coefficients between the risk factors: market, SMB, HML, WML OIL, LNG, and FOREX. Market represents the market excess return. SMB, HML, WML are Carhart risk factors. OIL represents oil return, LNG represents gas returns, and FOREX represents exchange rate return. This table was published in our previous paper (Hoque & Low, 2020).
Statistical significance at 10% level.
Statistical significance at 5% level.
Statistical significance at 1% level.
Asymmetric Effects of Oil and Gas Risk Factors
Following the study of Arouri et al. (2011), Janor et al. (2013), Mohanty et al. (2010), Narayan and Sharma (2011), Phan et al. (2015), Ramos and Veiga (2011), and Sanusi and Ahmad (2016), this study employs Generalized Autoregressive Conditional Heteroskedasticity regression process. Based on Akaike Information Criterion (AIC) and the Bayesian Information Criterion (BIC), the study confirms that GARCH (1,1) process fits the empirical estimations. At first, we estimated GARCH (1,1) regression for equations (3) and (4) but a few models did not satisfy the rule of thumbs of GARCH (1,1) in the variance equations. Therefore, we estimated IGARCH (1,1) for those sub-industries. The estimated results of GARCH (1,1) and IGARCH (1,1) for equation (3) are presented in Table 4. The Variance equation of GARCH (1,1) is
Asymmetric Effects on Oil and Gas Sub-Industries.
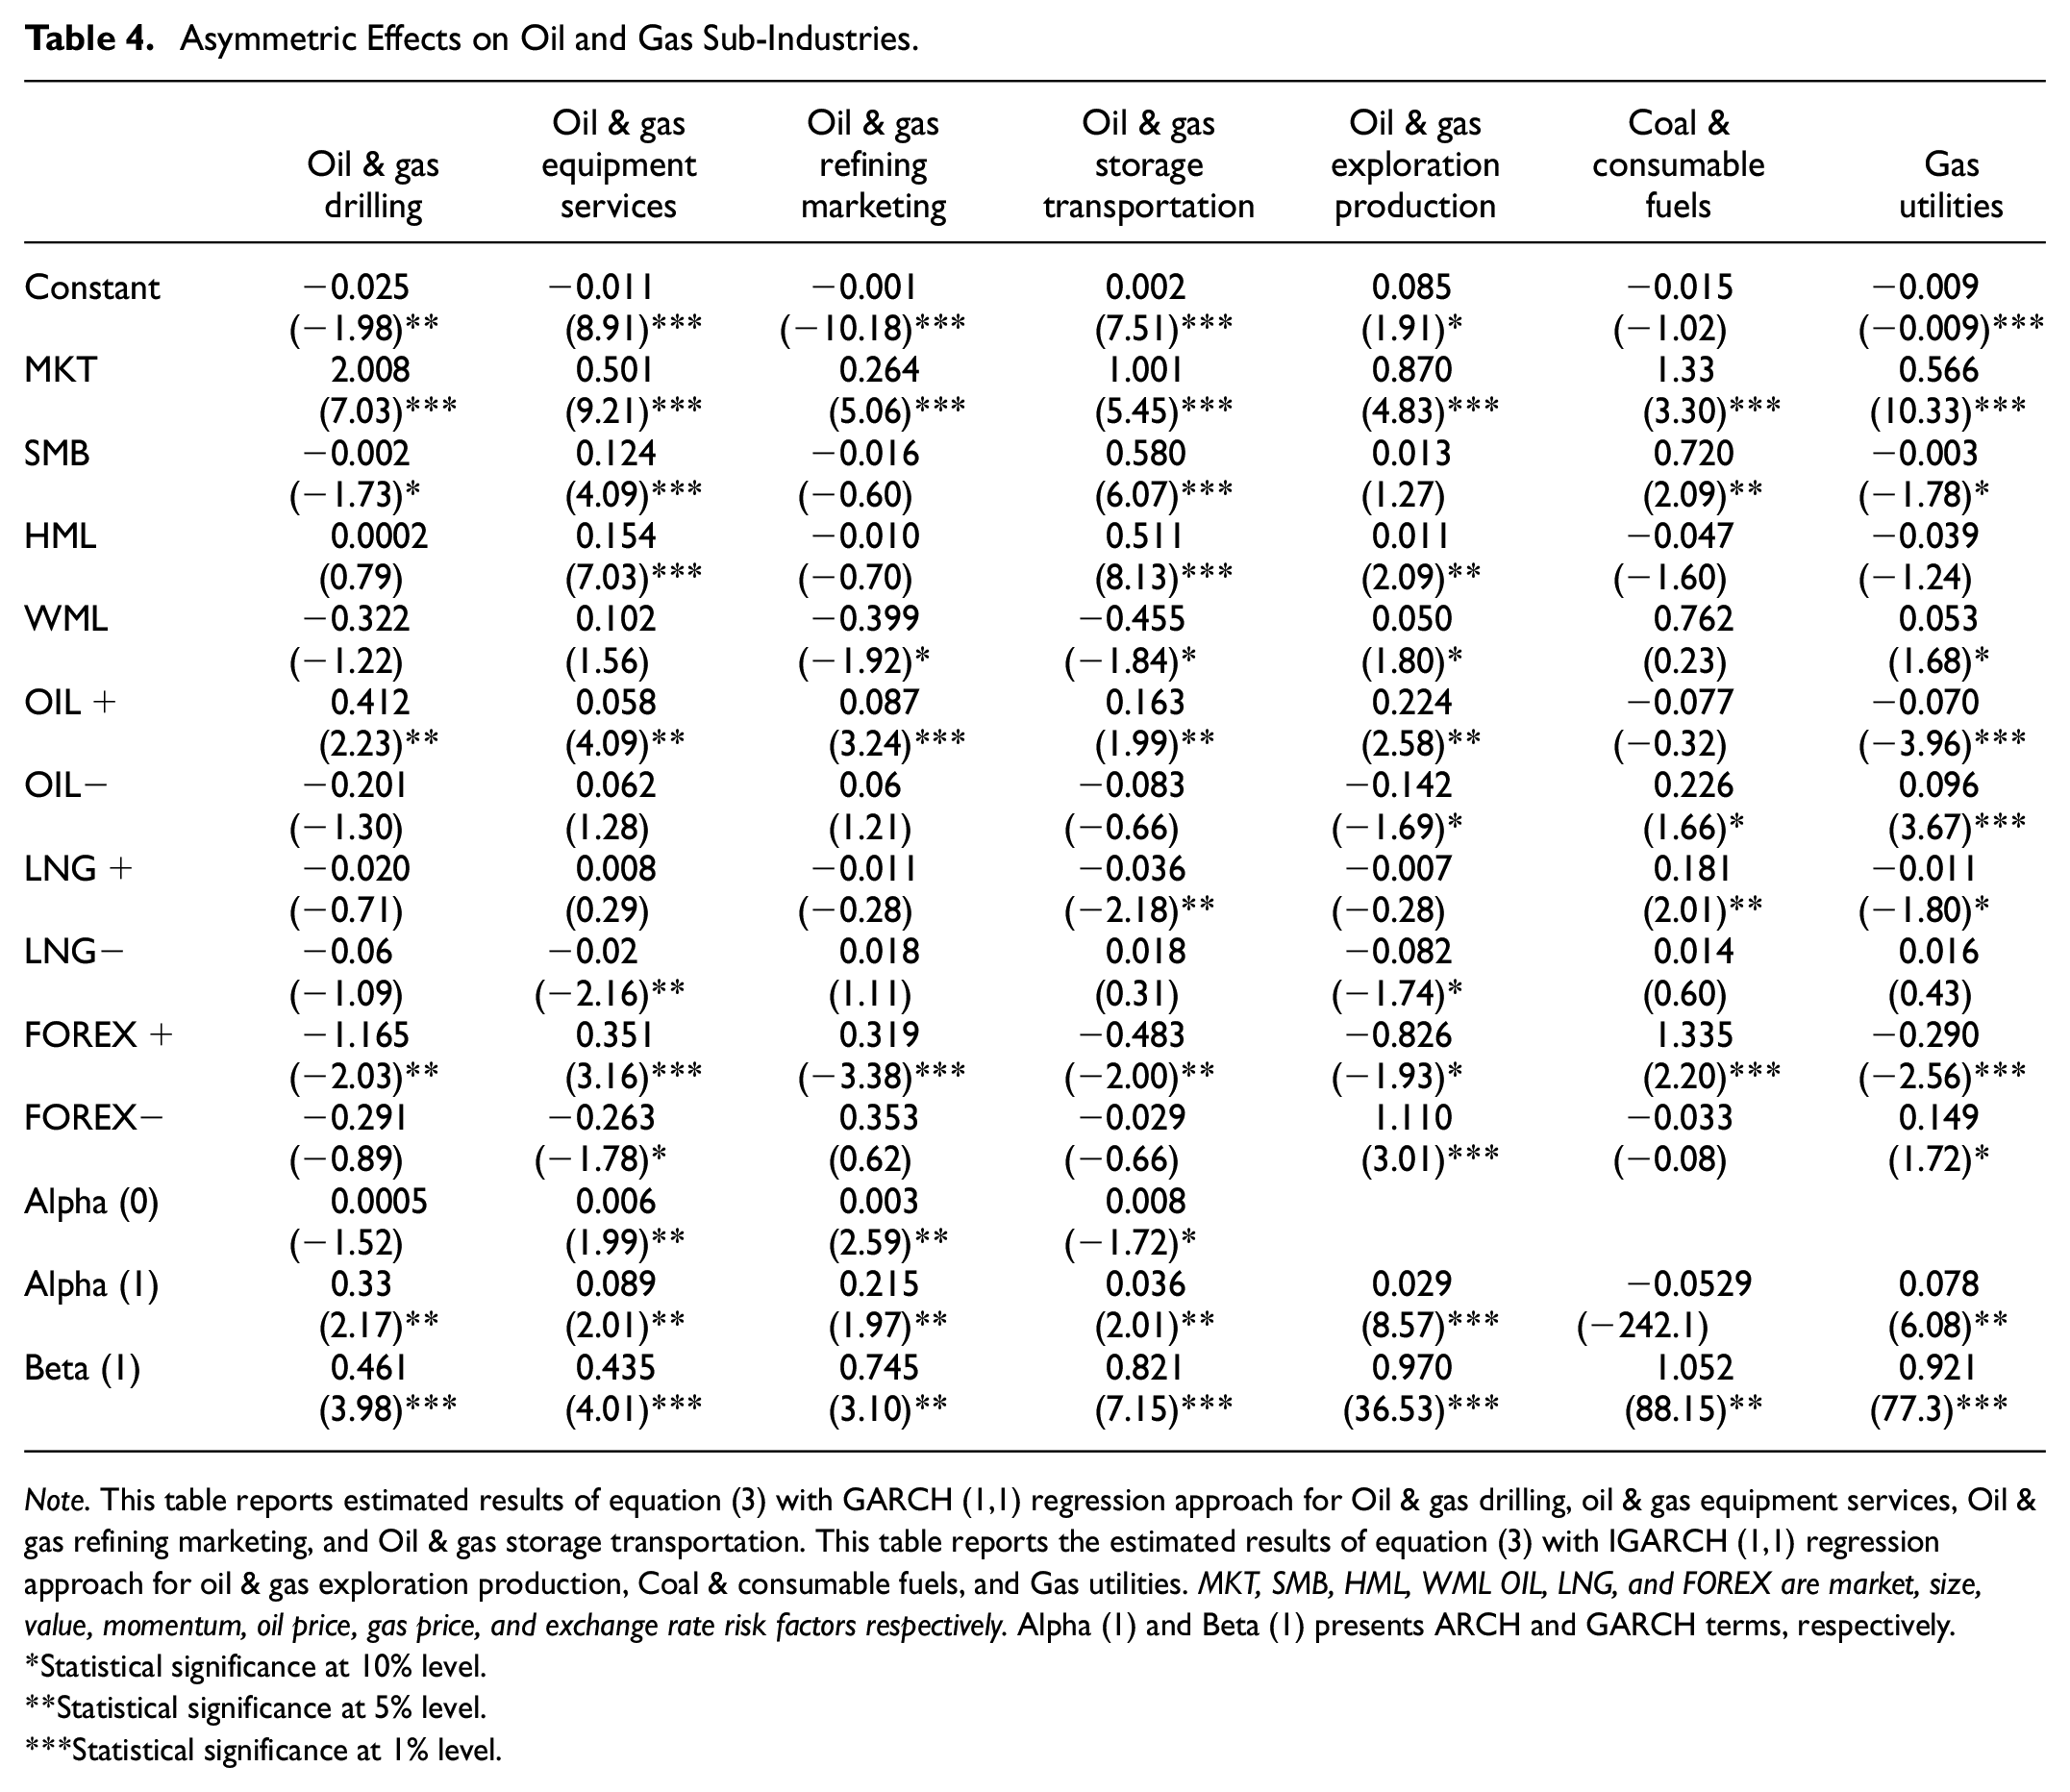
Note. This table reports estimated results of equation (3) with GARCH (1,1) regression approach for Oil & gas drilling, oil & gas equipment services, Oil & gas refining marketing, and Oil & gas storage transportation. This table reports the estimated results of equation (3) with IGARCH (1,1) regression approach for oil & gas exploration production, Coal & consumable fuels, and Gas utilities. MKT, SMB, HML, WML OIL, LNG, and FOREX are market, size, value, momentum, oil price, gas price, and exchange rate risk factors respectively. Alpha (1) and Beta (1) presents ARCH and GARCH terms, respectively.
Statistical significance at 10% level.
Statistical significance at 5% level.
Statistical significance at 1% level.
Wald Test for Equality of Asymmetric Effect.

Note. Estimates of equality in asymmetric effects using Wald Test, where null hypotheses were
Statistical significance at 10% level.
Statistical significance at 5% level.
Statistical significance at 1% level.
Focusing on the asymmetric effects of oil price on each sub-industry, we found that oil price has strong asymmetric effects on the stock returns of the following O&G sub-industry: drilling (F-stat = 10.66, p > .01), equipment services (F-stat = 2.83, p > .05), refining and marketing (F-stat = 3.56, p > .01), storage transportation (F-stat = 4.24, p > .01), exploration production (F-stat = −6.26, p > .01), and gas utilities (F-stat = −8.87, p > .01), while no effect on coal and consumable fuels (F-stat = 1.53, p < .10). In most cases, we noted that positive changes in oil price have higher exposures on stock returns than negative changes in oil price, which lends strong support to our hypothesis H1a. The greater impact of increased in oil price is due to the positive or demand-related oil price shocks that benefit O&G stocks in earning additional profits. In contrast, negative or supply-related oil price shocks do not influence stock returns in the same magnitude as positive oil price changes. This is because the government took initiatives to reduce the negative effects of negative oil price changes during the supply-related shocks. The exchange rate depreciation also helps to reduce potential negative effects of negative oil price changes, and therefore, the impacts of negative changes in O&G price on stock price are lower than the impacts of positive changes. These empirical findings are consistent with the theoretical explanations of Narayan and Sharma (2011, 2014) and Mork (1989) that positive or demand-related oil price shocks have greater influences on O&G stock returns. Thus, Mork’s (1989) hypothesis is also applicable to the Malaysian O&G industry. Although Carson (2020) found limited evidence of asymmetric effects of oil on individual stock, the current empirical observations are in line with previous studies (Janor et al., 2013; Mohanty et al., 2011; Mork, 1989; Nandha & Faff, 2008; Narayan & Sharma, 2011, 2014; Phan et al., 2015; Ramos & Vegas, 2011; Sanusi & Ahmad, 2016). Particularly, these observations are also consistent with the study of Ramos and Vegas (2011) and Sanusi and Ahmad (2016) for the asymmetric responses of O&G stock returns to oil price changes and the observed greater impacts of positive oil price changes.
On asymmetric effect of gas price, the empirical results show that gas price changes have an asymmetric effect on stock returns of the following O&G sub-industry: equipment services (F-stat = −2.06, p > .05), storage transportation (F-stat = −2.01, p > .05), exploration production (F-stat = 1.88, p > .10), coal and consumable fuels (F-stat = 2.09, p > .05), and gas utilities (F-stat = −1.72, p > .10). In this case, the effects of positive gas price change on returns are also higher than negative gas price change. The possible reason could be that, during positive gas price shocks, the government does not take major initiative to respond to the positive gas price change because it brings in additional government revenues. However, the government takes major initiative to respond to negative gas price change as it causes a revenue shortfall for the government. Therefore, the positive gas price change has more impact on stock returns than negative gas price change due to the lack of action from the government in reducing gas price when gas price increases. Hence, this confirms Mork’s (1989) and Mork et al.’s (1994) hypothesis for gas price asymmetric effects and validates that positive changes in commodity price have greater impacts than negative price changes. Thus, the empirical finding has confirmed our hypothesis H1b. The results are also supported by Narayan and Sharma (2011, 2014), Ramos and Vegas (2011) and among others.
On asymmetric effect of exchange rate, the empirical finding shows that exchange rate has an asymmetric effect on stock returns of the following O&G sub-industry: drilling (F-stat = −21.33, p > .01), equipment services (F-stat = 26.38, p > .01), refining and marketing (F-stat = 9.30, p > .01), storage transportation (F-stat = −5.97, p > .05), exploration production (F-stat = 2.98, p > .05), coal and consumable fuels (F-stat = 29.77, p > .01), and gas utilities (F-stat = 10.11, p > .01). Hence, this study provides evidence that exchange rate change has asymmetric impacts on O& G stock returns where exchange rate depreciation has greater impacts compared to the impacts of exchange rate appreciation. This is because, usually, the exchange rate of oil and gas exporting countries appreciates with positive oil and gas price changes where increases in oil and gas price attract more attention. Therefore, exchange rate appreciation has limited influence on the O&G industry and oil and gas exporting countries. In contrast, the exchange rate of oil and gas exporting countries depreciates with negative oil and gas price changes, where exchange rate depreciation gets higher attention as it could increase the profits and costs of some sub-industries. Thus, exchange rate depreciation has an influence on O&G stocks of oil and gas exporting countries. Therefore, Mork’s (1989) and Mork et al.’s (1994) hypothesis is applicable for asymmetric responses of O&G stocks to exchange rate changes as well. The empirical finding has confirmed our hypothesis H1c.
Collectively, although the asymmetric impacts of the oil price, gas price and exchange rate factors on O&G stock exhibit different exposures and directions, the existence of the asymmetric effects confirms our first hypothesis H1, which is related to Mork’s (1989) and Mork et al.’s (1994) hypothesis and asymmetric effects.
Lag Effects of Oil and Gas Risk Factors
We estimated equation (5) with GARCH (1,1) regression approach for all sub-industries excluding Coal & consumable fuels. Similarly, we estimated equation (5) with IGARCH (1,1) regression approach excluding Coal & consumable fuels. The estimated results are shown in Table 6.
Lag Effects on Oil and Gas Sub-Industries.

Note. This table reports estimated results of equation (4) with GARCH (1,1) regression approach for Oil & gas drilling, oil & gas equipment services, Oil & gas refining marketing, and Oil & gas storage transportation. This table reports the estimated results of equation (4) with IGARCH (1,1) regression approach for oil & gas exploration production, Coal & consumable fuels, and Gas utilities. MKT, SMB, HML, WML OIL, LNG, and FOREX are market, size, value, momentum, oil price, gas price, and exchange rate risk factors respectively. Alpha (1) and Beta (1) presents ARCH and GARCH terms, respectively.
Statistical significance at 10% level.
Statistical significance at 5% level.
Statistical significance at 1% level.
On the coefficient of lag oil price, it indicates that the oil price risk factor has significant lag effects on stock returns of O&G equipment services (γ = 0.016, p > .05), O&G refining and marketing (γ = −0.043, p > .01), O&G exploration production (γ = 0.016, p > .01), and gas utilities sub-industry (γ = 0.041, p > .05), but the magnitudes and directions of the effects vary across the sub-industries. In contrast, oil price does not have significant lag effects on the stock returns of O&G drilling, O&G storage transportation, and coal and consumable fuels sub-industries. These empirical findings partially support our hypothesis H2a.
Furthermore, looking at the coefficients of lag gas price, the empirical findings indicate that gas price risk factor has positive lag effects on stock returns of O&G storage transportation sub-industry (γ = 0.012, p > .05) while it has negative lag effects on stock returns of gas utilities sub-industry (γ = −0.063, p > .05). The empirical findings partially support our hypothesis H2b.
Moreover, the coefficients of lag exchange rate show that the exchange rate risk factor has negative lag effects on stock returns of O&G equipment services (γ = −0.123, p > .10), O&G storage transportation (γ = −0.486, p > .05), coal and consumable fuels (γ = −1.008, p > .05), and gas utilities sub-industries (γ = −0.163, p > .05), but the magnitudes of the effect vary across sub-industries. The results imply that stock performances of these three sub-industries are affected by the change in previous week’s exchange rate. These findings also indicate that exchange rate information can be employed in forecasting the stock price of O&G storage transportation, coal and consumable fuels, and gas utilities sub-industries. The empirical findings strongly support our hypothesis H2c.
Overall, this study finds that oil price and exchange rate risk factors have strong lag effects on the stock returns of Malaysian O&G industry, although the magnitudes and directions of the effects vary across the sub-industries. This study also documents that there are limited lag effects of gas price on the O&G stock returns. Hence, the empirical results strongly support hypothesis H2. Consistent with the previous results of this study, the differences in the lag effects of O&G risk factors are due to the business activities and business operations of each sub-industry. Furthermore, these findings strongly implied that historical oil price and exchange rate information could assist investors in estimating the stock returns of Malaysian O&G stocks. The results support the gradual information diffusion theory of Hong and Stein (1999, 2004), implying the presence of investors’ under-reaction behavior to changes in international oil price and exchange rate. This is expected and realistic as investors cannot instantly assess the multidimensional effects because the effects oil price and exchange rate risk factors in the economy transmit through several macroeconomic variables which complicates the final effects assessment. (Killan, 2009, 2010, 2014). Thus, investors have to wait and observe how other macroeconomic factors react to the sudden changes in oil price before investing in the O&G sectors. Additionally, such findings are expected for the Malaysian O&G industry because the Malaysian stock market is efficient in the semi-strong form. Hence, the lag effects of O&G industry risk factors on stock performances are supported by the study of Huang et al. (1996), suggesting that investors take time to absorb the arrival of information in the semi-efficient stock market. They respond in a delayed nature to the news related to stock price and performances. This finding also lends support to the finding of Sanusi and Ahmad (2016). Therefore, our second hypothesis of lag effect is also substantiated.
Robustness Checking
To check for the robustness of our estimated results, we modeled the following multi asset pricing model with regime varying specifications of Hamilton’s (2016). Here, we redesign the models for O&G industry portfolio returns that allow for the observation of risk factor exposure in volatility condition of the O&G industry stock returns. The process of Markov switching regression for O&G industry portfolio with risk factor is similar to Hoque et al.’s (2020b). Like that study, we also employ oil price as the underlying factor of regime switching for oil and gas stock returns. The following equation (8) and equation (9) are employed to test for asymmetric effects and lag effects on returns of oil and gas stocks, respectively.


Where
We estimated equations (8) and (9) and the results are presented in Tables 7 and 8, respectively. The results, in Table 7 Panel B, show the presence of asymmetric effects of oil price (Low volatility: F-stat = 10.11, p > .01; High volatility: F-stat = 13.45, p > .01), gas price (Low volatility: F-stat = 5.00, p > .01; High volatility: F-stat = −2.06, p > .10), and exchange rate (Low volatility: F-stat = 25.82, p > .01; High volatility: F-stat = 21.89, p > .01). In addition, Table 8 Panel A shows the presence of lag effects of oil price (Low volatility: γ = 0.044, p > .05; High volatility: F-stat = 0.014, p > .05), gas price (Low volatility: γ = 0.041, p > .10; High volatility: F-stat = −0.009, p < .10), and exchange rate (Low volatility: γ = 0.234, p > .05; High volatility: F-stat = 0.012, p > .05) on stock returns. These results are consistent with our previous estimated results. The current findings also extend the findings of Hoque et al. (2020b), where they showed that the contemporaneous effects of O&G industry risk factor vary across the volatility structure. In this study, we have presented evidence that the positive and negative changes of O&G industry risk factor vary across the volatility structure. Similarly, the lag effect varies across the volatility period.
Asymmetric Changes on O&G Industry Returns.

Note. This table reports the estimated results of equation (8) with Markov switching regression. MKT, SMB, HML, WML OIL, GAS, and FOREX are market, size, value, momentum, oil price, gas price, and exchange rate risk factors respectively. Sigma is the coefficient of volatility effect. LR is linearity test. LL denotes loglikelihood. P11 and P22 are time varying parameters. The null hypotheses for Wald Test are as follows:
Statistical significance at 10% level.
Statistical significance at 5% level.
Statistical significance at 1% level.
Lag Effects of Oil and Gas Risk Factors on Industry Returns.
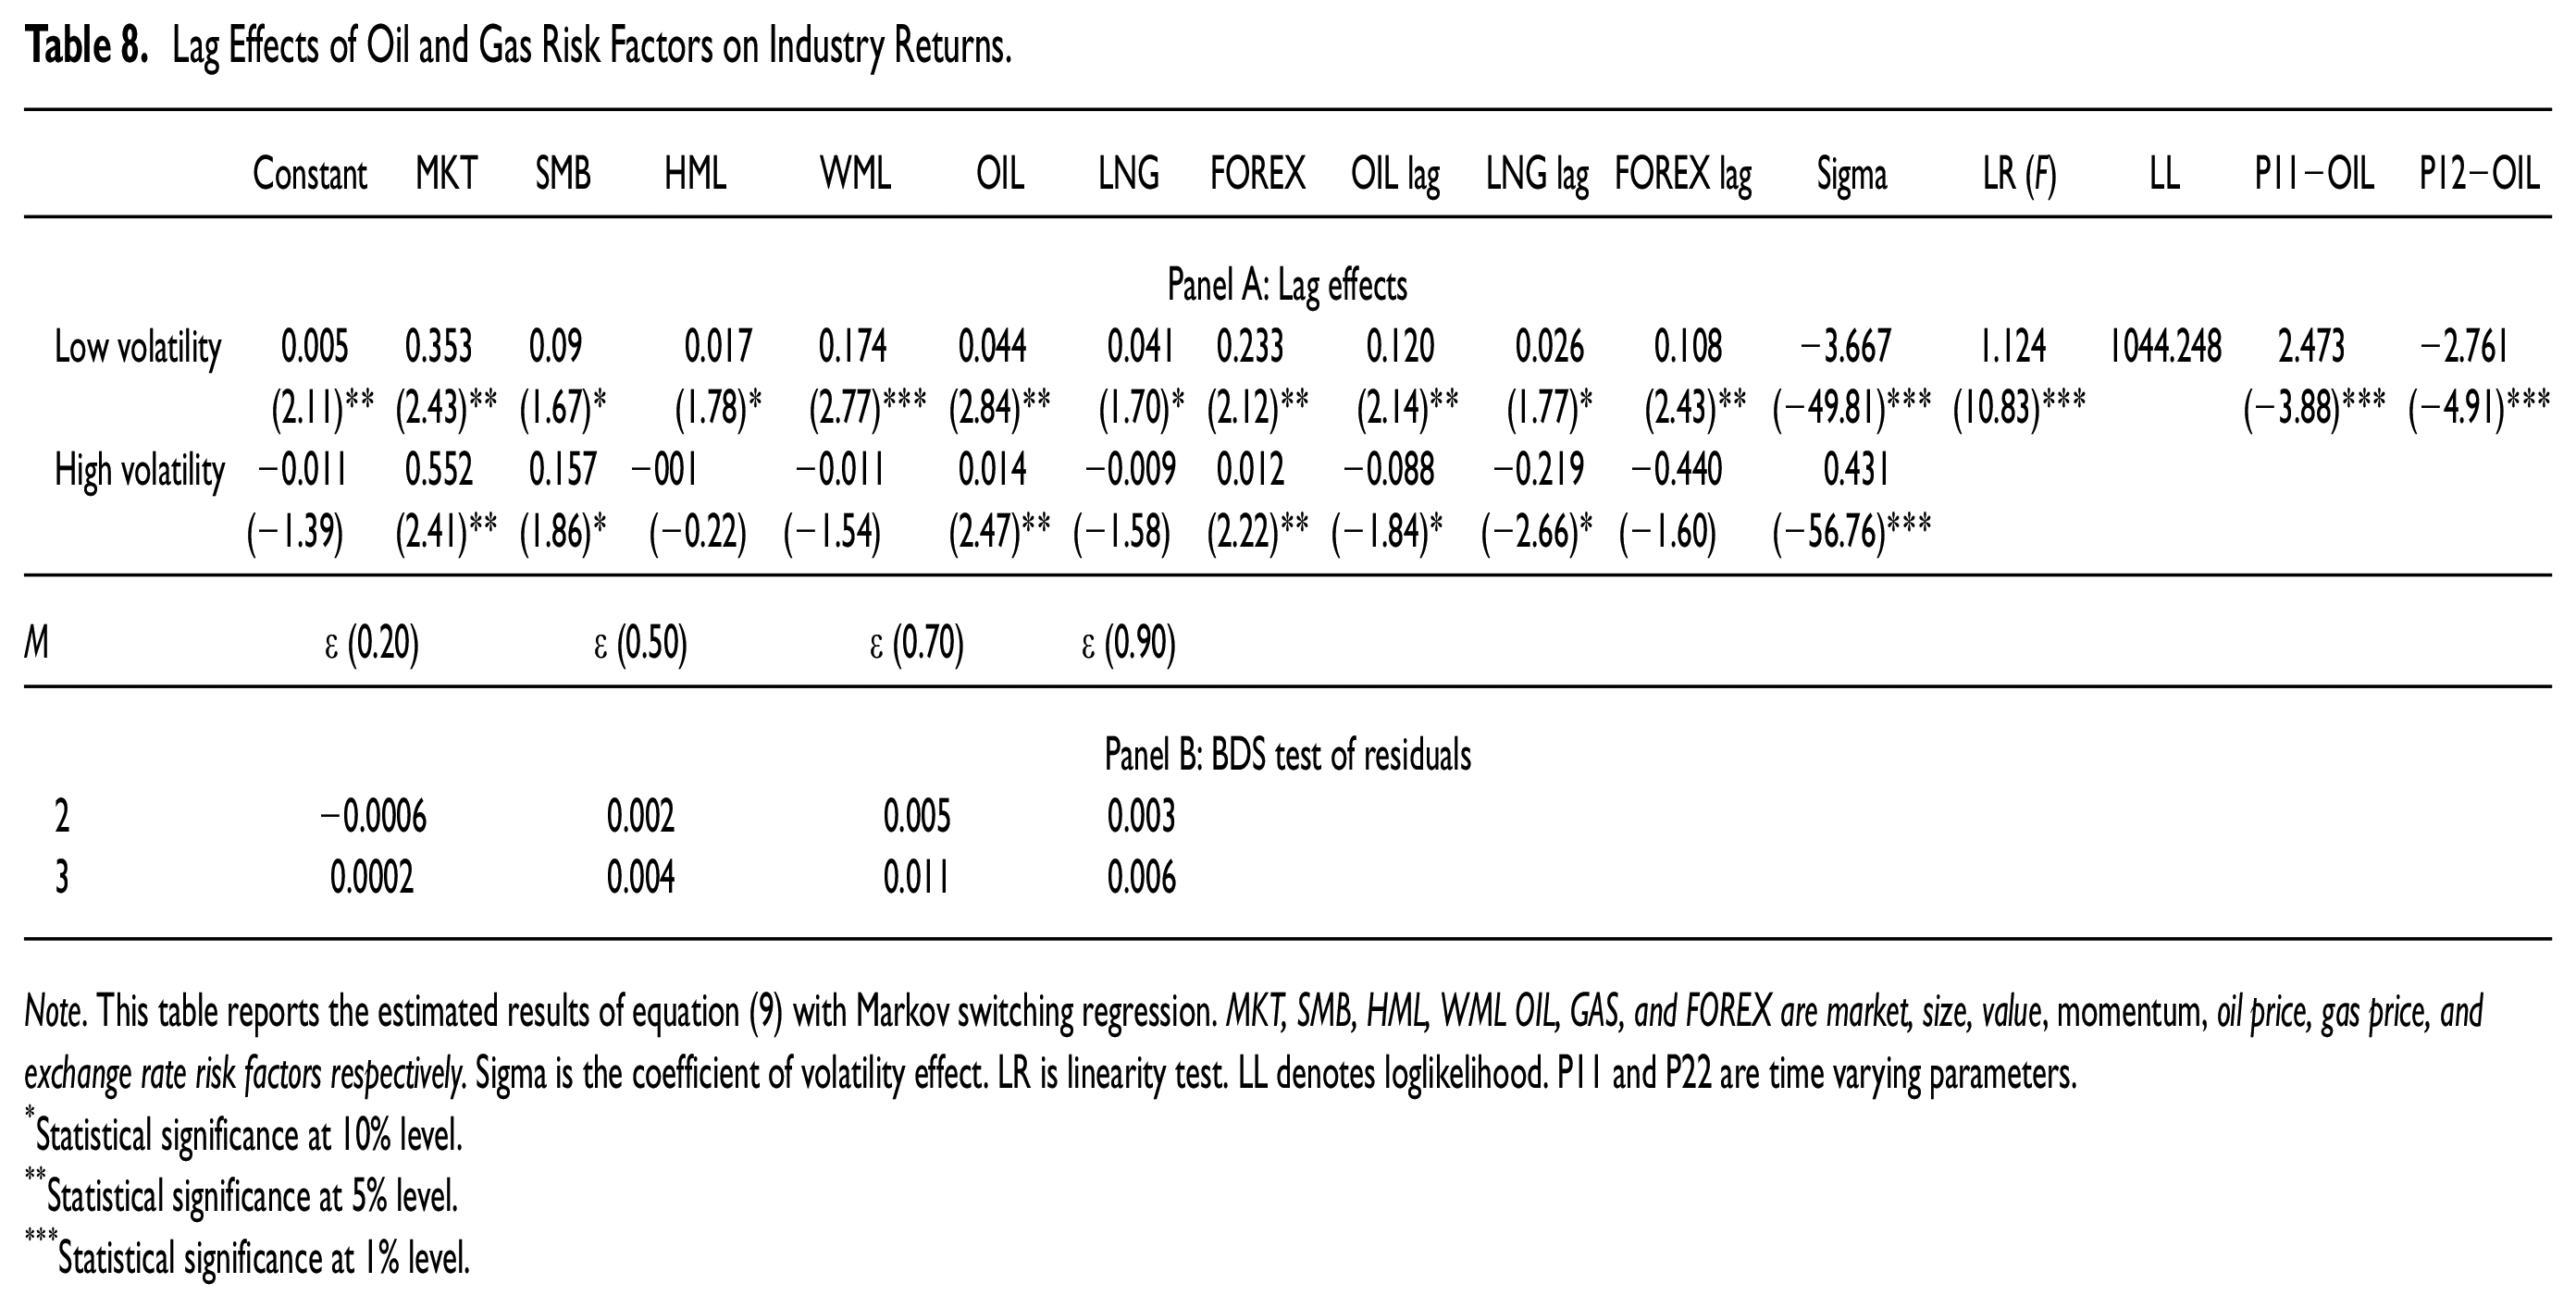
Note. This table reports the estimated results of equation (9) with Markov switching regression. MKT, SMB, HML, WML OIL, GAS, and FOREX are market, size, value, momentum, oil price, gas price, and exchange rate risk factors respectively. Sigma is the coefficient of volatility effect. LR is linearity test. LL denotes loglikelihood. P11 and P22 are time varying parameters.
Statistical significance at 10% level.
Statistical significance at 5% level.
Statistical significance at 1% level.
Conclusion
This study examines asymmetric and lag effects of O&G industry risk factors on the Malaysian O&G industry returns using firm-level data over the period from January 2010 to December 2017. The study employs multi-asset pricing models for each of the O&G sub-industries. The results show that in addition to common market-based risk factors (market, size, book-to-market), oil price, gas price, and exchange rate have significant effects on O&G industry stock returns. The findings indicate that oil price and exchange rate changes have lag effects on stock performance, implying that returns of the O&G industry showed a delayed reaction to oil price and exchange rate information flows. In addition, the effects are asymmetric. The overall findings suggest that O&G stock returns are sensitive to oil price, gas price, and exchange rate risk factors and such information can be useful to investors for investment and portfolio strategies formulation. The findings have several practical implications. The empirical evidence of lag effects suggests an informationally inefficient stock market in Malaysia, particularly the O&G industry, which allows for return predictability to occur using past information related to oil price, gas price, and exchange rate. Thus, profitable strategies can be formulated, and this may attract foreign and local investors and portfolio managers looking for trading opportunities in the Malaysian O&G stocks. Additionally, the delayed price adjustments to information related to oil price, gas price, and exchange rate risk factors enhance investors’ understanding of industry’s reactions to information development. The positive exposure of Malaysian O&G companies to oil price increases suggests that oil price increases have positive impacts on stock prices of Malaysian O&G stocks. Such a finding is not unexpected given that Malaysia is heavily reliant on oil exports, hence has positive sensitivity to changes in oil price. This finding implies that investors can achieve international diversification benefits by holding a portfolio of assets from both net oil-exporting and net oil-importing countries. Furthermore, the findings of asymmetric effects of exchange rate on O&G stock returns suggest great opportunities for risk diversification within the O&G portfolios. A similar strategy can be employed based on the asymmetric effects of gas price, although the asymmetric effects are limited. The findings of contemporaneous, asymmetric, and lag responses of stock returns across different O&G sub-industries help firms in managing their risk and also investors in formulating effective hedging plans.
Footnotes
Appendix
Copy Right Attribution.

| Sources | Adapted | Source information | Copyright | Permission statement |
|---|---|---|---|---|
| Journal | Table 1 Adapted | Hoque et al. (2020a). | Creative Commons Attribution License (CC BY). The copyright is retained by the author(s). | Adapted with Permission |
| Journal | Table 3 Adapted | Hoque and Low (2020). | Creative Commons Attribution License (CC BY). The copyright is retained by the author(s). | Adapted with Permission |
Source. Author(s).
Declaration of Conflicting Interests
The author(s) declared no potential conflicts of interest with respect to the research, authorship, and/or publication of this article.
Funding
The author(s) received no financial support for the research, authorship, and/or publication of this article.
Availability of Data
Stock prices of O&G firms data are available on Yahoo Finance (https://finance.yahoo.com), which have been used to construct an equally weighted portfolio of O&G sub-industries. Oil price and gas prices are available on the EIA website (https://www.eia.gov/), the growth/returns series of these two have considered as factors in the model. Exchange rate data are available on the Bank Negara website (https://www.bnm.gov.my/index.php?ch=statistic&pg=stats_exchangerates), the growth/returns series of this considered as a factor in the model.