
Abstract
This study identifies the predictors for mobile payment readiness and intention to adopt among Malaysians. Data were collected using self-reporting questionnaires (n = 434) that were developed by partially adopting factors from the Unified Theory of Acceptance and Use of Technology 2 and Technology Readiness Index 2.0 and extended using constructs from existing literature. An Exploratory Factor Analysis was conducted, followed by Confirmatory Factor Analysis. Structured equation modeling revealed Perceived Effort and Usefulness, Optimism, Intrinsic Motivation and Lack of Awareness to significantly predict users’ readiness to go cashless (R2 = 89.7%; predictive relevance = 88%). Perceived Effort and Usefulness, Intrinsic Motivation, and Perceived Risk significantly predicted intention to adopt mobile payment (R2 = 23.9%; predictive relevance = 19.3%). Findings revealed significant predictors that affect mobile payment intention to adopt and users’ readiness, therefore provide useful insights to government agencies, policy makers and financial institutions to understand the current landscape of mobile payment adoption in the country, and subsequently help in the formulation of appropriate strategies to improve the uptake of mobile payments.
Plain Language Summary
This study identifies the predictors for mobile payment readiness and intention to adopt among Malaysians, using a self-reporting survey (n = 436). Results show Perceived Effort and Usefulness, Optimism, Intrinsic Motivation and Lack of Awareness to significantly predict users’ readiness to go cashless whilst Perceived Effort and Usefulness, Intrinsic Motivation, and Perceived Risk significantly predicted intention to adopt mobile payment. We also found a significant relationship between readiness and intention to adopt mobile payment. Findings revealed significant predictors that affect mobile payment intention to adopt and users’ readiness, therefore provide useful insights to government agencies, policy makers and financial institutions to understand the current landscape of mobile payment adoption in the country, and subsequently help in the formulation of appropriate strategies to improve the uptake of mobile payments.
Introduction
A cashless society is one that conducts financial technology transactions utilizing digital cards or electronic devices in accordance with the Fourth Industrial Revolution (Koch et al., 2020). Payment methods for goods and services have changed dramatically over the last few decades, with a present global desire for digital and cashless transactions (Pham & Ho, 2015). Mobile payment services particularly those performed through electronic gadgets such as smartphones with an Internet connection have become popular over the recent years, resulting in the emergence of mobile payment applications (e.g., e-wallets) (L. P. Chin & Ahmad, 2015; Nizam et al., 2018).
There is evidence that people favor technologies that are useful, convenient, and speedy (Verkijika, 2018). Malaysia has the greatest mobile and Internet penetration rates in Southeast Asia, with 96.8% Internet usage, and 83.5% mobile phone penetration (Department of Statistics Malaysia, 2022). According to the Internet User Survey 2020, 64% of Malaysians engaged in online banking and financial operations in 2020, up from 54% in 2018 (Malaysian Communication and Multimedia Commission, 2020). However, the adoption of mobile payment in Asian countries is relatively slow in progression, with Hong Kong, Thailand, Taiwan, and Singapore being the leading nations as per the recent statistics in 2021 (Statista, 2021). According to the same statistics, the adoption rate for mobile payment in Malaysia is only 29.4% (compared to Hong Kong with 46.7%), although mobile payment uptake has tremendously accelerated recently due to the COVID-19 pandemic, which saw many Malaysians shifting to online shopping during the nationwide lockdowns. According to a local poll in 2020 by the Standard Chartered bank, approximately 51% of Malaysians prefer online payments now compared to only 30% prior to the pandemic (Jaafar, 2020). In fact, this phenomenon has been observed worldwide as well, such as in Germany (Koch et al., 2020) and Vietnam (Pham et al., 2020).
The adoption of mobile payment is attributed to several factors, including usefulness, efficiency, compatibility, and social influence etc. (de Blanes Sebastián et al., 2023; Flavián et al., 2022; Kim et al., 2019; Oliveira et al., 2016; Singh et al., 2020). Conversely, factors such as security, privacy, trust, and cost are often cited for the low adoption of mobile payment (Belanche et al., 2022; Nizam et al., 2018; Pham et al., 2020). The extant literature also revealed the Technology Acceptance Model (TAM) (Davis, 1989) model and its variants to be popular among scholars investigating mobile payment adoption (Mohamad & Kassim, 2019; Nizam et al., 2018). Another popular model includes the Unified Theory of Acceptance and Use of Technology (UTAUT) (Venkatesh et al., 2003) and its extended versions (de Blanes Sebastián et al., 2023; Singh et al., 2020; Venkatesh et al., 2012). In the context of a cashless society, perceived readiness refers to a society’s willingness to transition from cash to non-cash payment methods, and it is seen to have a direct impact on the adoption of mobile payment systems (Aris et al., 2022). Readiness is regarded as a broad mindset rather than a measure of technological competence. It is characterized as “people’s willingness to embrace and use new technologies for achieving goals in home life and at work” (Parasuraman, 2000), and is thus associated with higher rates of technology adoption (Cimbaljević et al., 2023; Flavián et al., 2022; Smit et al., 2018) and acceptance of e-services (Lamidi et al., 2023; Mohd Faizal et al., 2022).
Research Gaps
To the best of our knowledge, studies on mobile payments have examined users’ intention to adopt the said technology or their readiness levels in silo (Alalwan et al., 2017; Oliveira et al., 2016; Singh et al., 2020; Trinugroho et al., 2017). Malaysian-based studies have focused on various factors related to mobile payments, mainly based on UTAUT (Munikrishnan et al., 2022) and UTAUT2 (Suo et al., 2021). There is a need to explore the predictors for mobile payment readiness and acceptance in the country considering the uptake of mobile payment services is still low (Malaysian Communication and Multimedia Commission, 2021). Further, as UTAUT2 has been shown to be more predictive when applied to nations that have minimal mobile payment service penetration (Wu & Liu, 2023), an integration with other models could provide a more comprehensive examination of Malaysians readiness and adoption of mobile payment services.
The present study delineates readiness and adoption to investigate their predictors. A user who may perceive themselves to be ready to go cashless for example, may have reservations in adopting the mobile payment technology for several reasons including privacy or security concerns (Belanche et al., 2022; Singh et al., 2020). Therefore, the study proposes to identify the predictors for mobile payment readiness and adoption intent and examine the relationship between the two dependent variables. Secondly, technological studies have also cited intrinsic motivations including enjoyment, confidence, and status as some of the underlying motives in using smartphones (Welcome Madinga & Bongazana Dondolo, 2018), however, these were not well examined in mobile payment studies. In short, our study aims to answer the following research question (RQ):
RQ: What are the predictors that affect Malaysian users’ readiness and intention to adopt mobile payment services?
Specific contributions of the present study are: first, akin to most of the technology acceptance and adoption studies that have integrated and expanded existing theoretical models, we partially adopted two well-known technology-based models, namely, UTAUT2 and TRI 2.0, and further expanded it by including lack of awareness and status (i.e., combined with enjoyment as intrinsic motivation) to determine the predicting factors for mobile payment. Second, unlike most of the existing studies, we took individuals’ personality traits (i.e., technology readiness) into consideration.
Background
Mobile Payment Landscape in Malaysia
Mobile payment generally consists of Internet banking, credit or debit card payment via a Point of Sales system, and e-wallets within a mobile application, all of which are feasible with any electronic devices with Internet connection. According to the Hand Phone User Survey 2021, the mobile phone penetration in Malaysia was reported to have reached an all-time high at 94.8% in 2021 (Malaysian Communication and Multimedia Commission, 2021), with most of the transactions involving communications and social activities. Specifically, text messaging (82.9%), social networking (78.9%), voice calls (78.6%), and video calls (71.0%) were among the top activities performed daily while shopping (41.1%) and banking (38.9%) were among the lowest.
Ownership of mobile phones and the use of Internet was high among Malaysians especially among younger group and those with higher level of education. The same survey reported 99.3% of mobile phone users were using their phones to go online in 2021, compared to 98.7% in 2020. Meanwhile, >4 out of 10 mobile phone users (41.1%) claimed that they shopped using their phones, with 44.1% of them doing so at least once a month. Online shopping has picked up in the last few years, particularly since the COVID-19 pandemic outbreak in 2020. For instance, recent statistics for a popular e-retailer, Shopee, indicate the number of monthly web visits to have increased to 38.3 million in the second quarter 2020 as opposed to 27.3 million in the first quarter 2020 (Statista, 2020a). Despite the increase in online transactions over the years, the mobile economy landscape in Malaysia is lagging compared to other Southeast Asian countries, particularly Hong Kong and Vietnam (Malaysian Communication and Multimedia Commission, 2020; Statista, 2021), with common reasons often include lack of confidence, small device screen, security concerns, overspending and preference to physical ATM as the main barriers (Nizam et al., 2018). According to the Hand Phone User Survey 2021, lack of knowledge, confidence, or skill, as well as a preference for cash/card payments were the major reasons for the low adoption of mobile payment services (i.e., <40%), hence there is room for improvement in Malaysia in terms of creating a cashless society as this is one of the critical success factors in transitioning to a digitalized economy.
Theoretical Underpinnings
A search of the literature shows several models, theories and frameworks developed to examine user acceptance and adoption of new technologies, with the popular ones being TAM and its extensions (Davis, 1989) and UTAUT (Venkatesh et al., 2003). The latter was developed based on eight dominant technology adoption models focusing on the extrinsic motivation of organization users—mirroring TAM’s perceived usefulness and perceived ease of use, as well as gender, age, experience, and voluntariness of use as the moderating variables. It was, however, extended to include intrinsic motivation due to the rise of consumer technologies resulting in a model referred to as UTAUT2 (Venkatesh et al., 2012). Specifically, UTAUT2 comprises seven exogenous constructs, namely, ease of use, usefulness, facilitating conditions and social norms/influence (i.e., from the original UTAUT), and hedonic (intrinsic) motivation, price value and habit. Behavioral intention and use behavior are the dependent (endogenous) variables (Venkatesh et al., 2012).
UTAUT2 is considered a robust and solid theory, with a much higher predictive ability compared to UTAUT (74% vs. 52%) (Venkatesh et al., 2016), with research scholars either adopting the model as is or in combination with other theories (fully or partially) (de Blanes Sebastián et al., 2023; Gansser & Reich, 2021; Oliveira et al., 2016; Semerikova, 2019) or with addition of context specific variables (Alalwan et al., 2017; Thakur & Srivastava, 2014). In comparison to other behavioral intention models such as TAM, UTAUT2 has been shown to have a stronger explanatory power (over 70%) in forecasting how people would utilize new technologies (Albanna et al., 2022; Al-Saedi et al., 2020), hence demonstrating better amplification of user behavior and behavioral intentions (Al-Saedi et al., 2020; Gupta & Arora, 2019; Lin et al., 2021; Singh et al., 2020; Venkatesh et al., 2003, 2012).
Alalwan et al. (2017) extended UTAUT2 by including perceived trust to examine users’ mobile banking adoption in Jordan. In addition, UTAUT2 had been extensively used in technology-based studies worldwide ranging from Western countries including USA (Koohikamali et al., 2017) to developing countries such as Jordan (Alalwan et al., 2017), and India (Singh et al., 2020; Thakur & Srivastava, 2014), and thus reaffirming the generalizability of UTAUT2 across context, countries, and culture. The model also clearly articulates its users to be technology consumers (Venkatesh et al., 2012), hence it can predict an individual’s acceptance and adoption of technology in a voluntary setting such as mobile commerce adoption (Shaw & Sergueeva, 2019), an important point to be noted considering the targeted respondents in the present study are mobile payment consumers. Considering these points, UTAUT2 is deemed fitting as a theoretical foundation for the mobile payment readiness and adoption framework proposed in this study.
However, UTAUT2 does not take individual differences into consideration. Although cognitive models of technology adoption strive to capture how people acquire perceptions about new technologies (Venkatesh et al., 2012), the findings of contextual variable analysis are confined to relatively specific categories of Reyes-Mercado et al. (2023). As a result, in order to effectively explain behavioral intentions and technology acceptance, more stable individual characteristics such as personality traits have to be considered. Technology readiness (TR) measures an individual’s inclination to embrace, and the ability to use new technologies. The Technology Readiness Index (TRI 1.0) model, which encompasses general beliefs toward technology in the form of enablers and barriers (Parasuraman, 2000; Parasuraman & Colby, 2015), is based on four traits: optimism and innovativeness (motivators), discomfort and insecurity (barriers). Being a trait-based framework, it analyzes long-term general individual perceptions of technology and derives its dimensions from long-term attitudinal dispositions to behave in certain ways in relation to technology rather than views of how a given technology functions (Reyes-Mercado et al., 2023). TRI 1.0 defined optimism as a “favorable view of technology and a belief that it offers people increased control, flexibility, and efficiency” in their lives whereas innovativeness refers to an inclination to be a technology pioneer and a leader of ideas. As for the barriers, discomfort is the perceived lack of control over technology and a feeling of being overwhelmed by it whilst insecurity is related to a distrust of technology (Parasuraman, 2000; Parasuraman & Colby, 2015).
The original TRI 1.0 consists of 36-items (Parasuraman, 2000); however, these were later reanalyzed and simplified to TRI 2.0 comprising 16-items (Parasuraman & Colby, 2015), with four items for each of the motivators and barriers. The latter which is considered more robust and parsimonious than TRI 1.0 has been used successfully to measure several technology adoptions such as ICT (Ramírez-Correa et al., 2020) and e-learning platforms (Kaushik & Agrawal, 2021) however, it is less applied in the field of mobile payment except for a few, such as S. A. Rahman et al. (2017). Nevertheless, its traits (factors) have been investigated by several researchers in the domain under study, for example, innovativeness was found to have a significant impact on the adoption of e-wallets in India (Singh et al., 2020; Thakur & Srivastava, 2014), whereas perceived risk and trust (insecurity) were found to negatively affect the adoption of mobile payment (Alalwan et al., 2017; Thakur & Srivastava, 2014).
Further, the extant research has showed technology lack of awareness to inhibit users in adopting mobile payment, along with resistance, poor infrastructural support, lack of data handling and storage mechanisms, etc. (Oliveira et al., 2016; Semerikova, 2019). Other similar studies asserted the users’ lack of awareness and knowledge about mobile payment could affect one’s intention to adopt and use the said technology by decreasing their level of trust and increase the perceived risk (Lim et al., 2019; Semerikova, 2019). Finally, technological studies have cited status as one of the strong motives in mobile phone adoptions (Welcome Madinga & Bongazana Dondolo, 2018), further suggesting that there is a propensity for users to adopt (new) technologies to improve one’s social status.
Therefore, following the literature, we propose to integrate UTAUT2, and TRI 2.0 partially, and further extend our conceptual framework by incorporating lack of awareness and intrinsic motivation to identify the significant factors predicting mobile payment readiness and adoption among Malaysian users.
Hypotheses Formulation
Perceived ease of use represents the level that technology is perceived not to be problematic to learn, operate, and understand. It refers to “a user’s perception of the level of personal effort necessary to operate a technology, for instance, energy and time” (Lian & Li, 2021). Perceived ease of use reveals that consumers do not anticipate investing a lot of energy or time in operating mobile payment software (Venkatesh et al., 2003). Aside from the benefits and positive value of the user’s willingness to adopt technology, the difficulties in using it needs to be taken into account. Users’ willingness to use such technology can be increased if it is not difficult to put into effect (Lian & Li, 2021). Several prior studies on mobile payment adoption have discovered that perceived ease of use is important and positively predictive of whether users intend to adopt the services (Al-Okaily et al., 2022; Al-Okaily & Al-Okaily, 2022; Ekşioğlu & Ural, 2022; Gupta & Arora, 2019; Haritha, 2023). Therefore, we posit that perceived ease of use will have a positive impact on users’ readiness and intention to adopt mobile payment. Hypothesis 1 is given as follows:
H1a: Perceived ease of use predicts readiness in going cashless.
H1b: Perceived ease of use predicts intention to adopt mobile payment.
On the other hand, perceived usefulness is defined as “the consumer’s perception of the superiority of digital payment systems in terms of speed, security and convenience” (Linge et al., 2023). It relates to a service’s or item’s functional value (usefulness) in completing a task or achieving a goal. It is based on the notions of financial anticipated utility and the presumption of economic rationality, and takes into account elements such as a product’s efficiency, affordability, quality, and dependability (Islam et al., 2023). Scholars stated that perceived usefulness is positively associated to technological readiness, specifically online learning readiness (Pham & Dau, 2022), wearable payment readiness (Lee et al., 2020), and readiness for a cashless society (Islam et al., 2023). It was an influential factor that positively influenced the mobile payment services’ adoption (Bailey et al., 2022; Flavián et al., 2020; Haritha, 2023; Linge et al., 2023; Merhi et al., 2019; Rahardja et al., 2023; M. Rahman et al., 2020). Therefore, hypothesis 2 is formulate as follows:
H2a: Perceived usefulness predicts readiness in going cashless.
H2a: Perceived usefulness predicts intention to adopt mobile payment.
A higher adoption is also related to a higher optimism as shown in Singh et al. (2020), Acheampong et al. (2017), and Jung et al. (2020). The studies found that optimism whereby individuals who believe a new technology can provide them with increased flexibility and control have a positive effect on consumer’s attitude in adopting mobile payment technologies, along with perceived effort (Acheampong et al., 2017; Jung et al., 2020). In fact, the motivator was found to be the strongest predictor for US consumers’ intention to use mobile payment technology (Jung et al., 2020). In line with these evidence and strong support for the impact of perceived effort and usefulness, we posit that a mobile payment technology that is effortless to be used and provides benefits to its users will significantly predict users’ readiness and mobile payment adoption intent. Also, mobile payments that help to fulfill users’ expectations while providing immense flexibility and efficiency is believed to affect intention to adopt. The following hypothesis 3 was therefore, formulated:
H3: Perceived optimism predicts readiness in going cashless.
Intrinsic motivation refers to the act of doing something for inherent satisfaction and can be measured using several dimensions including enjoyment and status. In the context of technology adoption, it is the impression of people utilizing the technology for joy and satisfaction (Chaurasia et al., 2019). The factor has been shown to impact intention to adopt new technologies, particularly those deemed to be unique and creative (Alalwan et al., 2017; Bastari et al., 2020), with a higher level of enjoyment in using a new technology resulting in a higher intention to adopt the said technology. Further, people are believed to consider the novelty of a new technology as well as its degree of entertainment when considering using it (Bastari et al., 2020; Lian & Li, 2021). In the context of mobile payment, intrinsic motivation was found to be positively related to cashless readiness (Islam et al., 2023) and adoption of mobile payment (Sahi & Manrai, 2023). Therefore, we posit that intrinsic motivation will have a positive effect on both readiness and mobile payment adoption intent, with the hypotheses given below:
H4a: Intrinsic motivation predicts readiness in going cashless.
H4b: Intrinsic motivation predicts intention to adopt mobile payment.
Technology (trend) awareness is a skill referring to being mindful of a new (or trending) technology, and an individual’s ability to understand its usefulness (Chang et al., 2016). Therefore, a lack of technology awareness can have a negative effect on users’ adoption (Al-Okaily et al., 2022; Aris et al., 2022). Studies worldwide have found technology awareness to positively affect mobile or mobile payment adoption, such as Semerikova (2019) in Russia, Lim et al. (2019) in South Korea, Nwatu and Ezeh (2017) in Nigeria and Issa et al. (2021) in the Middle East. The studies generally found that being conscious of a new technology and its profits is a critical step in mobile payment adoption. An individual needs to be aware of the existence of a product/service, along with the benefits that can be reaped from using it, hence, we posit that a higher technology awareness indicates a higher level of readiness, and vice-versa. H5 is thus formulated as follows:
H5: Lack of awareness negatively predicts readiness in going cashless.
Perceived risk is defined as “an individual’s subjective expectation of suffering a loss in pursuit of a desired outcome” (A. G. Chin et al., 2022). Common risks associated with the use of mobile payment services are related to personal information and money transactions (Rahardja et al., 2023). For instance, a user’s information and data are stored in the cloud and delivered via the Internet. If a user believes the risk they would face is significant, their intention to use mobile payment will be low (Rahardja et al., 2023). Perceived risk is commonly reported to negatively impact the adoption of products and services, particularly evident in technological usage, with the risk primarily stemming from the uncertainty that it is safe or will perform as expected (Im et al., 2008). Interestingly, studies on mobile payments have reported mixed results, although a vast majority of them found perceived risk to have a negative impact on users’ intention to adopt mobile payment technologies (Almaiah et al., 2022; Alrawad et al., 2023; Liébana-Cabanillas & Lara-Rubio, 2017; Oliveira et al., 2016; Senyo & Osabutey, 2020; Shao et al., 2019). Conversely, others such as Singh et al. (2020), Tan et al. (2014), and Wang et al. (2018) found no significant impact of perceived risk on users’ intention and satisfaction in using mobile payment technologies. Others found that users’ perceived usefulness of mobile payments might be negatively influenced by their perception of low security, feeling unsafe to use the technology and therefore reject its adoption (Lim et al., 2019; Oliveira et al., 2016; Semerikova, 2019). As the adoption of mobile payment technologies are low in Malaysia, we hypothesize that perceived risk negatively affects Malaysian consumers’ intention to adopt, hence H6 is given as below:
H6: Perceived risk negatively predicts intention to adopt mobile payment.
Discomfort is defined as a perceived dearth of control over mobile payment technology and a sense of being unsuccessful in using them, with individuals scoring high on the discomfort scale of technology suffering from a perceived lack of control and a sense of being overwhelmed by technology (Parasuraman, 2000). Mobile payment studies found insecurity and discomfort to discourage a potential user from adopting the technology (Acheampong et al., 2017, 2018; Semerikova, 2019). A negative effect of discomfort on perceived ease of use and usefulness, resulting in a lower intention to adopt mobile payments was reported in Acheampong et al. (2017). A further study by Acheampong et al. (2018) found similar results whereby a low level of discomfort with technology decreases the trust, and thus decrease mobile payment readiness among the users. Others including Semerikova (2019) found their respondents to be concerned about dead batteries, slow transaction speed and biometrics identification failure, hence deterring them to go cashless. The complexity of utilizing an unfamiliar system, such as a mobile payment service may cause the users discomfort, hence affecting their use (Upadhyay & Chattopadhyay, 2015). As a result, mobile payments will not be widely adopted until users feel comfortable utilizing the payment features (Wiese & Humbani, 2020). Discomfort is an inhibitor of technology readiness (Parasuraman, 2000; Wiese & Humbani, 2020), and users who score high on discomfort are less likely to adopt a new technology (Na et al., 2021). In a similar vein, discomfort can be explained as an inhibitor of cashless readiness and a negative predictor of mobile payment adoption (Sharma, 2020). In line with these studies, we postulate that perceived discomfort will negatively affect one’s intention to adopt mobile payment technology, and H7 is formulated as follows:
H7: Discomfort negatively predicts intention to adopt mobile payment.
According to Parasuraman (2000), readiness plays a noteworthy role in examining users’ adoption of technology in work/home settings, with a positive mind-set increasing the level of readiness of users for accepting a new technology, as shown in Alalwan et al. (2017), Cimbaljević et al. (2023), Flavián et al. (2022), Leung and Chen (2019), and Shirahada et al. (2019). We, therefore, posit that individuals who score higher on the readiness level will adopt mobile payment technology. H8 is given below:
H8: Readiness predicts intention to adopt mobile payment.
Figure 1 depicts the proposed framework consisting of two dependent variables, and their respective independent variables. Unique variables for each dependent variables are shown on the right side of the framework.

Integrated theoretical framework for mobile payment readiness and adoption.
Methodology
A preliminary set of results was presented in Author (2021), in which risk and intrinsic motivations were examined as mediators among 254 respondents. The present study differs in its aim, factors investigated, statistical approach undertaken and its final respondents. The present study adopted a more meticulous approach whereby potential mobile payment predictors were identified through literature reviews and models, namely UTAUT2 and TRI 2.0. The underlying factor structure and item loadings (Figure 1) were first examined using an Exploratory Factor Analysis (EFA) prior to conducting a Confirmatory Factor Analysis (CFA). As the study is based on adapted scales from UTAUT2, TRI 2.0, and additional variables, their validity and reliability are yet to be established, particularly in the context of mobile payment readiness and adoption intent. This is also true for a country such as Malaysia, whereby studies focusing on mobile payment readiness and adoption intent are scant, hence it was deemed appropriate to first explore the factors through EFA, before verifying its structure through CFA (Knekta et al., 2019).
Instrument
A self-reporting questionnaire was developed in English comprising 26 items in total. The study defines mobile payment as “any form of payment accomplished through digital apps such as mobile wallets.” There were two main parts, namely, A that was used to solicit the demographic profiles of the respondents such as gender, age, education, income levels and the mobile payment services currently being used (if any), among others. On the other hand, Part B comprised items addressing each of the independent and dependent variables, measured using a four-point Likert scale (1—Strongly disagree; 4—Strongly agree). All the items are shown in Table 2 in Section 4. Specifically, items for perceived ease of use, usefulness, Intrinsic Motivation, and Intention to adopt were adapted from UTAUT2 (Venkatesh et al., 2003, 2012; Welcome Madinga & Bongazana Dondolo, 2018), Optimism, Perceived Risk, Discomfort, and Readiness from TRI 2.0 (Parasuraman, 2000; Parasuraman & Colby, 2015), whilst Lack of Awareness were adapted from Oliveira et al. (2016) and Semerikova (2019).
The questionnaire was piloted among 30 respondents, and no major issues were observed. The study also took several proactive measures to reduce common method variances (CMV) including administering the pilot study, ensuring respondents’ anonymity (stated clearly in the questionnaire), relevant terms defined in the questionnaire, items phrased in a simple manner and selecting respondents with sufficient knowledge or experience (generally young and urban-educated in this study), as per the recommendations provided by other scholars (MacKenzie & Podsakoff, 2012).
The Cronbach’s alpha (CA, α) and number of items for each of the factors were: Ease of Use (α = .826; N = 3); Usefulness (α = .782; N = 3); Optimism (α = .861; N = 3); Intrinsic Motivation (α = .911; N = 7); Perceived Risk (α = .818; N = 3); Discomfort (α = .892; N = 3) and Lack of Awareness (α = .903; N = 3). The overall α for the scale was .907, indicating a good reliability. Both the dependent variables contained a single item each, measured using the same four-point Likert scale.
Sampling
A non-probability convenience sampling technique was adopted for data collection due to the inability to obtain the sampling frame, in addition to the relatively easy availability of the targeted respondents. Though it is a non-probability sampling technique, it is deemed appropriate for this study as it allows the researchers to gather quick and useful insights from the respondents (Sarstedt, et al. 2017). Procedural and statistical remedies to reduce potential biases resulting from the use of convenience sampling were adhered to.
Procedure
The questionnaire was disseminated using both the online and offline mediums. To be specific, the online medium involved the dissemination of the Google Form questionnaire link through emails and social media, particularly Facebook. Approximately 350 responses were received, however, most of the respondents were younger than 35 years old. To reduce biasness and to cover a wider range of users, printed questionnaires were distributed to two local universities targeting the working adults. A small token of appreciation was provided to the offline respondents. (i.e., voucher amounting to RM10/USD2.2). Using Z = 1.96; error estimates at 5% and confidence level at 95%, the sample size was established at 377 (Qualtrics, 2020). We allocated approximately 6 weeks for the data collection (minimum number of 377 was achieved at the end of the fourth week), resulting in a total of 436 responses. The data were collected in accordance with the ethical guidelines approved by X (withheld for anonymity).
Respondents
The data collection resulted in 436 respondents. However, two outliers were removed (i.e., age below 18), and thus the sample size was reduced to 434 (Mage = 33.9; SDage = 9.64). The demographic profiles of the respondents are depicted in Table 1.
Demographic Profiles.

It can be observed that more than half the sample were females (56.7%), majority between 25 and 50 years of age (77.2%) and with at least a university degree (99.1%). Most of the respondents also reported an average income (62.2%), with an approximate 25% of them having an income level of below 3 K MYR (714 USD). A huge number of respondents use mobile payments (92.4%), with the majority (50.7%) using more than a service or apps. The frequency of weekly use shows the respondents to mostly use the mobile payments between 4 and 9 times weekly (42.9%), with GrabPay emerging as the most popular mobile payment service among the respondents (48.6%).
Statistical Analysis
Two statistical software were used to analyze the collected data, namely the Statistical Package for Social Sciences (SPSS) 26 and Smart Partial Least Square (Smart PLS 3.2.4). In line with numerous studies suggesting a random split of the dataset for EFA and CFA in the absence of two data collection activities (Fokkema & Greiff, 2017; Knekta et al., 2019), we segregated 200 samples for EFA and the remaining 234 for CFA. These sample sizes were also based on the recommendation provided in Knekta et al. (2019).
A series of preliminary analyses was conducted prior to the execution of EFA. The data distribution was first examined using the Kolgomorov-Smirnov test, with results indicating all the p-values to be significant (i.e., p < .05), hence the data are considered not to be normally distributed. Common method bias (CMB), which refers to “variance that is attributable to the measurement method rather than to the constructs the measure represents” (Podsakoff & Organ, 1986) was assessed using Harman’s single-factor test in SPSS. In simple terms, if a substantial amount of CMB is present, a factor analysis of all the data will result in a single factor accounting for the majority of the covariance in the variables (i.e., >50%). An un-rotated principal component analysis was performed with the largest variance being only 40.9%, hence CMB is not viewed as a threat in this study (Podsakoff & Organ, 1986).
Further, an examination of the communalities (proportion of each variable’s variance that can be explained by the factors) revealed the values to be above 0.5 (i.e., 0.61–0.83), hence indicating no multicollinearity issues. This is further supported with an examination of the inter-item correlations and item-to-total correlations, both of which were above the recommended values of 0.3 and 0.5, respectively. The analysis also revealed the Kaiser-Meyer-Olkin (KMO) of sampling adequacy to be above 0.6 (i.e., 0.899), hence indicating sample size adequacy, whilst the Bartlett’s test of sphericity was found to support the factorability of the correlation matrix (x2 = 7709.46, df = 253, p < .001).
The second stage of the analysis was executed using PLS-SEM—a multivariate technique to test structural models, supporting smaller sample size and a lack of distributional assumptions. The technique is deemed suitable considering our data were not normally distributed. Further, the modeling technique also provides a robust solution when the phenomenon investigated is relatively new, as in the case of going cashless in Malaysia (Akter et al., 2011). The PLS-SEM involves two steps: assessment of reliability and validity followed by estimating the proposed model. The Variance Inflation Factor (VIF) scores for the factors were found to be between 1.10 and 3.03 (i.e., <3.3), hence CMV is not an issue. On the other hand, the criteria used for reliability assessment are factor loadings, CA, and Composite Reliability (CR) to be at least 0.7 whereas Average Variance Extracted (AVE) to be at least 0.5 (Hair et al., 2019). Two measures were used to determine the discriminant validity, namely, the Fornell-Larcker criterion (i.e., each factor’s AVE square roots to surpass their correlations with other factors), and the recently introduced Heterotrait-Monotrait Ratio (HTMT) that requires all the scores to be <0.9 (Henseler et al., 2015).
PLS algorithm was executed to assess the path coefficients and predictive power, whilst bootstrapping (resampling = 5,000) was used to perform the significance tests (i.e., two-tailed t-test with a cut-off value of 1.95). Additionally, we also assessed the Q2 score using the cross validated redundancy (CVR) prediction technique. According to this test, if Q2 > 0, then the dependent (or endogenous) variable is deemed to have a predictive relevance in the model (Hair et al., 2019).
Results
Exploratory Factor Analysis
All the independent variables (see Figure 1) were examined through a Varimax rotation (deemed suitable as our goal is to yield a simple underlying factorial structure, see Brown (2009)), with EFA producing a six-factor solution, as depicted in Table 2. The total variance explained was 73.64%, all with Eigenvalues more than 1.00. Items with loadings <0.5 were removed.
Exploratory Factor Analysis and Their Loadings.

The largest variance for readiness was observed for the first cluster (i.e., 30.85%), comprising five items from both ease of use and usefulness (PEU6 removed), hence this factor was renamed as Perceived Effort and Usefulness (PEU). The second largest variance (12.16%) was noted for Optimism, with all three items loading accordingly. Intrinsic Motivation (IM) with six items in total accounted for 11.66% of the variance whilst Lack of Awareness accounted for the remaining 8.34%. Discomfort and Perceived Risk accounted for 5.68% and 4.95%, respectively. All the items loaded into their respective clusters; hence their names were retained.
All the CA values for the factors were above the recommended value of 0.70, thus indicating a good reliability. The original hypotheses presented in Section 2.3 were renumbered as both ease of use and usefulness loaded into a single factor. This is reflected in the following subsections.
Confirmatory Factor Analysis
The factor solutions from Section 4.1 (Table 2) were then used to validate the model using CFA, using the second sample of 234 respondents.
Reliability and Validity
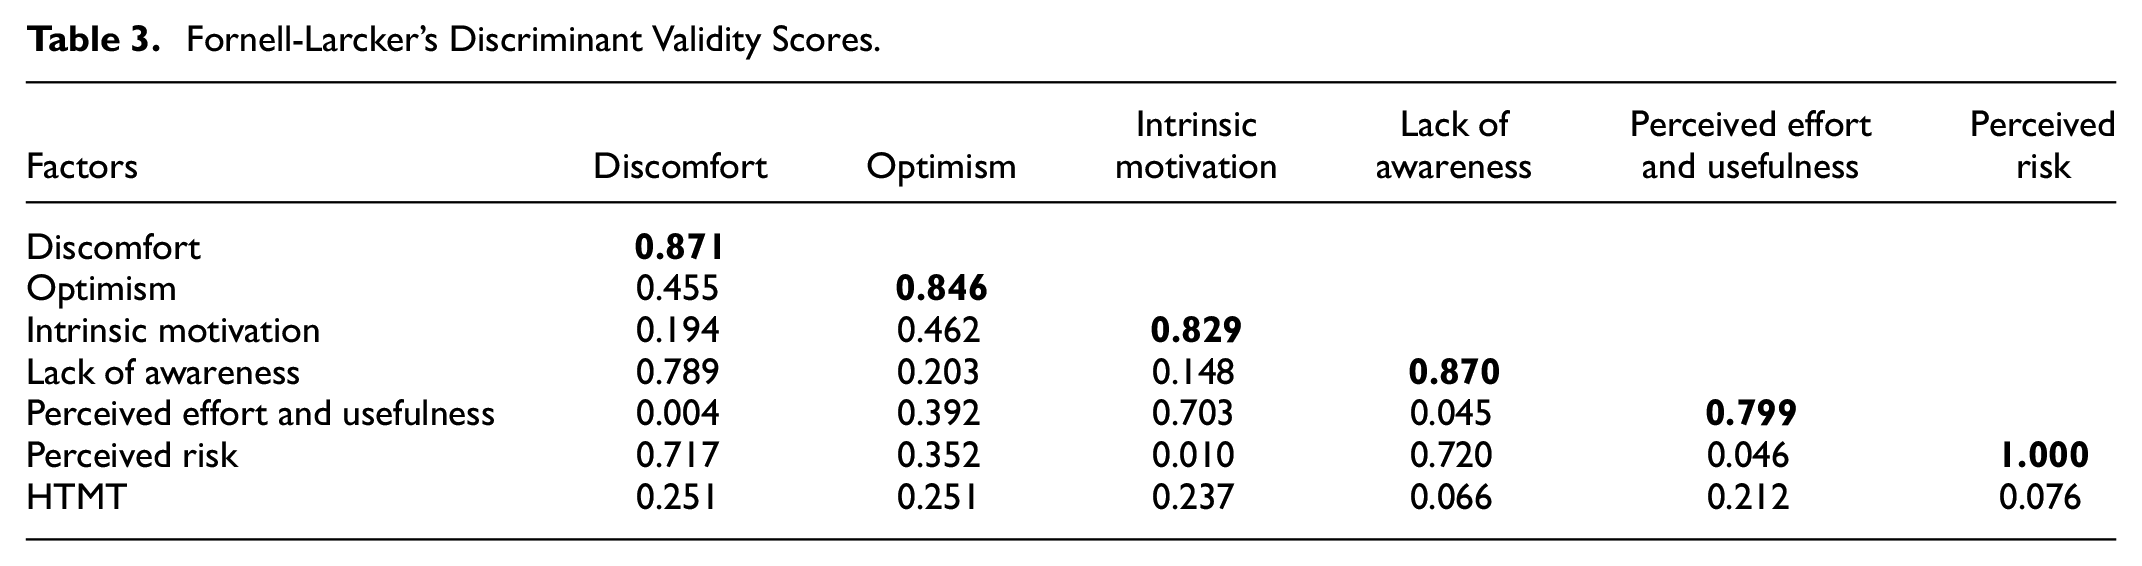
The first step in PLS-SEM involves the assessment of the reliability and validity of the items. Results show all the loadings to be above 0.7, except for PR2 = 0.355, PR3 = 0.403, and LA1 = 0.541, all of which were then excluded from further analysis. The CA, CR, and AVE values were also found to be above their thresholds; hence reliability and validity were established (see Figure 2). Discriminant validity was also established considering all the diagonal values (bold) are more than other factors, as depicted in Table 3. This is further supported by an examination of the HTMT values, which were all <0.9.
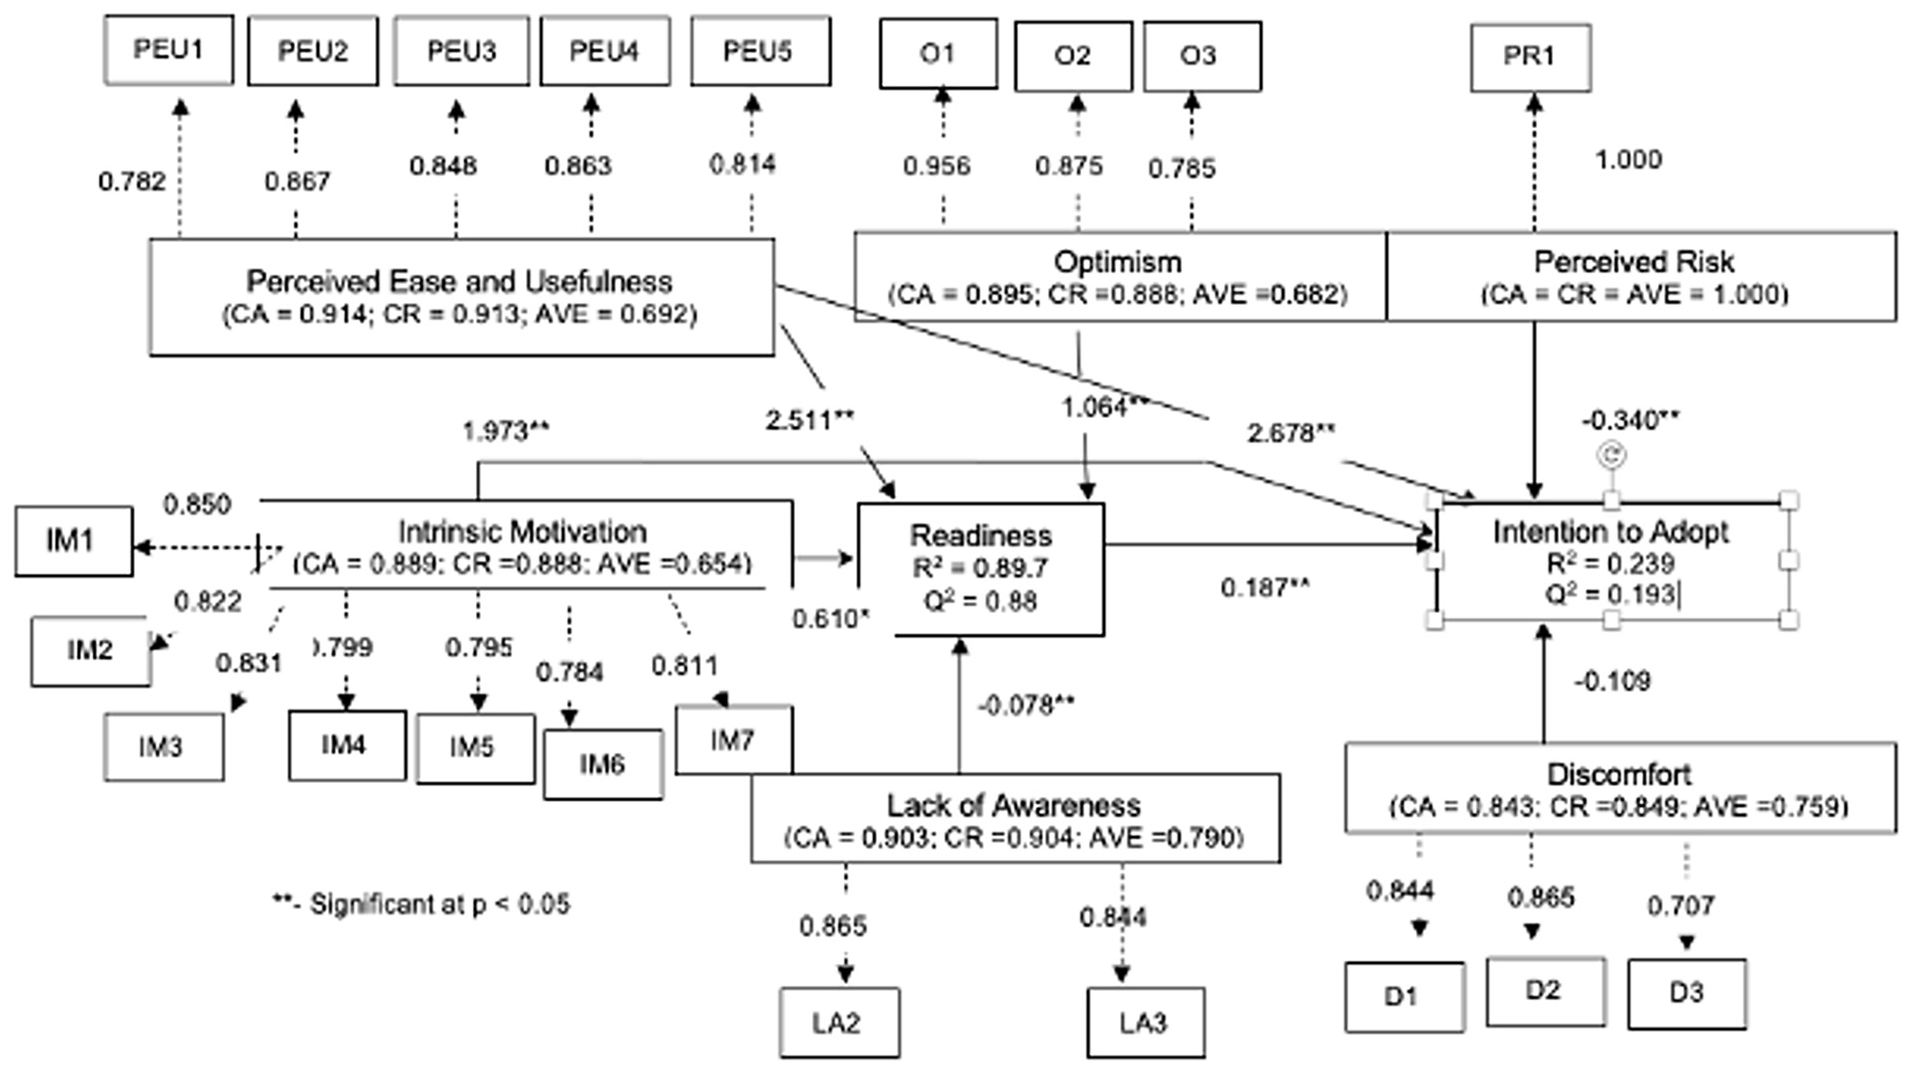
Structured equation modeling.
Fornell-Larcker’s Discriminant Validity Scores.
Structured Equation Modelling
Figure 2 illustrates the results of the structured equation modeling step of the analysis, along with the path coefficients, and significance (marked in **) and the respective R2 and Q2 scores for the dependent variables. A high R2 of 88.9% indicates a very good model for the readiness level of going cashless with PEU (H1a; p < .001), Optimism (H2; p = .003), Intrinsic Motivation (H3a; p = .005), and Lack of Awareness (H4; p = .005) as the significant predictors (strength in the given order). As for the intention to adopt, a lower R2 (23.9%) and Q2 scores were observed. PEU (H1b; p < .001), Intrinsic Motivation (H3b; p < .001), Perceived Risk (H5; p = .002) were found to be significant, however Discomfort (H6; p = .110) was not. The relationship between readiness and intention to adopt was found to be significant as well (H7; p = .036). Table 4 provides the summary of the hypothesis’s tests.
Results and Hypotheses Tests.
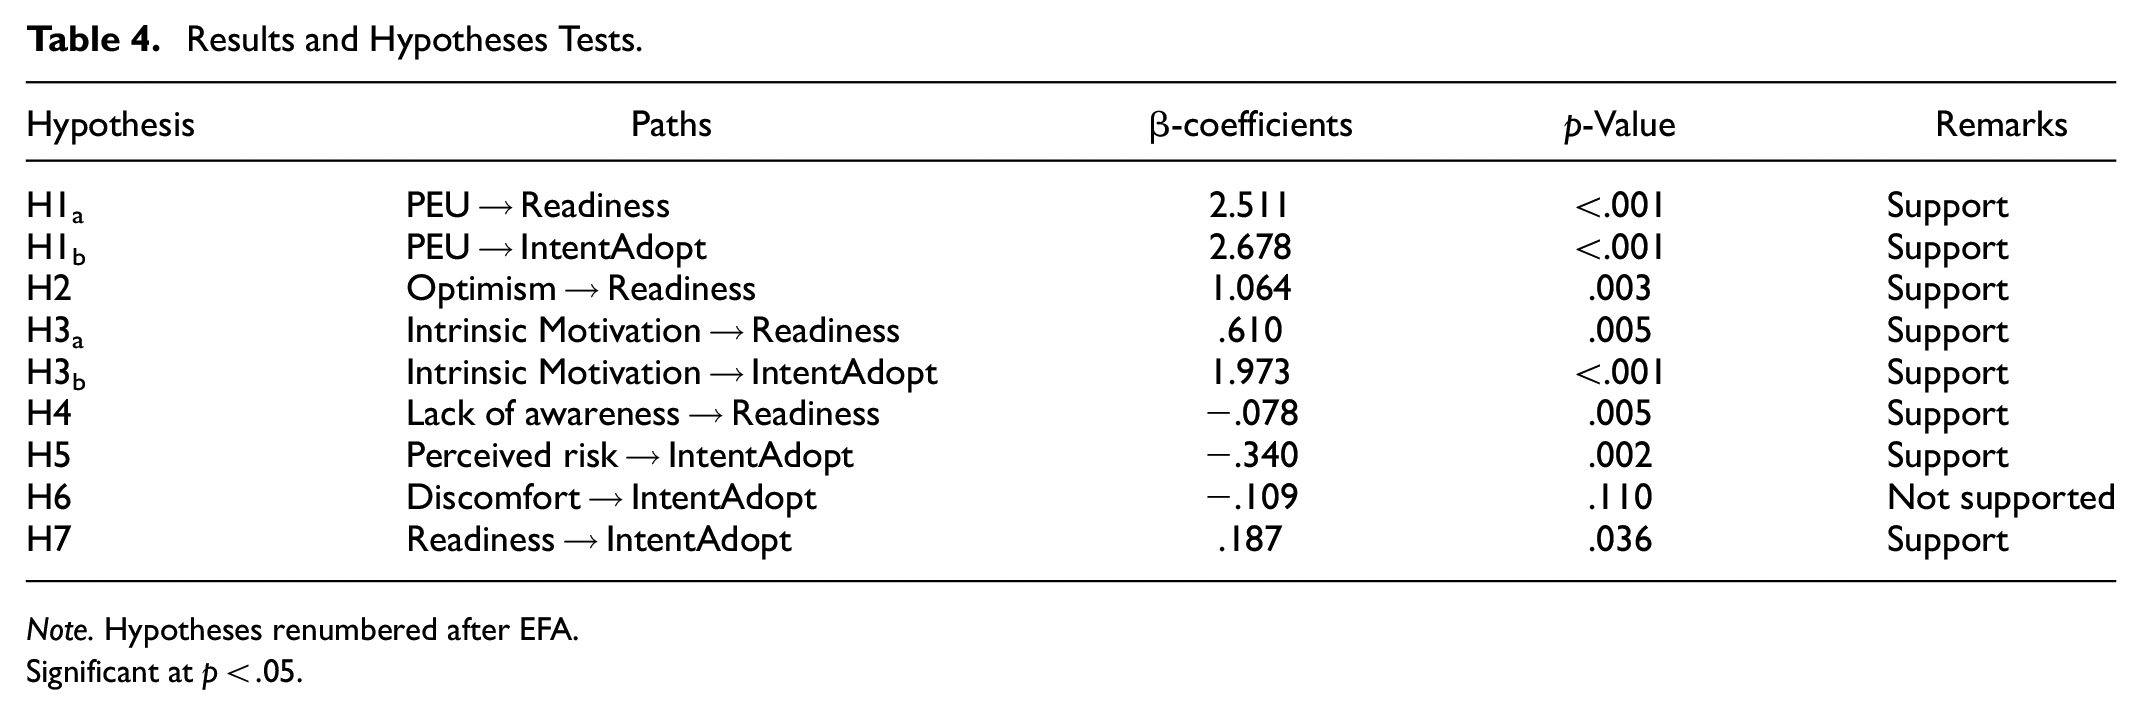
Note. Hypotheses renumbered after EFA.
Significant at p < .05.
Discussion
Perceived Effort and Usefulness (PEU) emerged to be significant in predicting readiness and intention to adopt mobile payment, in coherent with past studies (Alalwan et al., 2017; Al-Okaily et al., 2022; Al-Okaily & Al-Okaily, 2022; Bastari et al., 2020; Chang et al., 2016; Ekşioğlu & Ural, 2022; Gupta & Arora, 2019; Haritha, 2023; Islam et al., 2023; Jung et al., 2020; Rahardja et al., 2023; Singh et al., 2020). As most of our respondents are Millennials (between 21 and 37 years old) who are also well-educated and use mobile payment technology actively, they may have a high self-efficacy in going cashless and using the said technology. A similar sentiment was reflected in Trinugroho et al. (2017) and Chawla and Joshi (2020) where age was found to be negatively associated with readiness in adopting e-payments as they are more exposed and accustomed to technology. Our finding, therefore, point out that mobile payment technology providers should emphasize on the latest technologies that enables individuals to transact efficiently and effectively, and thus enhance the benefits of going cashless as users are inclined to adopt the said technology for its ease of use and usefulness. Conversely, issues of digital inequalities among older adults are a serious concern for its repercussions, in particular the inability to enjoy the convenience associated with the use of technology such as mobile payment (Cham et al., 2022).
Intrinsic Motivation (IM) was also found to be significant in both analyses, suggesting that users may choose to go cashless and use mobile payment as they deem it will enhance their status, and not to mention for simple personal reasons such as enjoyment and fun. The same sentiments were reflected in other studies whereby users were found to adopt or inclined to adopt a new technology for intrinsic motivations (Alalwan et al., 2017; Bastari et al., 2020; Islam et al., 2023; Lian & Li, 2021; Sahi & Manrai, 2023). In terms of the precursor to intrinsic motivations, Li and Wen (2019) echoed the significance of factors such as sense of belonging and trust having large positive impact on enjoyment. Nevertheless, further studies on the impact of extrinsic motivators may yield contrasting or similar findings. For instance, the Malaysian government recent distribution of USD 110 (MYR450 million) in e-cash to 15 million Malaysians in an effort to promote the use of e-wallets have undoubtedly increased the adoption rate (The Star, 2019). However, pursuant to the initial adoption, it remains to be see whether intrinsic and extrinsic motivators promote continuous use of mobile payments.
On the other hand, Lack of Awareness (LA) was found to predict users’ readiness significantly and negatively toward going cashless, indicating that a low level of awareness (usefulness, existence, how and/or when to use etc.) results in a lower score for readiness. In fact, a similar finding was observed among Russian respondents whereby the researcher found almost all the respondents (including those using mobile payment technology) lacked the understanding of how their personal data were managed and protected, hence they were concerned about how their data will be compromised if they were to lose their phones (Semerikova, 2019). The sentiment was also echoed in other studies that reported a lack of understanding of the underlying technology, and its level of security determine an individual’s decision to adopt the technology (Al-Okaily et al., 2022; Aris et al., 2022; Huh et al., 2017; Issa et al., 2021; Lim et al., 2019). A lack of familiarity hinders people from adopting or using something, a trait that is considered natural for humans (Flavian et al., 2006). As other factors such as user resistance and infrastructural condition (Oliveira et al., 2016) also affect the success of going digital, respective authorities including the government should pay close attention in promoting the mobile payment technology. This is particularly true to users from “lesser developed” areas or those lacking in education or technological skill.
Similarly, Perceived Risk had a significant negative effect on users’ intention to adopt mobile payment technology, implying that users are still concerned about matters pertaining to trust in going cashless, in line with past studies (Alalwan et al., 2017; Almaiah et al., 2022; Alrawad et al., 2023; Belanche et al., 2022; Jung et al., 2020; Nizam et al., 2018; Oliveira et al., 2016; Rahardja et al., 2023; Singh et al., 2020). This is a cause for concern, particularly in Malaysia where the mobile adoption payment is relatively low, despite the government’s attempt to encourage more people to migrate toward a cashless society. We could probably assume the risk concerns to be more prominent among the older cohorts, who may have a low self-efficacy in using mobile payments, and thus prefers the traditional method of payment. In fact, a recent survey by Rakuten Insight found approximately 46% of Malaysians above 55 years old had never made any online payment in their lives as they were more comfortable in using cash (Statista, 2020b).
Discomfort was found to be insignificant among our respondents. This was somewhat expected as using portable devices including smartphones, tablets and laptops has been integrated into our daily lives. This is especially true among the younger generation, hence setting up accounts, balancing mobile credit balances etc. are not deemed to be tedious. Most of the respondents may have also adopted new habits (e.g., carry power banks and credit/debit cards) to adapt to the changes brought upon by the mobile payment technology, akin to what was reported by Semerikova (2019) in Russia.
Finally, unlike Author (2021), our findings indicate that being ready to go cashless has a significant positive effect on intention to adopt mobile payment. This is similar with studies reporting users who intend to use mobile payments have a higher inclination to adopt the technology (Choi & Sun, 2016; Cimbaljević et al., 2023; Flavián et al., 2022; Islam et al., 2023; Leung & Chen, 2019; Parasuraman, 2000; M. Yang et al., 2021). The results indicate strong influence of PEU, Optimism and IM on users’ readiness in going cashless, hence authorities should capitalize on these drivers to urge more people to convert to mobile payment technologies. Also, as evidenced by the significant results for Lack of Awareness and Perceived Risk, efforts need to be strategized to increase awareness among the potential users both on the benefits and safety concerns regarding the use of mobile payment.
Conclusion, Implications, Limitation, and Future Work
Conclusion
This study aimed to identify factors predicting Malaysian users’ readiness in going cashless and their intention to adopt mobile payment technology. UTAUT2 and TRI 2.0 were used as the main baseline models. Structured equation modeling revealed our proposed model to have a good predictive power for users’ readiness, however a lower power for intention to adopt. The latter indicates that other factors such as facilitating conditions, social influence, environment or even culture may have a higher influence in intention to adopt, hence future studies should explore these variables further. Our findings indicate PEU, Optimism, IM, and Lack of Awareness to significantly predict users’ readiness whereas PEU, IM, and Perceived Risk had significant influence on intention to adopt. Discomfort was found to be insignificant.
Theoretical Implications
The findings of the present study provide a substantial contribution to the existing body of knowledge regarding mobile payment technology in general, and specifically related to a developing Southeast Asian nation, that is Malaysia. As a matter of fact, the study is deemed timely and worthwhile considering the nation is progressing toward a cashless society, particularly in the COVID-19 pandemic era. The study is based on two popular models, namely UTAUT2 and TRI 2.0, with the inclusion of intrinsic motivation and lack of awareness to predict users’ readiness in going cashless and their intention to adopt mobile payment technology. Unlike UTAUT2, TRI 2.0 had been less applied and investigated in mobile payment studies, hence its incorporation in this study is believed to help extend the literature in the related field. Further, although reasons such as entertainment, enjoyment and fun were often cited as one of the motives for mobile payment adoption, status symbol is under-researched, along with lack of awareness. Our significant results therefore indicate the need to include these two factors in a technology-related model.
The salient findings indicate significant predictors for going cashless and intention to adopt mobile payment technology. These help to provide an insight into what may motivate/hinder a user from accepting and using newly introduced mobile payment technology. For example, mobile payment providers should investigate improving their promotional campaigns so that other than enticing users using attractive discounts and rebates, more emphasis should be given in increasing the public’s awareness in the safety of going cashless. These providers should work together with the financial institutions in ensuring that all mobile payment transactions are secure, reliable, seamless, efficient, and effective, and thus positively reflect on people’s perception toward mobile payment technology as a safe and trustworthy platform to perform financial transactions. This is especially crucial for any country that is progressing toward going completely cashless in the future, like Malaysia.
Practical Implications
Awareness and education in technology use should particularly target the older generations, and not to mention those who are less educated. One possible way to go about this is to increase mobile payment technology visibility through attractive advertisements in the form of easy-to-understand animation, videos etc. through social media platforms, such as Facebook and YouTube as Malaysians have been shown to be active social media users (Statista, 2020c). However, these advertisement and marketing strategies should not be limited to social media, but further emphasized through the traditional medium of television and radio—a platform that is still favored by the older generation. We acknowledge that this recommendation may require a substantial amount of time and resources, but it is necessary if one is envisioning a cashless nation.
Finally, having top notch marketing and educational campaigns alone are not going to propel a nation into a wholly cashless country. One of the major issues in any technology-based advancement in developing nations is the infrastructure (Trinugroho et al., 2017). Despite a high Internet penetration rate, the Global Index revealed Malaysia is lagging its Asian neighbors (Ranked #7) in terms of its mobile speeds, with Singapore, Thailand and Vietnam leading the list. Further, unlike countries such as Thailand, Singapore and Vietnam, the 5G deployment was only launched actively this year, achieving 57.8% roll-out as of May 2023 (Amrie & Goh, 2023). More efforts need to be channeled into improving the local broadband infrastructure to encourage more people to adopt mobile payment technology in the country, deemed more crucial during the COVID-19 outbreak that has forced most people to work and study from home.
Limitation and Future Works
We identify several limitations. Many of the respondents in this study are urbanites comprising the younger generations (i.e., Millennials), hence further investigations are needed to fully understand the factors predicting readiness and intention to adopt among the general population in the country. We recommend other data collection strategies including interviews and/or face to face surveys so that residents living in rural areas (or areas with poor Internet connections) or those with low education levels can be included.
The study adopted self-reporting surveys, and this may result in issues such as social desirability and false reporting. Although questionnaire surveys provide an efficient and convenient manner to solicit users’ perceptions pertaining to a topic of interest, other data collection techniques such as focus group studies and interviews could be administered to gather more “richer” data. We, therefore, recommend future studies to adopt several approaches in data collection, preferably one that involves both quantitative and qualitative data. The qualitative data can be gathered through interviews conducted with older generations or those who are not active on social media to ensure a wide spectrum of users are covered. Future studies could also solicit data through social media platforms (textual communication) and administer advanced natural language processing (NLP) techniques to analyze the data (e.g., sentiment analysis to classify the communications into positive, negative, or neutral).
Footnotes
Declaration of Conflicting Interests
The author(s) declared no potential conflicts of interest with respect to the research, authorship, and/or publication of this article.
Funding
The author(s) received no financial support for the research, authorship, and/or publication of this article.
Ethics Declaration
Ethics approval was obtained from Universiti Malaya Research Committee - UM.TNC2/UMREC_2378
Research Data Availability
The data will be made available based upon a reasonable request.