
Abstract
Research has been limited on what factors may make customers feel uncomfortable with using electronic payment systems. The purpose of this research study was to develop a model that analyzed the dimensions of the unifiB01;ed theory of acceptance and use of technology (UTAUT) with extra structures to understand how gender can affect whether consumers decide to embrace cashless payment systems in Thailand. Accordingly, 416 valid answers were submitted by banking customers utilizing the survey instrument. Exploratory factor analysis (EFA) and confirmatory factor analysis (CFA) were employed to kick off the process of creating a measurement model. Structural equation modeling (SEM) was then used to pinpoint the most pressing factors that prevent people from embracing online banking systems. The purpose of this research was to develop a technology acceptance model with extra structures to understand how attitudes and perceived risks affect people’s decision-making process as to whether they embrace cashless payment systems in Thailand (i.e., innovativeness). In the second stage, we used a neural network model to rank the importance of various SEM-derived predictions. The results demonstrate a robust association between Internet banking and the value barrier, the risk barrier, and the image barrier. The only factor that indicated any kind of negative influence on whether people chose to use Internet banking was the conventional barrier. Remarkably, the image barrier affected Internet banking adoption more than the risk barrier or the no-frills alternative. Furthermore, according to the data, men experienced greater challenges than women. The findings of this study may help financial institutions create offerings that entice customers to conduct financial dealings with them online. The banking industry could immensely benefit from this research since it may lead to changes in the laws that govern banking and could ultimately enhance customer service and online services.
Plain Language Summary
The purpose of this research was to develop a model that would examine a study that used the technology acceptance model with extra structures to understand how attitudes and perceived risk affect people’s decisions to embrace cashless payment systems in Thailand (i.e., innovativeness). There were 416 valid answers collected from bank customers utilizing the survey instrument. Exploratory factor analysis (EFA) and confirmatory factor analysis (CFA) were employed to kick off the process of creating a measurement model. Then, structural equation modeling (SEM) was used to pinpoint the most pressing factors preventing people from adopting online banking of this research was to develop a model that would examine a study that used the technology acceptance model with extra structures to understand how attitudes and perceived risk affect people’s decisions to embrace cashless payment systems in Thailand (i.e., innovativeness). There were 416 valid answers collected from bank customers utilizing the survey instrument. Exploratory factor analysis (EFA) and confirmatory factor analysis (CFA) were employed to kick off the process of creating a measurement model. Then, structural equation modeling (SEM) was used to pinpoint the most pressing factors preventing people from adopting online banking. In the second stage, we used the neural network model to rank the importance of various SEM derived predictions. The results demonstrate a robust association between Internet banking and the value barrier, the risk barrier, and the image barrier.
Keywords
Introduction
Financial technology has transformed the banking and financial industries around the world, making previously inaccessible services more widely available in developed countries and opening up new opportunities for underbanked and unbanked people in developing countries. Financial technology has helped emerging countries provide access to rural and poor people. Notably, OECD countries have twice as many adults with bank accounts as underdeveloped ones (Demirguc-Kunt et al., 2015). However, conventional banks in developing countries are facing significant pressure to reform their systems and services. Between yearly maintenance fees and other startup costs, opening a bank account can be expensive (Beck et al., 2008). Conventional banking has several downsides that include long lines, long travel times, and irregular banking hours (Dupas et al., 2012). Moreover, bank customers in these underdeveloped countries typically cannot afford transaction fees (Bachas et al., 2016).
Financial services now include peer-to-peer (P2P) transfers, automated bill payment, and proximity-based payments at the point of sale due to advances in financial technology that are associated with banking and payment systems. Many financial institutions have adopted “branchless banking” (Ivatury & Mas, 2008) to save money and serve low-income consumers. Thus, banks have launched different services that may be accessible through ATMs, corporate websites, and mobile phone apps (Talukder et al., 2020). In this regard, mobile wallets make cashless transactions straightforward and fast (Krivosheya & Korolev, 2016; Semerikova, 2019); consequently, consumers would be more likely to utilize non-cash instruments.
We now have a better understanding of the primary factors that influence the adoption of cashless payment systems in some non-Asian countries, such as Iran (Hojjati & Rabi, 2013), Turkey (Akturan & Tezcan, 2012), Jordan (Alalwan et al., 2017), Portugal (Oliveira et al., 2016), and Lebanon (Arvidsson, 2014; Hampshire, 2017). In a 2016 study (Tarhini et al., 2016), Taiwan (Lee, 2009), Singapore (Riquelme & Rios, 2010), Malaysia (Tan & Lau, 2016), and the Philippines were identified as some of the Asian nations where the prevalence of mobile banking and cashless payment systems have been studied by academics (Chiu et al., 2017). In Thailand, many people are open to the idea of a cashless society. True Money, Rabbit Line Pay, WePay, and other systems have all been developed by non-governmental organizations that are actively engaged in e-commerce. In the first 3 months of 2019, Thai consumers used cashless payment methods to purchase at least 473.27 million items valued at a minimum of 67 billion baht, according to data obtained from the Bank of Thailand. Throughout 2018, consumers spent a total of 209 billion Thai baht on 1,510.84 million items. Only 1.272.22 billion items worth 126 billion baht were purchased through cashless payment transactions; however, this was an increase over what was purchased in 2017. According to the Bank of Thailand (2019), some people still insist on using cash for their purchases, despite the proliferation of cashless payment options (Arango et al., 2015). A study on this topic was just recently published (van der Cruijsen et al., 2017). Accordingly, certain individual characteristics were found to have a pivotal role in shaping monetary options. Cashless payment methods in India have been studied by Madan and Yadav (2016) and Deb and Agrawal (2017). Due to the relative newness of bank payments in India, only a small number of studies have been conducted to examine the inherent difficulties associated with using such technology. As several sources have shown (Abid, 2017; Ernst & Young, 2016; Goel & Manrai, 2016; Kohli & Patel, 2016), this is an area that has not been fully studied in Thailand; however, it will be essential to look at the habits of people who would likely opt to use payment services in the future.
This study aimed to identify the individual characteristics that influence the dimensions of unifiB01;ed theory of acceptance and use of technology (UTAUT) with extra structures to understand how gender can affect whether consumers decide to embrace cashless payment systems in Thailand. Many consumers still choose to pay with cash, despite the widespread availability of electronic payment alternatives. Therefore, the goal of this study was to determine what sets people on the path toward adopting cashless payment systems. Researchers, system providers, marketers, and regulators in the mobile payment industry may all have a lot to gain from the studies now underway. In order to promote the widespread use of cashless payments, this essay offers managerial and economic insights into the usage of innovative financial technologies. Financial innovations are often offered in the retail payment industry to motivate customer action. Consequently, managers and other market representatives for financial services can analyze the effects of financial innovation on consumer behavior and the ramifications of adopting financial innovations into their products and services (Deb & Agrawal, 2017).
Theoretical Background and Hypothesis Development
Overview of Technology Acceptance Context
Due to the difficulty associated with managing a large variety of technological models, researchers are pursuing a synthesis of many technologies adoption models. Venkatesh et al. (2012) developed UTAUT, which integrates eight prominent theories and models from IS/IT adoption research, including the Technology Acceptance Model (TAM), the Motivational Model (MM), the combined TPB and TAM, the Diffusion of Innovations (DOI) theory, the Model of Perceived Credibility (PC), and Utilization (MPCU; SCT). The UTAUT hypothesis prevails because it offers a coherent framework for eight other hypotheses (Lu et al., 2011; Talukder et al., 2020). This theoretical model includes two internal variables, “behavioral intention” and 30 external variables (EE, PE, SI, and FC; Liébana-Cabanillas et al., 2017; Morosan & DeFranco, 2016a; Talukder et al., 2020). It is a complete model that predicts how people utilize many different kinds of technical systems.
Research on the factors of social influence, performance expectations, effort expectations, and the enabling circumstances that influence the consumers’ adoption of mobile commerce has been conducted using the UTAUT model. These previous research studies have employed tools that study the use of mobile banking services by consumers (Sharma, 2017); learning management systems by consumers (Ooi & Tan, 2016); and cashless payment methods by consumers (Baptista & Oliveira, 2016). An analysis of the viability of introducing mobile payments has indicated that consumers were willing to take on the inherent risk of using their mobile devices. (Ooi & Tan, 2016).
Therefore, performance and effort expectations, social influence, and enabling variables all play a role in shaping behavioral intention (Oliveira et al., 2016). The most important factor in determining whether or not consumers would adopt a product is their anticipation of how its use will affect their performance in the workplace (Talukder et al., 2020).
Development of Hypotheses and Proposed Framework
Venkatesh et al. (2012) designed the standard UTAUT model. This concept has been recognized as a direct component of the UTAUT characteristics employed in this research as direct predictors of the consumers’ readiness to embrace cashless payment systems, namely performance expectancy (PE), effort expectancy (EE), social influence (SI), and facilitating conditions (FC).
Performance Expectancy
Performance expectancy has five distinct components: perceived usefulness (TAM and TAM2), work fit (MPCU), extrinsic motivation (MM), relative advantage (IDT), and outcome expectations (SCT). Performance expectation refers to the extent to which consumers expect information systems or technologies to increase their performance and is related to the above notions (Alalwan et al., 2017; Baabdullah et al., 2019; Venkatesh, 2000). TAM2, work fit (MPCU), extrinsic motivation (MM), relative advantage (IDT), and outcome expectancies are the five distinct components associated with performance expectancy (SCT). PE is the best indication of consumers’ technology adoption intents and viewpoints according to our research (Venkatesh et al., 2012). PE or its representative constructs strongly correlate with customers’ views in many global e-banking surveys (e.g., Alaeddin et al., 2018; Bailey et al., 2017; Wulandari, 2017). Aslam et al. (2017) and Tian and Dong (2013) investigated Chinese and Pakistani mobile payment services. Customers’ evaluations were found to be strongly impacted by utility. Wulandari (2017) found that PU strongly impacted cashless tourist payments in Indonesia. Bailey et al. (2017) and Schierz et al. (2010) studied mobile payment uptake in Germany and the US, respectively. Additionally, utility perceptions strongly influenced customers’ views. It was determined that high performance requirements may help electronic payment systems proliferate.
Effort Expectancy
Perceived ease of use (TAM/TAM2), complexity (MPCU), and ease of use (IDT) are associated with effort expectations (Talukder et al., 2020). Recent research has examined EE’s effects (e.g., Bailey et al., 2017; Wulandari, 2017). They also studied other client cashless payment views. However, the findings of other published studies contradict these conclusions (such as those by Aslam et al., 2017). Due to PEOU’s ineffectiveness, consumers thought a cashless payment system would be difficult to use. Aslam et al. (2017) found this relationship essential to numerous cashless payment systems, while other cashless payment methods were not necessarily impacted. De Luna et al. (2019) examined customer adoption of SMS, NFC, and QR payments (QR). They believed PEOU would improve SMS attitudes. Accordingly, SMS-based solutions were younger than NFC- and QR-code-based ones (Sharma, 2017) and adoption dropped as buyers realized their intricacy.
Social Influence
The social effect is linked to consumers’ subjective norms (TRA, TAM2, TPB, and DTPB), social characteristics (MPCU), and pictures (IDT; e.g., family, friends, and colleagues). Accordingly, when age, gender, and experience are accounted for, all UTAUT and UTAUT2 traits can be employed to predict behavioral intentions. Using the meta-UTAUT model, Dwivedi et al. (2019) identified social influence on behavioral intentions without employing a moderator. Recent research conducted in China (Guo & Lu, 2017), Qatar (Musa et al., 2015), and Portugal (Oliveira et al., 2016) highlights the societal effect on cashless payment behavior. Slade et al. (2015) examined UK RMP consumer interest and intent. They believed social persuasion might convert non-users to RMP. A recent study found that cashless payment techniques, including mobile banking and payment, may minimize risk and increase consumer trust in financial organizations. Due to ambiguity and a sense of financial and security risk, this can cause anxiety for online financial transaction clients (Hanafizadeh et al., 2014; Leong et al., 2013). Cashless transactions protect personal financial data and make individuals more willing to accept new technology (Duane et al., 2014). To appropriately assess customers’ opinions about cashless payments, a study of relevant social considerations may encourage the use of digital currency and check its limitations.
Facilitating Conditions
According to Venkatesh et al. (2012), social impact can capture subjective norms in TRA, TAM, TPB/DTPB, and CTAM-TPB, as well as social factors in MPCU and imagery in IDT. Facilitating conditions include convincing people of the importance of technology usage. Based on the fiB01;ndings of Sivathanu (2019), FC is positively associated with using mobile payment systems. Liébana-Cabanillas et al. (2017) found that one’s thoughts and attitudes toward using social networks can affect the consumers’ interest in mobile banking. Singh et al. (2010) discovered that social forces drove mobile commerce users. In contrast to Ramos de Luna et al., 2016; Shibchurn and Yan, 2015 reported that subject norms influenced mobile banking uptake. The above may explain why Sivathanu (2019) hypothesized that mobile payment users are social networkers and technology consumers.
In Figure 1, we see the proposed model.

Research model.
Moderator: Gender
Studies on technology adoption employ a variety of moderators (Sun & Zhang, 2006). Using three categories, Sun & Zhang (2006) effectively divided these moderators. Organizational variables make up the first category, technology elements make up the second group, and personal factors, including age, gender, and money, make up the third group. Gender may be a key factor in the behavioral intention of technology adoption research, according to other studies (Humbani, 2018). According to the gender schema theory, which takes into account gender in consumer behavior models (Riquelme & Rios, 2010), gender has a substantial impact on choice. Males and females respond differently when making decisions, according to a prior study (Riquelme & Rios, 2010). Additionally, Humbani (2018) found that technological readiness, age, and gender influence how consumers adopt technology for cashless payment systems. Notably, gender has been identified as a moderator variable in this study.
Research Methodology
A statistical survey technique was employed for this study. Monitoring latent structures can easily be accomplished thanks to the multiplicity of scales that can be used to confirm the results obtained from previous research conducted on cashless payment systems (Rana et al., 2013; Slade et al., 2015). There were two specified sections to the survey form. Accordingly, the survey was divided into two parts: the first tested the consumers’ familiarity with electronic payment methods, while the second outlined their demographics.
Population Sampling and Data Collection
The method created by Cochran (1953) was used to determine the sample size for this study. Herein, 385 people made up the bare minimal sample size for this investigation.
Online surveys were used to acquire the relevant data. Before distributing the questionnaire, the researcher described the nature of the study to ensure a suitable sample. The survey included filtered questions for usage with mobile banking applications and smartphones. Each respondent was determined to have qualified for final selection by having significant experience with mobile applications. Otherwise, they would have to spend at least 3 months getting trained on using a smartphone and mobile banking (Mclean et al., 2018).
Employing the snowball sampling technique, respondents were continuously chosen through personal connections such as friends or acquaintances (Couto et al., 2013). To gather responses from participants on their social network platforms, the researchers also employed convenient sampling methods (Saunders et al., 2007). Including only student respondents in the survey would have resulted in skewed research findings, reflecting solely the student population (Bhattacherjee, 2012).
People who had previously used the cashless payment method were given online questionnaires. Alternatively, these questionnaires were forwarded to others by the first respondent. Five hundred customers of the bank received the questionnaire; 320 of them responded and returned it. As a result, the response rate was determined to be 64%. Twenty replies were eliminated during data filtering, bringing the total number of responses down to 300.
Although this study was susceptible to common method bias (CMB) inherent in self-administered surveys (Podsakoff et al., 2003), the researchers conducted Harman’s single-factor test. This test is considered the most reliable approach for identifying CMB (Malhotra & Birks, 2006). The cumulative variance extracted value in Harman’s single factor analysis was found to be 40.17%, which fell below the 50% threshold, indicating the absence of CMB.
Variable Measurement
Information for the study was gathered with the use of a questionnaire. The questionnaire was prepared using the following tools:
The 12 questions and 4 factors that make up the UTAUT scale were established from research conducted by Venkatesh et al. (2012) and Belanger and Carter (2008).
The Items of Behavioral Intention to Use were comprised of three separate items culled from the research studies of Lai and Li (2005), Nasri and Charfeddine (2012), and Namahoot and Laohavichien (2018).
Each questionnaire measure was evaluated using a 5-point Likert scale, with 1 designating “strongly disagree,” 2 “disagree,” 3 “neither agree nor disagree,” 4 “agree,” and 5 “strongly agree.” In response to each of the allegations, respondents were directed to place a mark on these scales.
Validation of Measures
The questionnaire’s validity was assessed using two approaches. Professional and pilot testing identified any potential issues before data collection. The length of the survey was also specified. According to Saunders et al. (2007), a professional panel should evaluate and pilot test a preliminary version of the questionnaire. The length of the survey had also been specified. To verify questions, an expert representative would cross-examine the participants (Hair et al., 2010). The questionnaires were then double-checked by the researchers. Experts assessed and pilot-tested problems before gathering data. The questionnaire indicated an appropriate completion time. Professionals reviewed the questionnaire’s first draft (Saunders et al., 2007). Cross-examination of the expert witness would then verify the answers (Hair et al., 2010). The survey instrument was also tested on Thai bank IT personnel and a number of famous academics. Pre-testing then confirmed the instrument. The early test included 30 Thai cashless payment users. Respondents commented on the instrument’s phrase structure, phrasing, format, duration, vocabulary, and scale terminology (Bhattacherjee, 2012; Dwivedi et al., 2008; Saunders et al., 2007; Weerakkody et al., 2017). The instrument was then further validated. IBM SPSS version 20 was used to evaluate the accuracy of these 30 individuals’ replies. Cronbach’s alpha for the questionnaire’s 22 questions was .875%, which was substantially higher than the necessary minimum of .7%. Thus, the instrument’s reliability was determined to be excellent (Hair et al., 2010).
Statistical Method
A reliability analysis was conducted to check the instrument’s internal consistency, while exploratory factor analysis and correlation analysis were carried out. Then, the confirmatory factor analysis and structural equation modeling were applied.
The model used for the research is:

Where: BI = Behavioral Intention to use, PE = Performance Expectancy, EE = Effort Expectancy SI = Social Influence, and FC = Facilitating Conditions.
Data Analysis and Results
The conjectures were evaluated through the utilization of confirmatory factor analysis (CFA), assessing convergent validity via average variance extracted (AVE), evaluating discriminant validity, and employing structural equation modeling. Frequency and descriptive analyses were conducted to examine averages, percentages, and variances using SEM. To validate and refine the models, SEM was applied by Anderson and Gerbing (1988).
Descriptive Statistics
Five hundred total useable responses to an online survey questionnaire were obtained for this investigation. A final test sample of 416 surveys was created after the preliminary analysis indicated that 84 replies had z-scores larger than (−3, 3) and were eliminated from further analysis to verify that there were no outliers.
Frequency analysis was utilized to investigate the demographic features of the 416 respondents. The majority of respondents (61%) were female (40.00%), between the ages of 31 and 35 (55.30%), had a bachelor’s degree (30.50%), worked as government workers (49.7%), and earned more than 30,000 Baht per month (49.7%). Approximately 40.60% of respondents had utilized cashless payment methods for between 1 and 3 years.
Because they viewed using the online platform as a handy payment method (4.430) in Performance Expectancy, bank consumers expressed the least amount of concern regarding UTAUT. They stated in Effort Expectancy that “the internet platform is easy to use” (4.284). Additionally, they anticipated that “using the web platform helps you feel modern” in terms of social influence (3.911).
Assessment of Univariate Normality
A three-step measuring explanation model was employed. In the first step, all model components met the normality assumption by having skewness and kurtosis values of less than 2 (+2.0) and 7 (+7.0), respectively (Curran et al., 1996). Cronbach’s alpha was used to assess construction reliability and scale internal consistency. All Cronbach’s alpha values may exceed .70 according to the standard cutoff level (Hair et.al., 2010). After these revisions and the reliability test, the questionnaire’s 22 Cronbach’s alphas were .806 (PE), .791 (EE), .754 (SI), .800 (FC), and .701 (PE; BI), thereby proving that the obtained data was appropriate to perform factor analysis (Table 1 presents the total outcomes).
Results of Reliability analysis and Exploratory Factor Analysis (EFA).

Reliability, EFA, and CFA were used to assess adequacy. Table 1 presents exploratory component analysis using varimax rotation and varied Cronbach’s alpha values. Hair et al. (2010) recommends a minimum Cronbach’s value of .70, whereas Nunnally and Bernstein (1994) prefer .70. All values over .70 meet the criteria. Hair et al. (2010) recommends factor loadings above 0.5 for each item. CFA assessed model fitness, convergent validity, and discriminant validity after the desired findings. Ultimately, SEM was employed to assess variable causality.
Convergent Validity
This study tested the questionnaire’s convergent validity using factor loading, composite reliability (CR), and AVE values and conditions (Fornell & Larcker, 1981).
Table 2 presents the findings of the analysis from our investigation.
Standardized factor loadings demonstrated that each scale item was significantly associated with a single latent variable. It is necessary for the factor loading to be greater than 0.6. As reported by Suh and Hann (2003), each scale item was significantly associated with a single latent variable. It is also necessary for the factor loading to be greater than 0.6 as has been reported by Suh and Han (2003).
CR is a measure of how well the items avoided random error and consistently produced the same outcomes. The value of CR must be greater than .7 according to Hair et al. (2010).
Thirdly, AVE quantifies how much the latent variable influences the variance of the random measurement error. In order for the AVE to be regarded as satisfactory, it must be greater than 0 (Fornell & Larcker, 1981).
Based on the results of the standardized loadings and validity (Table 2), all values (factor loading, CR, and AVE) met the above criteria, which indicated that the convergent validity was very good.
Results of Standardized Loading and Validity.

Discriminant Validity
Fornell and Larcker (1981) observed that comparing the square root of AVE to the correlation between each variable and every other variable indicated the constructs’ discriminant validity.
The square root of the AVE values was clearly above the correlation values. This indicated high discriminant validity according to the results of the standardized loadings and validity, and was supported by the discriminate validity of the constructs. It can be clearly observed from Table 2 that the constructs exhibited a good degree of internal consistency. Hence, it can be concluded that the obtained sample dataset exhibits high convergent validity.
Assessment of the Measurement Model
CFA was assessed in the second phase using a set of 16 items. How well the SEM matched the observed covariance matrix between the indicator items was used to evaluate the model’s goodness-of-fit. Several indicators were examined to evaluate the model fit; these were then grouped into the four classes as is shown below (Hair et al., 2010). This table shows that the data fit the measurement model well (CMIN = 3.838, p > .000). CFI = 0.920, IFI = 0.920, TLI = 0.900, AGFI = 0.852, and PNFI = 0.620. RMSEA = 0.083, RMR = 0.020.
Structural Model Results on the Basis of Gender
We split the data into male and female respondents and used a reworked version of the grouping variable technique of the Amos process to assess the mediating role of gender (Riquelme & Rios, 2010). The proportion of male to female respondents fluctuated in our data, but this can be used for comparison as long as the differences between the sexes are similar (Humbani, 2018). Since the same population was used for both sets of data, it is safe to infer that there was no significant difference in the variance between them. Furthermore, Singh and Masuku (2014) emphasized that comparing groups with varying sample sizes was possible. The results of the path coefficients are shown in Table 3. For women, all variables save performance expectations were important, but for men, only social influence mattered. In the minds of many consumers, using a Cashless Payment System would be much more convenient than going to a physical bank branch to withdraw cash. There was no difference between the sexes in terms of performance expectations; however, there were differences in terms of effort expectations, social influence, and enabling factors. R squared values for men and women were .71 and .75, respectively.
Comparison of the Path Coefficient on the Basis of Gender.
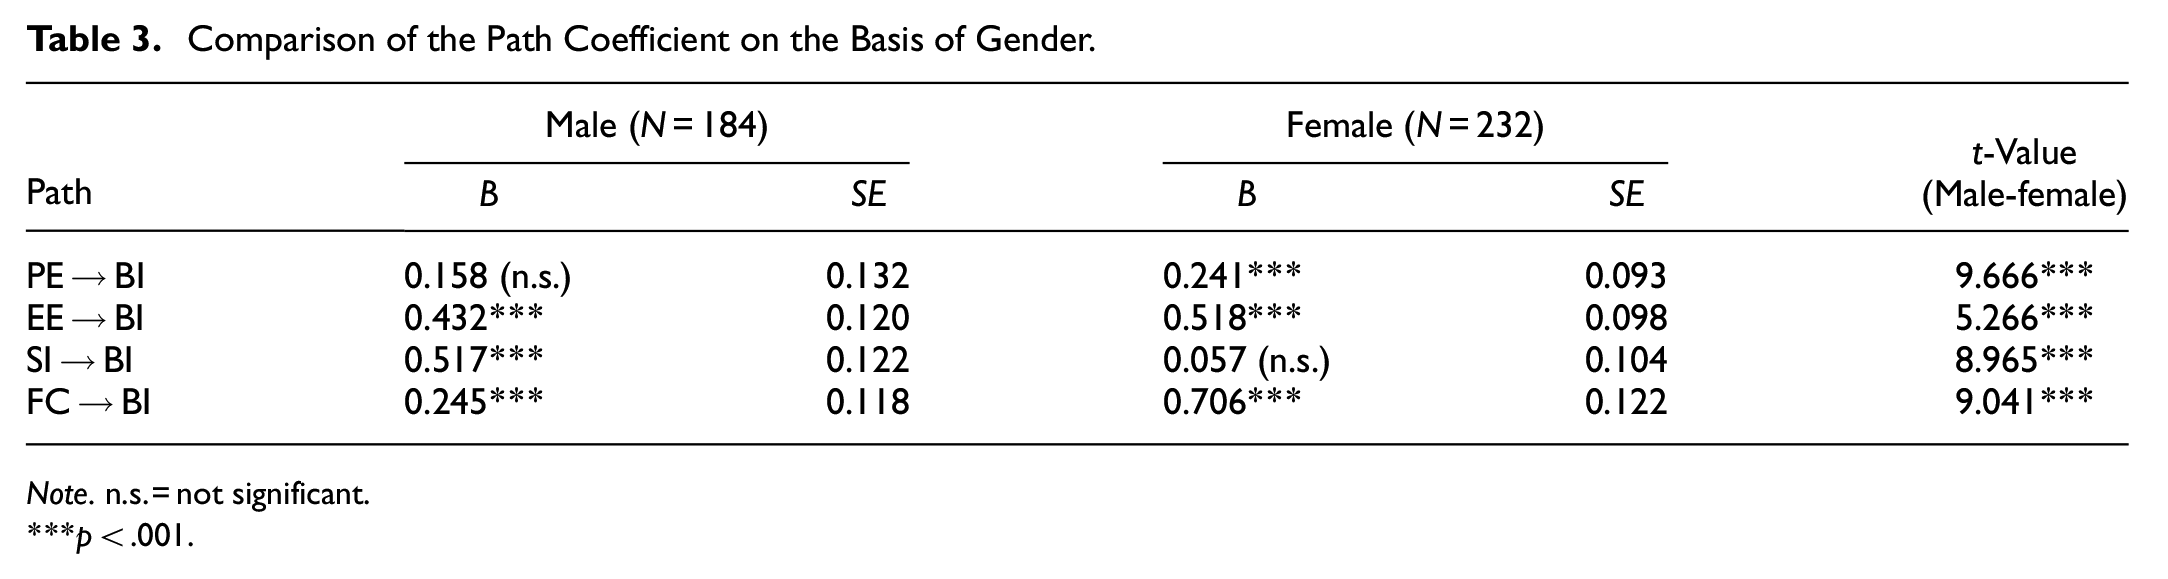
Note. n.s. = not significant.
p < .001.
Path Analysis
The concluding phases consisted of Table 4 and Figure 2. The estimated route for the construction is indicated by the numeral 2. The results demonstrate that effort expectations, social influence, and facilitating conditions support the relevance of hypotheses 2, 3, and 4. H1 was rejected because only the performance expectation was determined to be insignificant (a = 0.137, p = .052).
Summary of the Effects and Research Hypothesis Testing.


Results of analysis of structural model.
Results indicate that facilitating conditions (=0.450, p = .000), effort expectations (=0.435, p = .019), and social influence (=0.291, p = .050) had the largest impact on cashless payment systems.
The findings indicate that bank customers were concerned about the challenges and difficulties associated with implementing cashless payment methods. Even though using the service can be challenging, consumers can still get assistance from others. Additionally, they could access the necessary technological tools to use the Cashless Payment System’s services on the internet platform, which promotes the use of the system and can convert that use into behavioral intentions.
Neural Network Analysis
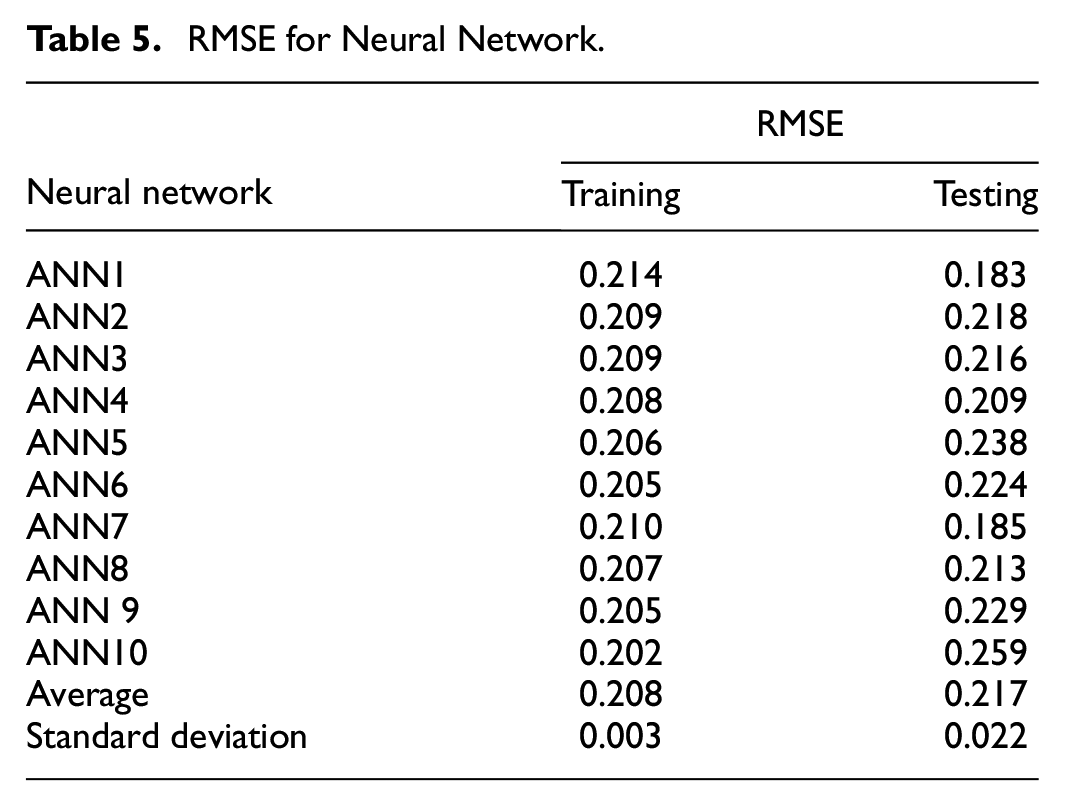
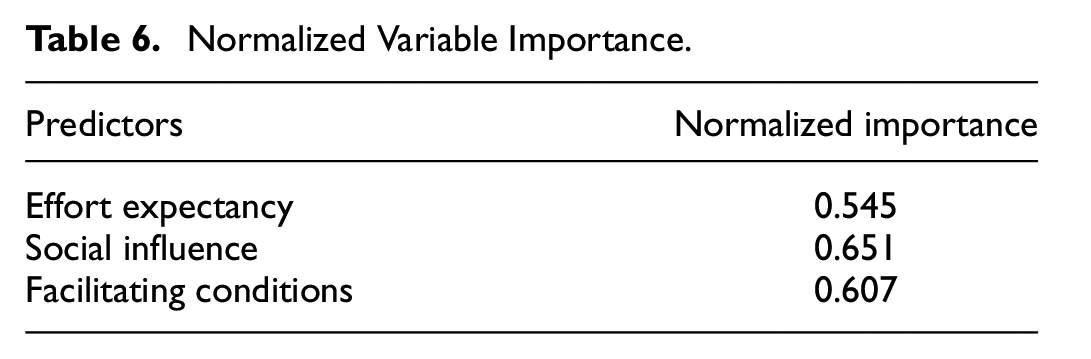
The study’s encouraging findings stem from the fact that they were arrived at using a multi-explanatory approach that included structural equation modeling (SEM) and neural network analysis. To discover non-linear correlations, neural networks are one of the most prominent AI methodologies (Almeida, 2002), as opposed to SEM and Multiple Regression Analysis (MRA), which tend to oversimplify complicated decision-making processes. There are many other types of neural network topologies, but we found that the feed-forward back-propagation multilayer perceptron (MLP) worked well for us (Popescu, 2009). There will be two parts to the study. SEM was used to evaluate the whole model and then to rank the significance of the individual predictor variables. Using the results of the second round of analysis, the relative importance of each predictor variable was determined (Deng et al., 2018). The neural network analysis was performed in Python. We compared the effects of two levels of input to those of the output. The input layer’s three main SEM components were the individuals’ anticipation of future results, their level of effort, the impact of their social environment, and the resources available to them. Only cashless payment system usage had a bounded [0, 1] value in the output layer. A 10-fold cross-validation was also carried out, whereby 90% of the data was utilized for training the network and 10% was used for testing (Gorshkov, 2022). To measure the precision of our model, we computed the root-mean-squared error (RMSE) for both the training and testing data for each of the 10 neural networks and compared the results to their means and standard deviations. According to Table 5 of the validation findings, the average cross validated RMSE value of the training model was 0.208, whereas the RMSE value of the testing model was 0.217. The importance of the normalized variables is shown in Table 6 for the 10 neural networks. The findings indicate that social influence (with a value of 0.551), favorable conditions (0.607), and effort expectations (0.545) are all important predictors of behavior change.
RMSE for Neural Network.
Normalized Variable Importance.
Discussion
This study’s primary objective was to identify the barriers that impede customers from embracing cashless payment methods. Through route estimations, this research revealed that facilitating conditions, effort expectancy, and social influence have a substantial and favorable effect on the adoption of a cashless payment system in Thailand, whereas performance expectancy had no effect. Regarding the values of social influence, facilitating conditions and effort expectancy references reached the same conclusions in 2019 (Baabdullah et al., 2019). Due to the confusing environment of developing countries, the impacts of transactions were not evident Slade et al., (2015). For example, if a client is not assisted, the customer may begin to doubt whether or not the transactions are being handled efficiently. These concerns induce anxiety around identity theft and password theft. Therefore, it is proposed that these obstacles may be reduced by assigning them the greatest possible value.
This might be accomplished by providing each customer with a personalized explanation of how to utilize cashless payment systems and by providing them with easy and inexpensive online transaction options. Customer service representatives must provide walk-in customers with information on cashless payment options. Customers must have confidence in cashless payment systems in order to embrace them. Past research has shown that cashless payment systems may actually increase efficiency and save time (Wulandari, 2017).
With a 0.450 factor loading, the FC dimension is the most useful attribute for cashless payment systems in Thailand. These may be ranked by “FC,”“EE,” and “Social Influence” (as is shown in Figure 3).

Final analysis of structural model.
According to Bailey et al. (2017), Effort Expectancy is the second most crucial dimension with a significant .435-factor loading value. As a result, Cashless Payment Systems as a mobile application can improve ubiquity by increasing the number of cooperating stores and partners, while influencing users to easily comfortable with using online banking systems. However, customers must still put forth significant effort to learn how to use cashless payment systems. In particular, the utilization technique and procedure still require time and effort to run. Therefore, users’ efforts to adopt Cashless Payment Systems cannot be reduced by ubiquity. By offering a dependable, approachable, and user-friendly structure, this favorable impression can be produced. The ability to cross-check and balance services can help people feel more comfortable with cashless payment systems. Alaeddin et al. (2018) claimed that offering a simple and user-friendly structure can reduce the image barrier and create a feeling of convenience. However, Cashless Payment Systems can share greater freedom and can be used anywhere online when compared to traditional payment methods. Because there are more options available, customers can streamline their search processes to increase the effectiveness of their use of money. To meet customer expectations, Cashless Payment Systems must not only increase the number of partners, but must also ensure that the partners’ identities, dependability, and best-in-class quality are consistent with those promises.
In addition, as was also seen in the study conducted by Slade et al. (2015) social impact is the third most crucial dimension with a significant .291-factor loading value. As with their friends and family, people will be more inclined to embrace cashless payment systems. It follows that consumers are aware of and recognize information presented in commercials. Numerous studies in the field of mobile payments have shown a substantial correlation between a system’s usability and the likelihood of adoption (Koening-Lewis et al., 2010; Riquelme & Rios, 2010). The findings of this study, however, differ from those of Tarhini et al. (2016), who contended that customers in Lebanon were not burdened by difficulties using technology. Underbanked and unbanked travelers visiting India did not find the technology’s use for financial and banking services satisfactory.
Cashless Payment Systems should be made easier to use for customers to improve comprehension and adoption. A SUPPORT system has been made available with sufficient technological tools to execute the online platform’s services conveniently at anytime and anywhere. Additionally, using internet platforms is fairly simple. Users of the service must be properly persuaded to use it by the information included in the advertising media.
According to the results of gender moderation, male users of cashless payment systems encounter greater obstacles than female users. Similar findings from an earlier Malaysian study showed that women adopt online payment methods more quickly than men (Baabdullah et al., 2019). The fact that females in the target group in the current study adopted cashless payment systems at a higher rate than males may be the cause of this difference in adoption rates.
Conclusion and Implications
This study incorporated the UTAUT model into an analysis of varied adoption patterns for electronic payment systems. According to the results, UTAUT has an influence on both fear and confidence. Perceived risk and trust are intermediaries between UTAUT and the tendency to embrace cashless payment solutions. Furthermore, at the .001 significant level, perceived risk and trust have a direct influence on the behavioral desire to use a cashless payment system. In sum, the findings support the notion that the UTAUT model, risk aversion, and trust all play a significant role in influencing individuals’ intentions to use cashless payment methods.
Implications for Academia
An understanding of the cashless payment system environment in Thailand and how it affects customer behavior has been advanced by this study. The UTAUT framework was used as the basis for this research model. This study also emphasized how gender can affect usage barriers. The results, which provided a substantial relation to UTAUT, added to the findings of published literature on the resistant hurdles of Cashless payment systems in underdeveloped economies. According to the findings of this study, the factors of facilitating conditions, effort expectancy, and social influence play a significant role in influencing individuals’ reluctance to adopt cashless payment systems. However, performance expectations were found to have minimal impact on these systems. The structural equation modeling (SEM) analysis revealed that our model is parsimonious in nature, as the independent variables explain 73% of the total variance in assessing the intention to use cashless payment systems. It is important to note that our proposed model exhibits a relatively lower predictive power compared to other models such as the original Technology Acceptance Model (TAM) with 52%, TAM2 with 37%, and TAM3 with 53%. In light of these findings, neural network models appear to offer more accurate predictions for the acceptance of cashless payment systems, as evidenced by the low average RMSEs observed in both the training and testing data sets (Sharma, 2017). The advantages of cashless payment systems, including their ease of use and distinction from traditional payment systems, are widely acknowledged. However, the insignificant relationship between performance expectancy and the intention to use the system requires further investigation and clarification. It is essential to determine whether, in the early stages of cashless payment systems’ development, certain factors may diminish in influence. Moreover, the identified between-group differences in this study warrant further exploration to gain deeper insights into the underlying causes of diverse behavioral patterns. Nonetheless, functional barriers such as facilitating conditions, effort expectancy, and social influence hinder the adoption of cashless payment systems, providing a promising foundation for future research in this area.
Implications for Practice
The findings of this study have significant ramifications for the governing authorities of Thai banks. It is advisable that bank management officials create and put into effect any plans that can encourage clients to use cashless payment systems. When marketing efforts are launched, they can highlight the efficiency, comfort, and security of cashless payment systems in Thailand. For business corporations, improvement in maintaining a good reputation by protecting consumers’ privacy and more input in stabilizing the online payment environment will be the best approach to attracting potential consumers and satisfying any existing customers. Additionally guides for Cashless Payment Systems can be developed to give clients comprehensive information. To have a beneficial impact on consumer behavior when using online banking, rules and regulations must be developed to offer customers secure, safe, and dependable systems. This can be helped by banks posting simple-to-understand Cashless Payment System instructions on their websites. One of the biggest obstacles to the acceptance of Cashless Payment Systems is risk, which can be lessened but cannot be eliminated. For practitioners, such as public policy makers and online payment servers, understanding this trend and developing a more suitable environment for online payments would be critical. Building clients’ trust requires banks to implement a stringent check-and-balance mechanism for each Cashless Payment System transaction. Additionally, banks will need to develop a system that enables clients to double-check their online purchases.
Implications for Policy
To promote the adoption and usage of cashless payment systems, it is crucial for promotional campaigns to highlight the system’s practicality and key benefits, such as faster shopping, enhanced transaction security, and improved performance. These features are likely to capture consumers’ attention and increase the likelihood of them embracing this innovative service. Additionally, providing online brochures and guides that offer a comprehensive overview of the benefits of cashless payment systems and step-by-step instructions for conducting various transactions can be highly beneficial. Management and marketing efforts should also emphasize the importance of mobility, considering that modern consumers have limited free time due to their fast-paced lifestyles. Therefore, emphasizing mobility as a significant advantage of cashless payment systems becomes essential. Mobile operators and payment service providers need to ensure that the technological infrastructure is capable of offering universally accessible (both geographically and temporally), instant, and reliable connections and services. This would enable customers to experience seamless connectivity anytime and anywhere, aligning with their dynamic lifestyles.
Research Limitations and Future Research
This study has a few notable limitations that present opportunities for further investigation. Firstly, the sample size used in this study was relatively small, and the data was collected only from experts and moderate users of cashless payment systems. This restricts the generalizability of the findings. To obtain more comprehensive and robust results, future research should consider increasing the sample size and collecting data from a broader population across different cities in Thailand. It would be beneficial for future researchers to compare the behaviors and perceptions of moderate and expert users of cashless payment systems to expand the scope of their research. It is always advisable to strive for a more representative sample as convenience samples can limit the generalizability of the findings.
Additionally, to gain a deeper understanding of the adoption and usage of cashless payment systems, it is important to investigate perceived risks and trust issues associated with these systems. Exploring the impact of control factors such as customer age and educational level on consumption behavior could provide further insights. Conducting a cross-country analysis focusing on the banks operating in the target countries could also shed light on the service standards offered in different contexts.
Furthermore, it is essential to address the significant gender bias in the data used in this study. Future research should aim to collect an equal amount of data from both genders before testing the model. Additionally, testing the study model on the challenges faced in using mobile banking could provide valuable insights.
Lastly, future studies could consider applying the research approach to investigate the adoption and usage of cashless payment systems in other innovative services or industries where there may be specific challenges related to mobile applications or online shopping.
Footnotes
Declaration of Conflicting Interests
The author(s) declared no potential conflicts of interest with respect to the research, authorship, and/or publication of this article.
Funding
The author(s) disclosed receipt of the following financial support for the research, authorship, and/or publication of this article: This research is supported by Chiang Mai University. This work was also supported by Fundamental Fund 2024, Chiang Mai university.