
Abstract
This study investigated the effect of perceived usefulness, perceived ease of use, social influence, facilitating conditions, compatibility, and perceived trust on the intention and adoption of electronic wallet (eWallet) among working adults in Malaysia. The cross-sectional research design was adopted to gather quantitative data from 1,156 working adults via Google form link shared across the social media platform. The collected data were analyzed with partial least square structural equation modeling (PLS-SEM) tool using SmartPLS 3.1. The study outcomes revealed that perceived usefulness, perceived ease of use, facilitating conditions, compatibility, and perceived trust displayed significantly positive effect on both the intention to use and the adoption of eWallet. Additionally, the intention to use eWallet mediated the relationships of perceived usefulness, perceived ease of use, social influence, facilitating conditions, compatibility, and perceived trust with adoption to use eWallet. Household income significantly moderated the relationship between compatibility and intention to use eWallet. eWallet service providers and financial development policy making in Malaysia should focus on promoting the application of eWallet to uplift its social influence, besides enhancing consumer security to harness the adoption of eWallet amidst the public. Essentially, the intention-behavior gap needs to be bridged by exploring new factors that can affect the behavior.
Keywords
Introduction
The 21st century marks the widespread diffusion of mobile services stemming from the latest mobile technologies that offer consistent connectivity to smart mobile phone users (Karim et al., 2020). The rapid advancement in smartphones, smart payment systems, and wireless telecommunications has significantly enhanced the means of purchase transactions in the real-world, apart from the use of cards and cash (Seetharaman et al., 2017). Personal mobile has turned into a norm, while mobile payment facilitates its users to execute personal monetary transactions.
Mobile-driven payment systems empower users to perform payment with ease, rapidly, and in a secure manner to execute bulk payment without the use of cash (Singh & Srivastava, 2018). Electronic wallet (e-wallet) has become the next wave of transaction, as payments are made using mobile devices. The e-wallet refers to the digital version of a physical wallet that one commonly carries (Singh et al., 2020). The e-wallet is a financial application on a smartphone, where one can preload some amount of money to perform online and offline payments (Chawla & Joshi, 2019). By deploying the e-wallet, users can complete purchases efficiently and quickly (Karim et al., 2020). Using the e-wallet not only offers a level of ease and speed, but also gives consumers a sense of comfort and security in their purchase transaction (Seetharaman et al., 2017).
Mobile-driven payment offers unique opportunities to financial institutions to include non-banking clients as well. Statistics depicts that there are over 1 billion users worldwide performing daily transactions up to US$1.9 billion (Global System for Mobile Communication [GSMA], 2019). In total, 290 mobile payment service providers offer services across 95 countries, while the total daily transactions may reach US$5 billion by the end of 2025 (GSMA, 2019). Reliable and favorable mobile phone connectivity enables e-payment system, whereas a viable regulatory framework enables the penetration of mobile payment and the development of global digital economies (Gupta & Arora, 2019).
In Malaysia, Bank Negara Malaysia (BNM), which regulates the national financial industry, has issued 45 non-bank and six bank e-money licenses to date (Bank Negara Malaysia [BNM], 2020). Among the familiar platforms are Touch ‘n Go, Boost, GrabPay, Vcash, Razer Pay, Fave, KipplePay, and Air Asia’s Big Pay. The Malaysian government has encouraged the public to adopt e-wallet through the RM30 eTunai Rakyat scheme, which enables eligible Malaysians to receive RM30 in their e-wallet account (Tariq, 2020). Simultaneously, the e-wallet service providers are encouraging the adoption of e-wallet with attractive promotions, such as cashback, coupons, and rebates (Chawla & Joshi, 2019). While the Malaysian government offers such incentives to encourage the public to embrace the use of e-wallet, the Nielsen Payment Landscape report claimed that a mere 8% of the population in Malaysia had adopted eWallets as their payment method (Nielsen Malaysia, 2019).
PricewaterhouseCoopers (PwC, 2018) Malaysia had pointed out that the e-wallet industry is still in its infancy stage. In support of this view, Arumugam (2020) depicted that the e-wallet uptake is still low in Malaysia. To support the Malaysian government’s aspiration of transforming the country into a cashless society, this present study focused on adopting the e-wallet process in Malaysia from the lens of Technology Adoption Model (TAM) and Unified Theory of Acceptance and Use of Technology (UTAUT) extended with two factors; compatibility and trust.
In the remaining sections, this paper briefly offers the relevant literature to formulate the study model and hypotheses. Next, the method adopted for data analysis is discussed. Following that, the study outcomes are presented, along with discussion of results. Lastly, this paper ends with study contribution and limitations.
Literature Review
Theoretical Foundation
Technology adoption studies have utilized several prominent theoretical models, each with different contextual and technological factors that impact the adoption of technologies. Some of these noteworthy theories are Theory of Reasoned Action (TRA) (Fishbein & Ajzen, 1975), Technology Acceptance Model (TAM) (Davis, 1989), Theory of Planned Behavior (TPB) (Ajzen, 1991), Innovation Diffusion Theory (IDT) (Rogers, 1995), and Social Cognitive Theory (SCT) (Compeau & Higgins, 1995).
In 2003, the UTAUT was postulated by Venkatesh et al. (2003) to synthesize the eight theories. Venkatesh et al. (2003) found that the eight models could only explain 17% to 53% of the variance regarding the intent to use information technology (IT). On the contrary, the UTAUT outperformed all the eight models using the same data by explaining 70% of the variance in users’ intention to use IT (Dwivedi et al., 2019).
The UTAUT model allows researchers to obtain a more exhaustive prediction of users’ behavioral intentions than the other previous models. The UTAUT has been used to assess smartphones (Baishya & Samalia, 2020), online learning (Chen & Hwang, 2019), social learning system (Khechine et al., 2020), mobile payment systems (Gupta & Arora, 2019), mobile-commerce (Pandey & Chawla, 2019), and mobile wallet (Chawla & Joshi, 2019). Dwivedi et al. (2019) claimed that some relationships in UTAUT that may not be pertinent for all contexts, thus excluding some correlations that may be possibly significant while omitting some constructs that may be vital to explain technology use. In paving future directions within the context of e-wallet, this study critically reviews and refines the original UTAUT model within the e-wallet setting.
Fraudulent activities have remained as significant barriers for e-wallet adoption in Malaysia (Nielsen Malaysia, 2019). Hanafizadeh et al. (2014) asserted that over two-thirds of financial transactions made using mobile payment channel were deemed as unsatisfactory by the users. Accordingly, high compatibility leads to higher chances of technology adoption (Humbani & Wiese, 2019). Nevertheless, it raises a question as to whether this extends to e-wallet adoption in Malaysia. To date, the adoption of e-wallets in Malaysia extensively relies on the promotions, such as coupons and rebates, hence prodding Malaysians to download the mobile wallet application (app) without necessarily using them (Nielsen Malaysia, 2019). Hence, it is questionable on how to encourage Malaysian users for continuous and sustainable usage of eWallet. Preceding researchers prescribed that both perceived usefulness and ease of use are not only considered as important factors for technology adoption, but they also affect long-term use of technology (Hanafizadeh et al., 2014).
Perceived usefulness (PU)
PU refers to the subjective probability that using technology increases one’s performance or benefiting the user (Davis, 1989). In the online technology system, usefulness has been postulated as the use of a technology that is useful to the user to perform certain tasks (Natarajan et al., 2017). When users perceive new technology as useful, they are more likely to adopt it. Past studies revealed that PU has a significantly positive correlation with INE to use technology. For instance, PU was reported to significantly affect e-learning use INE (Al-Gahtani, 2016; Chang et al., 2017; Nikou & Economides, 2017; Revythi & Tselios, 2019). Besides, PU is an essential factor in determining the INE to use mobile banking (Gumussoy et al., 2018) and mobile commerce (Chi, 2018; Natarajan et al., 2017). Verma and Sinha (2018) discovered that PU influenced behavioral INE to use mobile-based agricultural extension services in rural India. In addition to the wide range of application areas, PU is critical for the INE to use big data tools (Okcu et al., 2019) and the INE to engage in crowdfunding-waqf model (CWM) amidst crowdfunders in Malaysia (Thaker et al., 2018). Notably, Aji et al. (2020) found that PU had positively influenced people’s willingness to use e-money as a new mode of payment in Indonesia. The significance of PU implies that a higher level of usefulness of technology can lead to greater INE to use eWallet (INE). As such, the following hypothesis is proposed:
Hypothesis 1 (H1): PU has a positive effect on the INE among working adults in Malaysia.
Perceived ease of use (PE)
Although consumers may believe technology is useful, concurrently they may assume that technology is challenging to use. Apart from PU, PE is integral as a determinant in adopting IT. PE refers to “the degree to which a person believes that using a particular technology would be free of effort” (Davis, 1989). The rationale is that as the technology becomes more comfortable to use, the intent to use the technology becomes intensified. Stumbling upon some level of difficulty in using the technology would discourage people from adopting the technology. PE has consistently predicted the intention to use mobile banking (Gumussoy et al., 2018; Singh & Srivastava, 2018), e-learning (Chang et al., 2017; Joo et al., 2018; Nikou & Economides, 2017), e-payment (Lai, 2017; Nguyen & Huynh, 2018), e-government service (Mensah, 2018), mobile shopping apps (Natarajan et al., 2017), autonomous driving (Panagiotopoulos & Dimitrakopoulos, 2018), mobile wallet (Singh et al., 2020), e-portfolio (Abdullah et al., 2016), and machine translation (Yang & Wang, 2019). Nonetheless, studies have reported the insignificant relationship of PE with flight ticket booking app (Suki & Suki, 2017), e-learning (Revythi & Tselios, 2019), autonomous vehicles (Lee et al., 2019), and care robot (Turja et al., 2020). According to Yuan et al. (2014), the statistical significance of the relationship between PE and intention to use technology varied across different cultures and respondents. Most studies pertaining to technology acceptance adhered to the fundamental assumption that PE can positively affect intention to use (Davis, 1989). Hence, the following is hypothesized:
Hypothesis 2 (H2): PE has a positive effect on the INE among working adults in Malaysia.
Social influence (SI)
Venkatesh et al. (2003 denote subjective norm as SI in UTAUT, which derived from several theories, including TRA, TAM) TPB and IDT. They added that SI refers to the degree to which one perceives that others who are important to him/her believe he/she should use the particular technology (Venkatesh et al., 2003). The important persons may include family members, friends, co-workers, media, and social media, who can significantly influence a user’s perceptions and behavior. However, these reports have been inconsistent. For example, some studies revealed a significant relationship between SI and intention to use e-banking (Singh & Srivastava, 2018; Yaseen & El Qirem, 2018), m-commerce (Pandey & Chawla, 2019), mobile-based IT solution for tuberculosis treatment monitoring (Seethamraju et al., 2018) and care robots (Turja et al., 2020). On the contrary, other studies reported that SI did not affect the intention to use e-participation (Naranjo-Zolotov et al., 2019), IT (Kabra et al., 2017), and mobile-based agricultural extension services (Verma & Sinha, 2018). Based on these conflicting outcomes, the following hypothesis is proposed:
Hypothesis 3 (H3): SI has a positive effect on the INE among working adults in Malaysia.
Facilitating conditions (FC)
FC have been initiated through the UTAUT, which reflect the degree to which users perceive the existence of resources and support to use a certain technology whenever necessary (Venkatesh et al., 2003). FC embody access to technology resources, as well as the availability of technical and administrative support, which assists in accepting new technologies. Prior studies reported that FC displayed a significant impact on behavioral intention to use e-participation (Naranjo-Zolotov et al., 2019), mobile shopping app (Chopdar et al., 2018), IT (Kabra et al., 2017), mobile-based IT solution for tuberculosis treatment monitoring (Seethamraju et al., 2018), and smartphones apps for flight ticket booking (Jeon et al., 2019). Notably, most of the studies revealed a significant relationship between FC and intention to use. Additionally, they discovered significant relationships of effort expectancy and performance expectancy with behavioral intention, thus contradicting Venkatesh et al. (2003)’s UTAUT that upholds when both effort expectancy and performance expectancy constructs are present, FC become insignificant in predicting intention. These findings, combined with the conflicting results found in mobile banking adoption (Farah et al., 2018), support the need to re-examine the relationship between FC and behavioral intention. Understandably, using e-wallet demands some support resources, enhanced skills to operate the e-wallet app (e.g., Internet connection), and knowledge of mobile security. Accordingly, the following hypothesis is posited:
Hypothesis 4 (H4): FC have a positive effect on the INE among working adults in Malaysia.
Compatibility (CM)
CM is related to the uniformity of new technology with the consumer’s existing values, needs, and experiences related to the use of technology (Chawla & Joshi, 2019). CM denotes the perception of consumers toward technology degree of consistency with consumers’ existing experiences and values. The perception of CM was reported to exhibit positive influence on the intention to use technology (Lwoga & Lwoga, 2017). CM builds consumers’ receptivity toward the intention to use the technology, such as eWallet (Rogers, 2003). As such, the following is hypothesized:
Hypothesis 5 (H5): CM has a positive effect on the INE among working adults in Malaysia.
Perceived trust (TR)
TR significantly influences consumers to adopt a positive attitude toward technologies (Chawla & Joshi, 2019). TR is related to one’s belief that the eWallet service providers offer security and nil privacy issue (Chong et al., 2010). Security and privacy are significant issues reported as barriers for the adoption of eWallet (AEW) among Malaysian consumers (Nielsen Malaysia, 2019). The reliability of eWallet services enhances consumers’ confidence, apart from improving the consumers’ TR level toward the eWallet service providers. Consumers’ TR significantly intensifies the intention to use online banking services among Malaysian consumers (Chong et al., 2010). Consumers’ TR depletes risk and enhances consumer confidence toward the AEW. Therefore, the following hypothesis is proposed:
Hypothesis 6 (H6): TR has a positive effect on the INE among working adults in Malaysia.
Intention to Use eWallet (INE)
User behavioral intention denotes the likelihood of a user to execute certain behavior (Venkatesh et al., 2003). Individual intention toward behavior harnesses the performance of the specific behavior (Revythi & Tselios, 2019). Empirical evidence signifies that intention is significantly linked with the performance of the behavior (Verma & Sinha, 2018). Numerous empirical studies pertaining to mobile money reported intention as the final outcome. Since intention to use and actual use differ significantly (Senyo & Osabutey, 2020), this intention-behavior gap needs to be bridged. Based on the scope of the study and existing empirical evidence, the following is proposed:
Hypothesis 7 (H7): INE has a significantly positive effect on the AEW among working adults in Malaysia.
Mediating Effect of INE
The factors of technology-related attributes of PU, PE, SI, FC, CM, and TR have been reported to influence the intention to use technology, such as eWallet. Intention had been found to mediate the relationship between mobile money attributes and the use behavior toward mobile money (Senyo & Osabutey, 2020). Taking the lead from the above-cited evidence, the following hypothesis is proposed:
Hypothesis 8 (H8): PU, PE, SI, FC, CM, and TR influence the AEW among working adults in Malaysia mediated by the INE.
Moderating Effect of Education, Living Area, and Household Income
The use of technologies is naturally risky, while user intention and use behavior are significantly affected by the user characteristics of education, income, and lifestyle (Karjaluoto et al., 2019). User education level significantly predicts the user’s understanding of technology, which can likely form positive intention to use and use behavior for the technology (Venkatesh et al., 2003). User lifestyle varies based on their respective dwelling area (Lai, 2017). As for the use of mobile money, those residing in urban areas have a different lifestyle than rural dwellers (Senyo & Osabutey, 2020). Thus, both user intention and use behavior toward eWallet may vary based on dwelling area.
Use of technology significantly varies among prospective user household income (Venkatesh et al., 2012). Household income generates a different level of user needs, and technology may facilitate the user through technology usage. User with higher household income has different intention and use behavior toward the AEW (Karjaluoto et al., 2019). Based on the discussion, the following hypotheses are proposed:
Hypothesis 9 (H9): Level of education moderates the relationships of PU, PE, SI, FC, CM, and TR with the INE among working adults in Malaysia.
Hypothesis 10 (H10): Living areas (Urban and Rural) moderate the relationships of PU, PE, SI, FC, CM, and TR with the INE among working adults in Malaysia.
Hypothesis 11 (H11): Household income moderates the relationships of PU, PE, SI, FC, CM, and TR with the INE among working adults in Malaysia.
All associations hypothesized and tested, presented in Figure 1 below:

Research framework.
Research Methodology
Data Collection and Sample Design
This study examined the effect of PU, PE, SI, FC, CM, and TR on the INE and the AEW among working adults in Malaysia. The cross-sectional research design was adopted to gather quantitative data from 1,156 Malaysian working adults through an online survey conducted in April 2020. This study designed a Google form, which highlighted the study purpose, reported the procedure of the study, and collected informed consent from all respondents prior to survey participation. The questionnaire link was shared across the social media to capture responses.
Measurement and Scales
All the scale items for this study were adopted from previously validated instruments. The five items of PU were adopted from Chong et al. (2010) and Lwoga and Lwoga (2017), while the six items of PE for eWallet were retrieved from Karjaluoto et al. (2019) and Chawla and Joshi (2019). Next, the five items of SI were taken from Lwoga and Lwoga (2017) and Pandey and Chawla (2019), whereas the five items of eWallet FC were adapted from Pandey and Chawla (2019). The CM of eWallet was assessed using five items obtained from Lwoga and Lwoga (2017) and Chawla and Joshi (2019). TR was evaluated with six items adapted from Chong et al. (2010) and Chawla and Joshi (2019). INE was gaged with six items adopted from Chong et al. (2010) and Karjaluoto et al. (2019). Lastly, AEW was tested using two items retrieved from Karjaluoto et al. (2019).
Assessment of Common Method Variance (CMV)
Harman’s (1976) one-factor test was performed to estimate the issue of common method variance (CMV) (Podsakoff et al., 2003). The results of Harman’s one-factor test verified the absence of CMV issue in this study as the uppermost factor accounted for 36.71% variance, which is below the suggested limit of 50% (Podsakoff et al., 2003).
Multivariate Normality
The PLS-SEM dismisses multivariate normality in the data as it is a non-parametric analysis tool (Hair et al., 2019). Nevertheless, multivariate data normality was tested based on that prescribed by Peng and Lai (2012) using an online tool of web Power (https://webpower.psychstat.org/wiki/tools/index) to verify data normality. The test results confirmed that the dataset is not normal, as Mardia’s multivariate coefficient p-values were below .05 (Cain et al., 2017).
Data Analysis Method
Partial least squares structural equation modeling (PLS-SEM) was applied using the Smart-PLS software 3.1 for data analysis. The PLS-SEM is a multivariate analysis tool that assesses the study path model with latent constructs (Hair et al., 2019). The PLS-SEM allows scholars to work with non-normal and small datasets. The casual-predictive nature of the PLS-SEM is beneficial when working with complex models having composites and without assuming goodness-of-fit estimation (Chin, 2010). A two-step analysis scheme is suggested for data analysis in PLS-SEM. In the first stage, a measurement was performed on the model to test the reliability and validity of the study constructs (Hair et al., 2019). The second stage looked into the structural model associations and examination of study hypotheses with significance levels (Chin, 2010). Model estimation was implemented with r2,
The importance-performance map analysis (IPMA) defines the study constructs into relatively high to low by importance and performance for endogenous construct (Chin, 2010). The IPMA detects the possible area of enhancements that necessitate contemplation from policy makers and scholars. The IPMA analyses profiles on the total effect of the re-scaled variables scores in the unstandardized procedure (Ringle & Sarstedt, 2016). Re-scaling developed for each latent variable scored between 0 and 100. The mean value of the latent variable score signifies the performance of the latent variable, where 0 denotes the least, while 100 reflect the most significant in the performance of endogenous construct (Hair et al., 2019).
The PLSpredict, as prescribed by Shmueli et al. (2019), is typically used to validate the model’s critical endogenous construct and to examine prediction errors. Predictive performance is evaluated by the mean of Q2predict statistics for verification with naïve yardstick embedded in the PLSpredict method (Shmueli et al., 2019). The PLSpredict estimates the naïve benchmark in the linear regression model (LM). The comparison between RMSE (Root Mean Squared Error) and MAE (Mean Absolute Error) values for LM and PLS model confirms the explanatory power of the two methods. Shmueli et al. (2019) claimed that the PLS-SEM model lacks predictive power if it yields higher prediction errors than the LM benchmark. If the majority of the PLS-SEM analysis produces higher prediction errors than the LM benchmark, it depicts low predictive power of the PLS-SEM model. If only a small portion of the PLS-SEM analysis generates higher prediction errors than the LM benchmark, it indicates medium power of the PLS-SEM model. If there is no indicator in the PLS-SEM model on more errors than the LM benchmark, the PLS-SEM model has high predictive power (Shmueli et al., 2019).
Data Analysis
Demographic Characteristics
The study data were collected from young and educated Malaysian respondents, in which most of them were males (55.5%). Most of the respondents were 21 to 25 years of age (56.7%), while 14.0% were 26 to 30 years old, 12.7% were below 21 years, 6.0% of the respondents fell in each age range of 21 to 30 years and above 50 years, 4.6% were 31 to 35 years old, 2.5% were 36 to 40 years of age, 1.6% were 41 to 45 years, and 1.9% were 46 to 50 years old. A majority of the respondents were single (83.8%), while the rest were either married or divorcees. In total, 16.0% of the respondents had completed their secondary school education, while 54.2% had earned college degree, and 23.2% possessed Diploma or technical school level education. Amongst the respondents, 54.5% earned a monthly income of below RM 2500, while 27.3% had a monthly income that ranged at RM2501-5000, and the remaining respondents earned above RM5000 as their monthly income. In total, 65.1% of the study respondents were Chinese, 14.5% were Indians, 2.0% were Malays, and the remaining derived from other ethnicity. Most of the respondents dwelled in urban area (90.1%). Table 1 represented the demographic characteristics in this study.
Demographic Characteristics.

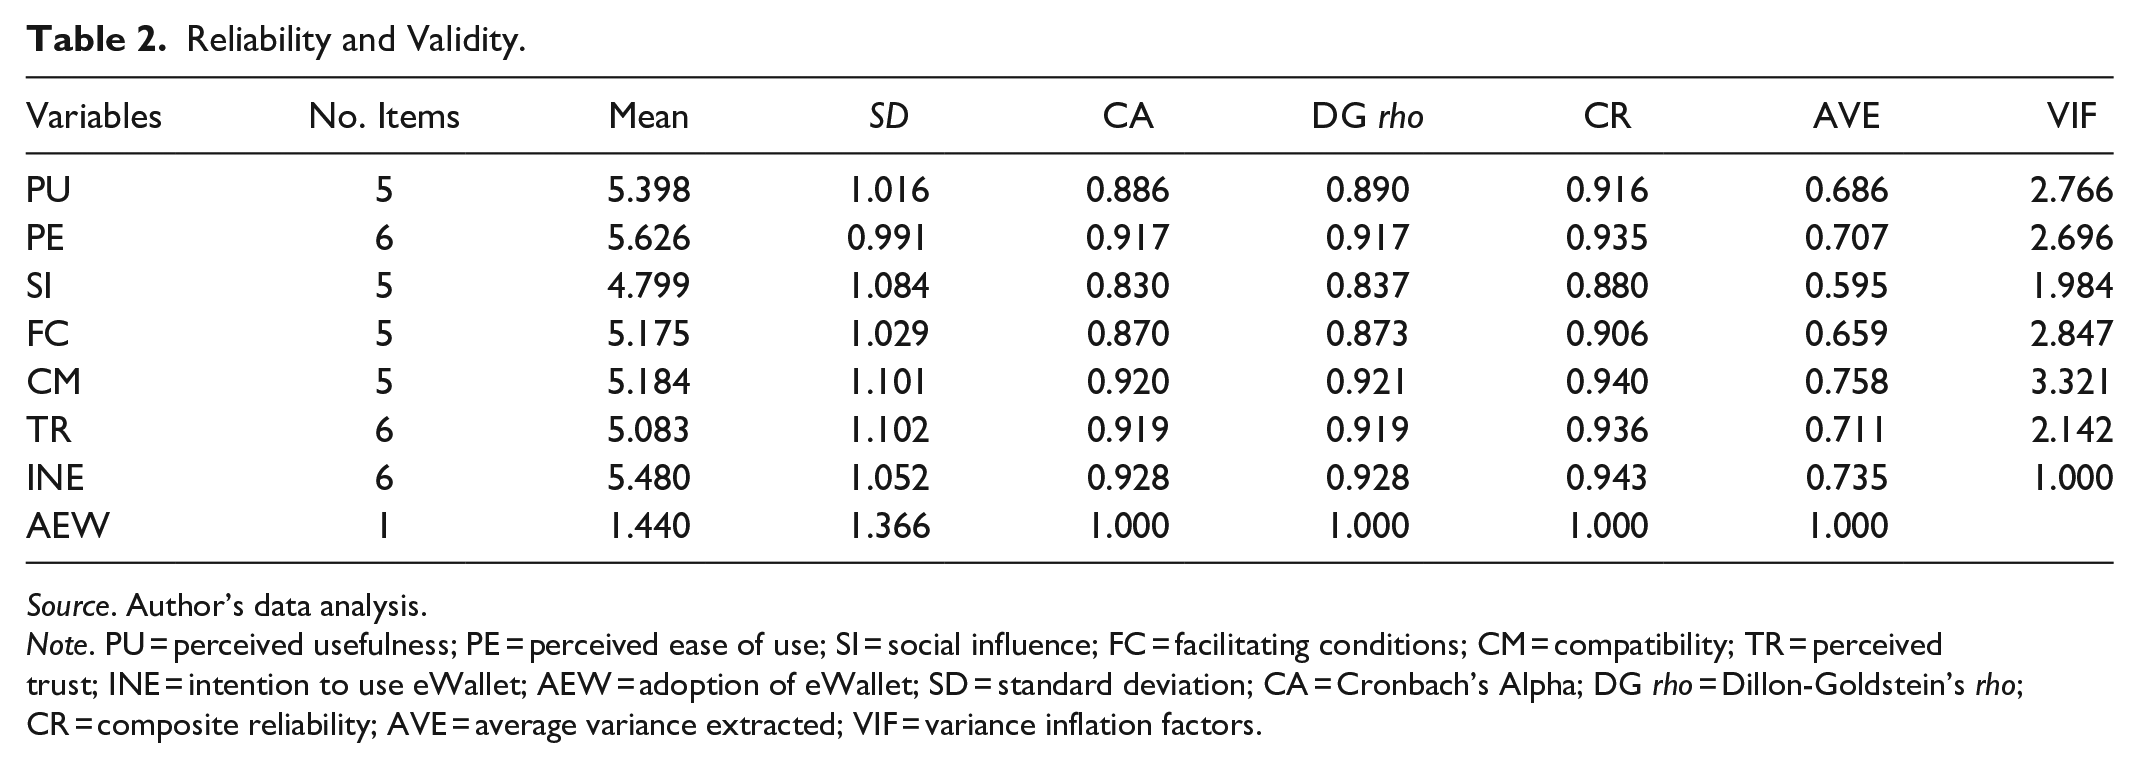
Validity and Reliability
Utilizing the validation procedure prescribed by Hair et al. (2019), the Smart PLS outcomes were retrieved and documented. The reliability of each construct, which was assessed with Alpha (α), Composite reliability (CR), and rho-A, signified acceptable level of reliability with the lowest scores being .830, .837, and .880, respectively (threshold value for α, CR, and rho-A is .70) (Hair et al., 2019). Table 2 tabulates the reliability scores for this study. The average value extracted (AVE) for all items should exceed .50 score to institute convergent validity as an indication of uni-dimensionality for each construct (Hair et al., 2019). The variance inflation factor (VIF) for each construct presented in Table 2 had been below 5; indicating the absence of multi-collinearity issue among the study constructs. The study items exhibited that the constructs had satisfactory convergent validity (see Table 2). The item loadings and cross-loading were determined to justify construct discriminant validity, which appeared to have satisfactory discriminant validity (see Table 3). Next, Fornell-Larcker (1981) criterion and Heterotrait-Monotrait (HTMT) ratio test were employed to approve the discriminant validity of the constructs. The outcomes of Fornell-Larcker criterion and HTMT ratio should be less than .70 to signify discriminant validity for each construct (Hair et al., 2019; Henseler et al., 2015).
Reliability and Validity.
Source. Author’s data analysis.
Note. PU = perceived usefulness; PE = perceived ease of use; SI = social influence; FC = facilitating conditions; CM = compatibility; TR = perceived trust; INE = intention to use eWallet; AEW = adoption of eWallet; SD = standard deviation; CA = Cronbach’s Alpha; DG rho = Dillon-Goldstein’s rho; CR = composite reliability; AVE = average variance extracted; VIF = variance inflation factors.
Discriminant Validity.

Source.Author’s data analysis.
Note. PU = perceived usefulness; PE = perceived ease of use; SI = social influence; FC = facilitating conditions; CM = compatibility; TR = perceived trust; INE = intention to use eWallet; AEW = adoption of eWallet.
Path Analysis
The study model measurement was examined after achieving validity and reliability. At this phase, the influence of PU, PE, SI, FC, CM, and TR on the INE was evaluated. The adjusted r2 value for the six exogenous constructs (PU, PE, SI, FC, CM, and TR) on the individual attitude toward eWallet demonstrated that 68.6% of change was ascribed to individual INE. The predictive relevance (Q2) value for the part of the model of 0.498 indicated high predictive relevance (Chin, 2010). The adjusted r2 value for the intention to use and adopt eWallet explicated that 38.9% of change was ascribed to individual AEW. The predictive relevance (Q2) value for the part of the model was 0.193, which signified medium predictive relevance (Chin, 2010).
Table 4 tabulates the standardized path values, the t-values, and the significance level for this study. The path coefficient between PU and INE (β = .149, t = 4.717, p = .000) was significantly positive. This result offers statistical provision for the approval of H1. The path value between PE and INE (β = .172, t = 4.802, p = .000) was significantly positive, thus providing statistical support to accept H2. The path value between SI and INE (β = -0.045, t = 1.665, p = .048) appeared insignificant, hence failed to accept H3. The impact of FC on the INE (β = .135, t = 3.739, p = .000) had been significantly positive, thus affording statistical support for H4. The influence of CM of eWallet on the INE (β = .345, t = 8.867, p = .000) was significantly positive, thus offering the statistical evidence to support H5. The next path coefficient for the TR on the INE (β = .195, t = 6.357, p = .000) appeared significantly positive, hence providing the statistical evidence to support H6. The last path coefficient for INE on AEW (β = .443, t = 19.248, p = .000) had been significantly positive, thus offering the statistical evidence to support H7. Table 5 lists the path coefficients of this study.
Loadings and Cross-Loading.

Source. Author’s data analysis.
Note. The Italic values in the matrix above are the item loadings, and others are cross-loadings. PU = perceived usefulness; PE = perceived ease of use; SI = social influence; FC = facilitating conditions; CM = compatibility; TR = perceived trust; INE = intention to use eWallet; AEW = adoption of eWallet.
Path Coefficients.

Source. Author’s data analysis.
Note. PU = perceived usefulness; PE = perceived ease of use; SI = social influence; FC = facilitating conditions; CM = compatibility; TR = perceived trust; INE = intention to use eWallet; AEW = adoption of eWallet.
Mediation
The results revealed that INE mediated the relationship between PU and AEW (β = .066, CI min = 0.039, CI max = 0.087, p = .000), hence the acceptance of hypothesis HM1a. Next, it was found that INE mediated the link between PE for eWallet and adoption to use eWallet (β = .076, CI min = 0.049, CI max = 0.101, p = .000), thus delivering statistical support for hypothesis HM1b. The mediating role of INE on, the relationship between SI and AEW (β = −.020, CI min = −0.040, CI max = 0.000, p = .049) delivered no support to accept hypothesis HM1c. Hypothesis HM1d is accepted as the relationship between FC for eWallet and AEW was mediated by INE (β = .059, CI min = 0.033, CI max = 0.085, p = .000). Similarly, hypothesis HM1e is supported as the relationship between perception of CM for eWallet and AEW was mediated by INE (β = .153, CI min = 0.120, CI max = 0.185, p = .000). Lastly, HM1f is accepted due to the mediating effect of INE on the relationship between TR for eWallet and AEW (β = .086, CI min = 0.063, CI max = 0.112, p = .000). Table 6 lists the mediation results.
Mediating Effect.

Source. Author’s data analysis.
Note. PU = perceived usefulness; PE = perceived ease of use; SI = social influence; FC = facilitating conditions; CM = compatibility; TR = perceived trust; INE = intention to use eWallet; AEW = adoption of eWallet.
Moderation
Table 7 shows the result for moderation effects in this study. Since individual education has been widely reported to influence human behavior, this study had explored the effect of the sample education on the proposed study paths. As a result, the effect of respondents’ education on all the study paths was insignificant. The effect of sample education on all the study paths differed based on sample education.
Moderating Effects.

Source. Author’s data analysis.
Note. PU = perceived usefulness; PE = perceived ease of use; SI = social influence; FC = facilitating conditions; CM = compatibility; TR = perceived trust; INE = intention to use eWallet; AEW = adoption of eWallet.
The respondents behaved differently based on their area of living. Hence, it was critical to explore the effect of sample living area on the model paths. Nonetheless, no significant effect of sample living area was noted on the study model paths. Thus, the samples were indifferent about their dwelling area.
Consumer income affects consumer behavior. Based on this argument, the effect of sample monthly income on the intention to adopt eWallet was assessed. As a result, a significant effect of sample income was displayed on the path between perception of CM for eWallet and INE, while insignificant for the other study paths.
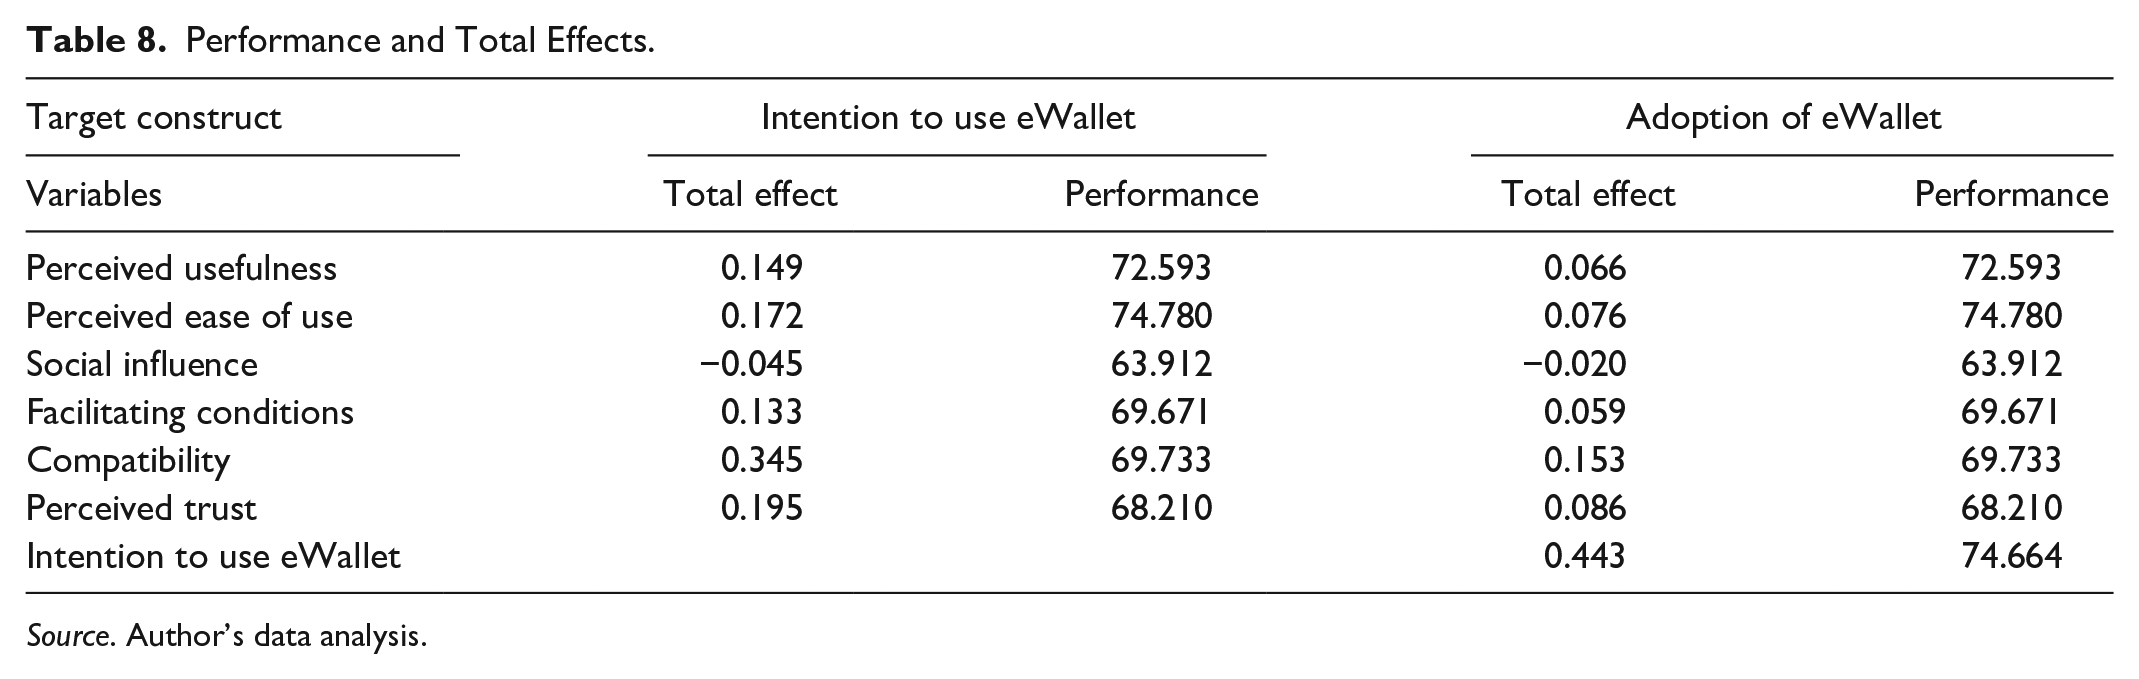
Importance Performance Matrix Analysis (IPMA)
As noted in Table 8, in light of the INE, PE of eWallet emerged as the most important factor for the performance with the score of (0.172; 74.780). The second-most crucial factor for the performance of INE with the score of (0.149; 72.593) was PU of eWallet. The third most important factor in the performance of INE was perception of CM with (0.345, 69.733) score. The fourth most significant factor for the performance of the INE was FC with the score of (0.133; 69.671).
Performance and Total Effects.
Source. Author’s data analysis.
As for the AEW, PE of eWallet appeared to be the most important factor for the performance with (0.076; 74.780) score. The second-most crucial factor for the performance of the AEW with the score of (0.443; 74.664) was INE. The third-most important factor in the performance of the AEW was PU with the score of (0.066, 72.593). The fourth-most significant factor for the performance of the AEW was CM with the score of (0.153; 69.773).
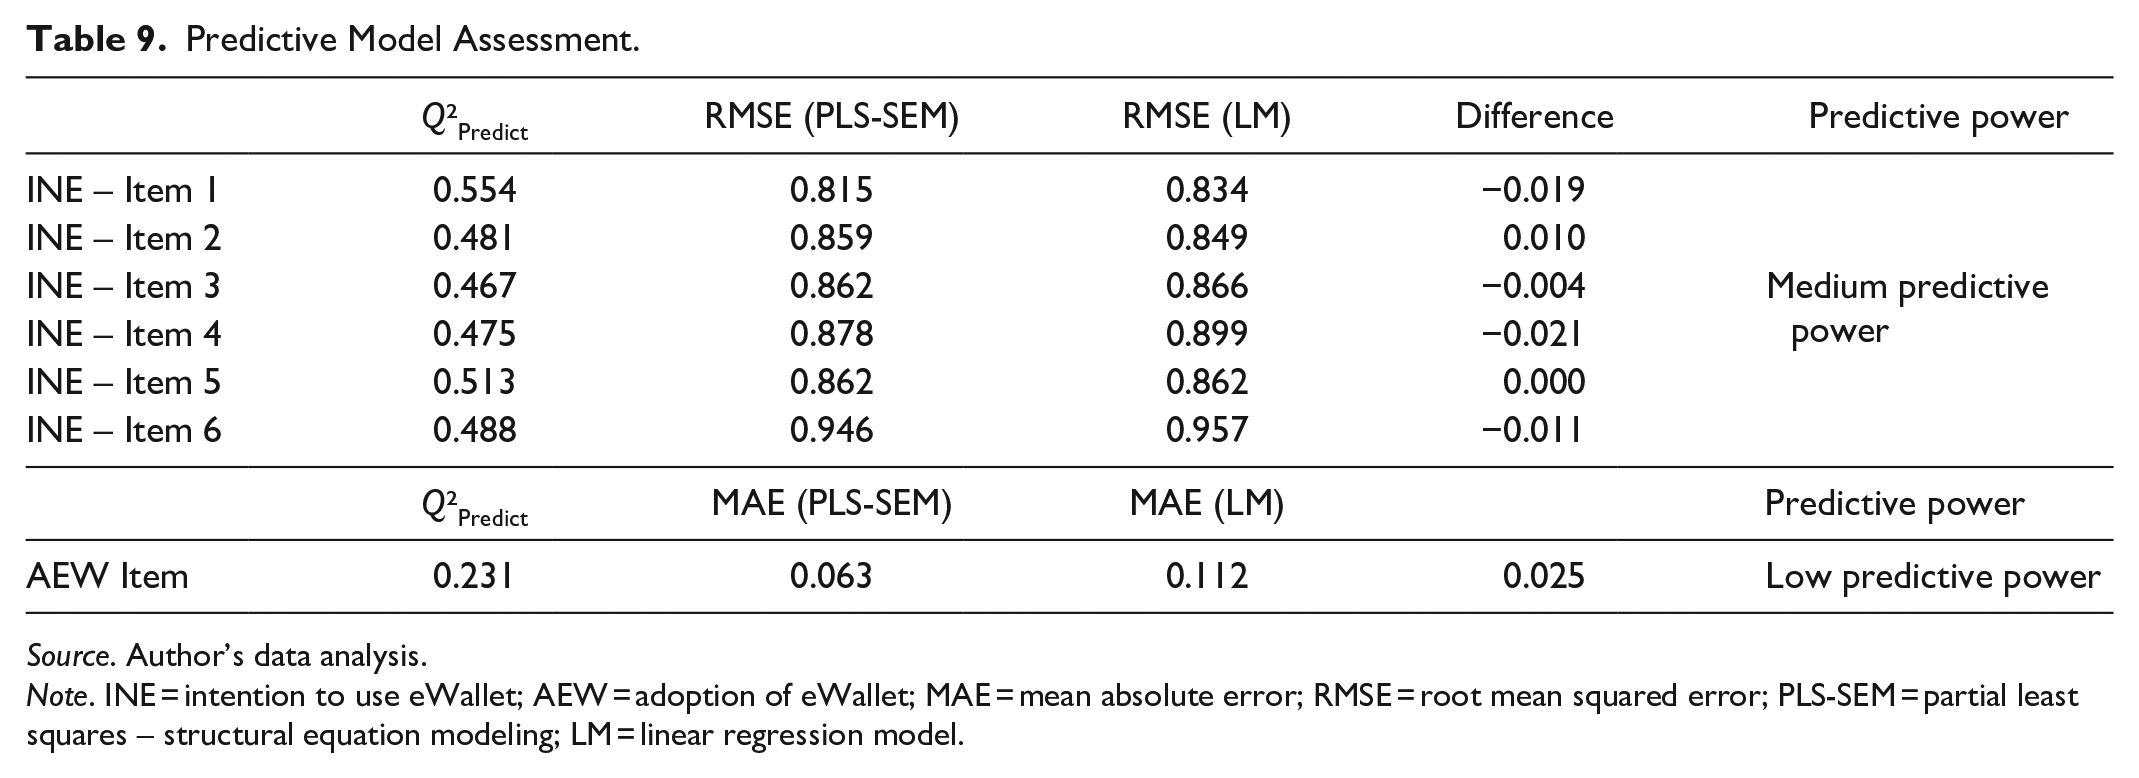
Predictive Assessment
Predictive assessment of the study model disclosed that the model predictive power; INE, displayed high predictive power as most of the Q2 predict values exceeded 0. The Q2 predict values above 0 suggest that the naïve PLS-SEM model executed better than the LM scale. Most of the LM benchmark yielded more errors than the PLS-SEM model. The results offer critical evidence that the PLS-SEM model performed well in predicting the INE. The distribution of errors confirmed that the INE had high predictive power (see Figure 2).

Distributing of prediction error.
The other parts of the study model that predicted the AEW exhibited low predictive power. The Q2 predict values were all above 0, thus confirming the predictive power of the parts of the model. However, most of the LM benchmark yielded fewer errors than the PLS-SEM model. Thus, this PLS-SEM model had low predictive power (see Figure 2) and displayed that the AEW error for PLS-SEM was not distributed evenly. The outcomes are portrayed in Table 9.
Predictive Model Assessment.
Source. Author’s data analysis.
Note. INE = intention to use eWallet; AEW = adoption of eWallet; MAE = mean absolute error; RMSE = root mean squared error; PLS-SEM = partial least squares – structural equation modeling; LM = linear regression model.
Discussion
The rise in mobile use and associated financial abilities has empowered users to execute purchase transaction (Karjaluoto et al., 2019). Consequently, the AEW increased overtime, and the Malaysian government has encouraged the use of digital wallets to achieve Industrial Revolution (IR) 4.0. This study was intended to examine the effect of PU, PE, SI, FC, CM, TR, INE, and AEW among working adults in Malaysia. The results support the robustness of the study model in explaining the INE, and later, AEW among the professional Malaysians. The study model integrates eWallet ease of use, usefulness of eWallet, SI, FC, CM, and TR for the eWallet service providers to influence the INE, and later, AEW.
The eWallet PU and PE significantly intensify the intention of young Malaysian professionals to use eWallet. The outcomes are in agreement with those reported by Aji et al. (2020), whereby usefulness and ease of use promoted the users’ INE. Amidst the Malaysian professionals, the perception of FC for AEW influenced the INEs. The study results coincide with the outcomes postulated by Chawla and Joshi (2019) that the perception of FC led to the intention to adopt mobile wallet among consumers from developing countries. Next, consumer perceived CM associated with the AEW led to the INEs among consumers. Similarly, Lwoga and Lwoga (2017) reported that perceived CM enhanced the consumers’ intention to use technology. In addition, recent study by Yang et al. (2021) revealed that lifestyle CM is one of the factors affecting both intention and adoption to use ewallet among Malaysian professionals. In a similar vein, Chawla and Joshi (2019) asserted that lifestyle CM promoted the INE among consumers. TR also significantly increased the INEs among Malaysian professionals, which is in line with that postulated by Slade et al. (2015).
Moving on, SI for AEWs was significantly and negatively related to INE among professional Malaysians. The young Malaysians observed that fewer people in their surrounding found eWallet as a novel technology, hence the weak SI on eWallet usage. Instead, Malaysian consumers perceived eWallets as insecure and socially unaccepted, thus exemplifying negative recommendation (Nielson Malaysia, 2019). This present study augments the outcomes postulated by people around the consumers, who were still reluctant to accept eWallet as a viable option for payment platform (Gupta & Arora, 2019). Next, consumer perception of risk and trust insignificantly influenced the consumers’ attitude toward Internet of Things. The study results coincide with the findings reported by Slade et al. (2015) and Chong et al. (2010). A similar finding by Kim et al. (2017) concluded that trust toward the business has led intention of the customers to use the transaction system.
Additionally, the INE mediated the effects of eWallet usefulness, ease of use, SI, FC, CM, and TR on AEW among Malaysian sample. The study outcomes verify the notion purported by Karjaluoto et al. (2019) that consumer intention mediated the relationship between e-payment performance and effort expectancy for use of e-payment among Finish consumers. In a similar vein, this present study finding matches the results postulated by Gupta and Arora (2019) that the intention to use mobile payment was mediated by consumers’ perceived SI and FC among Indian consumers. Moreover, Soodan and Rana (2020) in their study found that facilitating condition play a significant role for customer in adopting new technology.
Nonetheless, the moderating effect of consumer education, area of residence, and income were insignificant for all model paths. The moderating effect of consumer income appeared to be varied for the path between CM and INE. The result predicts that the consumers had different understanding regarding eWallet CM based on their monthly household income. This portrays that consumer INE varied in accordance to monthly household income as the consumers sought a more facilitative tool to manage funds disbursement, wherein eWallet serves as a unique digital tool to the high-income group (Lwoga & Lwoga, 2017).
Conclusion
Mobile phones are gaining popularity among professionals, while the use of mobile payment has escalated over time (Karim et al., 2020). Use of mobile payment or eWallet has been explored using diverse theoretical models and in different contexts. Nevertheless, further exploration should look into eWallet adoption among young consumers in emerging economies, such as Malaysia, as the Malaysian government is pursuing to become a cashless economy (Tariq, 2020). Unfortunately, eWallet adoption is scant in Malaysia. As such, this present study investigated eWallet adoption among Malaysian professionals with the attributes of eWallet predicting the intention to use and the AEWs.
This study contributes to the literature pertaining to consumer eWallet adoption in three ways. This work adds to the prevailing literature about eWallet adoption in light of eWallet usefulness, ease of use, FC, CM, and TR, mainly for eWallet services to intensify the intention of consumers to use eWallet. However, the SI for eWallet did not promote the INE. Furthermore, the INE significantly predicted the AEW.
Most studies have reconnoitered the intention to use or AEW in advanced and western nations (Karjaluoto et al., 2019). As such, this present study contributes to the existing efforts by assessing the development of INE and AEW in an emerging economy; Malaysia. According to Ismail (2021), Malaysian government has launched one initiative which called DuitNow QR with the mission to encourage the usage of ewallet with standard QR code. This can be shown that Malaysia, as a developing country is taking a serious step toward develop digitalization community. He further added that Malaysia has led Southeast Asian in ewallet usage based on report by the MastetCard Impact Study 2020. At present, the SI on the INE is unfavorable across developing countries. Users from developing countries tend to seek government incentives or inducements to encourage the adoption of technologies, such as eWallet and e-payments (Karim et al., 2020).
This present study adds to consumers’ perceptions of the AEW in two ways. In light of user perspective, the aspect of SI demands improvements as the present users find no SI for the AEW. The present users find factors of CM and TR to significantly influence their INE. Nonetheless, a significant difference seemed to exist between user intention and actual AEW. Henceforth, government incentives may promote the conversion of user intention toward eWallet into actual AEW. Besides, the eWallet service providers may offer incentive or inducement to enhance the users’ intention toward the AEW.
This present study registers three limitations; study data collected in a cross-sectional manner and having known restricted generalizability. Hence, future studies should explore the INE or the actual AEW using longitudinal data or experimental design. Next, estimating the continuous intention and the consistent AEW among different segments of users based on income, location, and education may shed light on AEW. The user intention developed based on eWallet attributes of ease of use, usefulness, FC, TR, and CM appeared to vary over time, in which eWallet users may be more inclined to use the eWallet. Future research may incorporate more relevant eWallet attributes that could influence the users’ intention toward eWallet. Furthermore, in coping with the intention-behavior gap, UTAUT3 may be employed to assess the SI on user behavior. This present study explored user intention toward AEW and eWallet use behavior. Therefore, it would be interesting to explore the AEW with qualitative study design or quantitative data evaluated with artificial neural network analysis, as both aspects of intention and adoption are not a straightforward matter for many consumers. Future research may probe into the role of government or eWallet service provider campaign in promoting the eWallet use behavior. Besides, it would be stimulating to embrace a more cognitive-social variable that fosters the user inclination to use eWallet in a different geographic context. Additionally, user preceding familiarity with eWallet may eliminate the effect of SI on the user behavior toward eWallet.
Footnotes
Author Note
Abdullah Al Mamun is also affiliated to UKM - Graduate School of Business, Universiti Kebangsaan Malaysia, Bangi, Malaysia.
Declaration of Conflicting Interests
The author(s) declared no potential conflicts of interest with respect to the research, authorship, and/or publication of this article.
Funding
The author(s) disclosed receipt of the following financial support for the research, authorship, and/or publication of this article: This study funded by Ministry of Higher Education, Manaysia (Grant No: R/FRGS/A0100/1258A/004/2019/00711).