
Abstract
Childhood stunting is a global health challenge, affecting 148 million children under 5 in 2022. It is a key indicator of chronic malnutrition, often driven by inadequate nutrition, recurrent infections, and socio-economic disparities. In Egypt, 22% of children under 5 are stunted, leading to cognitive delays, poor educational outcomes, and long-term economic losses. Innovative and interdisciplinary approaches are essential to address this issue. This research aims to enhance the detection of growth abnormalities in children using advanced machine learning models, including Artificial Neural Networks (ANN), Convolutional Neural Networks (CNN), and Autoencoder-based architectures. The study utilized secondary data from Demographic Health Surveys (DHS) conducted in Egypt between 2005 and 2014, comprising 37,051 records. Key maternal and child characteristics were analyzed to calculate Height-for-Age Z-scores (HAZ) and Weight-for-Age Z-scores (WAZ). A 70:30 train-test split was applied, and dropout layers were used to prevent overfitting during model training. The ANN model achieved 99.5% accuracy, with a precision of 97.2% for normal cases and 95.4% for severely stunted cases. The CNN model achieved lower accuracy (68%) but provided valuable insights into spatial growth patterns. Autoencoder-enhanced models (e.g., AE + ANN) demonstrated moderate performance, with AE + ANN achieving 77.2% accuracy. Misclassification rates for stunted versus severely stunted cases reached up to 14%. This study demonstrates the potential of machine learning models in early detection and intervention for childhood stunting. By leveraging automated, data-driven approaches, healthcare providers can make evidence-based decisions, allocate resources effectively, and improve child health outcomes in Egypt and beyond.

Keywords
Introduction
Normal growth is a universal public health concern, as growth during the pediatric years serves as a crucial indicator of health and nutritional status, requiring regular monitoring (El Shafie et al., 2021). Continuous tracking of growth helps detect developmental changes early, preventing long-term consequences such as behavioral disorders, learning disabilities, and cognitive delays. In Egypt, a lower-middle-income economy, economic challenges compound these concerns. The GDP growth per capita declined from 3.4% in 2019 to 1.4% in 2021, with children comprising nearly 39% of the population, reflecting the country’s youth bulge (UNICEF, 2022a).
Globally, malnutrition contributes to nearly 45% of child mortality, with approximately 3 million children under the age of 5 dying annually from malnutrition-related causes (Global Panel: United Nations Children’s Fund, World Health Organization and World Bank, 2016; WHO, 2018). Survivors of stunting, a form of chronic undernutrition, often face cognitive and psychological difficulties. In Egypt, the economic and social costs of stunting are significant, with stunting contributing to an estimated 2%–3% reduction in GDP (de Onis & Branca, 2016; USAID, 2017).
Stunting is characterized by a child’s length or height for age falling more than 2 standard deviations below the median for a well-nourished population. It reflects chronic inadequate nutrition and recurrent infections, particularly during the first 1,000 days of life, when interventions are most critical (Caballero et al., 2015). Improving children’s quality of life requires a combination of appropriate nutrition, healthcare, and psychosocial stimulation. Promoting proper feeding practices plays a crucial role in enhancing children’s growth and development (Ekholuenetale et al., 2020).
The prevalence of stunting remains a critical concern in many countries. In 2020, stunting was classified as a severe public health issue (over 30% prevalence) in four Arab countries: Djibouti, Libya, Sudan, and Yemen. Egypt, along with Mauritania, Somalia, and Syria, reported high levels of stunting among children under 5 (UNICEF, WHO & World Bank, 2021). While Egypt has made progress in reducing stunting, achieving the targets outlined in Egypt’s Vision 2030 remains a challenge, especially in addressing malnutrition comprehensively (UNICEF, 2022b).
Globally, 148 million children under 5 were stunted in 2022, with a prevalence rate of 22.3%. Of these, 52% lived in Asia, and 43% were in Africa (United Nations Children’s Fund (UNICEF), World Health Organization (WHO), & World Bank Group, 2023). Egypt’s stunting incidence declined slightly from 22.3% in 2020 to 21.7% in 2022 (Food and Agriculture Organization of the United Nations, 2022). However, the manual detection of stunting presents significant challenges, particularly in resource-limited settings. Traditional methods like cross-sectional surveys and community-based monitoring are time-consuming, requiring extensive data entry, coding, and analysis, which delays critical decision-making (de Onis & Branca, 2016). Healthcare workers often face additional challenges, such as staff shortages, financial constraints, and limited infrastructure, further complicating regular assessments (Tuffrey & Hall, 2016). Distinguishing between stunted and severely stunted children is another challenge, as both conditions exhibit similar physical traits but necessitate different interventions. This complexity increases the potential for human error, particularly when relying solely on manual measurements without robust data systems.
Automated, data-driven models offer a promising solution to these challenges. Such models can streamline data collection, provide real-time monitoring, and facilitate evidence-based healthcare decisions by minimizing human error. Predictive analytics enable proactive interventions and more efficient resource allocation, empowering healthcare providers to optimize treatment plans and improve child health outcomes (Cascini et al., 2021).
Data-driven technologies, especially in healthcare and predictive systems, harness the power of neural networks, including Artificial Neural Networks (ANNs), Convolutional Neural Networks (CNNs), and Autoencoder-based models, to efficiently analyze and utilize patient data. These models are capable of handling large datasets, uncovering complex patterns, and generating highly accurate predictions. ANNs, in particular, excel at learning from historical data, making them highly effective for tasks such as risk prediction and classification. By processing diverse datasets, ANNs significantly enhance healthcare decision-making, enabling precise predictions of patient outcomes and accurate risk assessments (Alatawi et al., 2023). CNNs are highly effective in analyzing medical images and time-series data. By capturing spatial patterns, CNNs have become essential in applications such as image-based diagnostics and subtle defect detection in healthcare systems (Xu et al., 2019). Autoencoder-based models, including convolutional autoencoders, are used for anomaly detection and feature extraction from multivariate medical data. They improve diagnosis by identifying irregularities in patient data that might otherwise go unnoticed, thereby enhancing fault detection (Chen et al., 2020). Through these neural networks, healthcare providers can automate decision-making processes, optimize treatment plans, and enhance diagnostic accuracy. The adoption of deep learning models, including ANNs and CNNs, supports the transition toward real-time, data-driven healthcare, improving patient outcomes and operational efficiency (Mauritsius et al., 2020; Rahman et al., 2024).
This study builds upon previous research that has utilized traditional statistical methods and early machine learning techniques to address childhood growth, as outlined by El Shafie et al. (2021). While earlier approaches, such as logistic regression and basic decision tree models, have provided valuable insights into risk factors for stunting, they often lack the capability to capture complex, non-linear interactions among features. Moreover, these methods face significant challenges in handling large, high-dimensional datasets, limiting their effectiveness in fully leveraging the available data.
In contrast, this research employs advanced machine learning models, including ANN, CNN, and Autoencoder-based architectures. These state-of-the-art methods enable the identification of intricate patterns and relationships within child and maternal health data, providing a more comprehensive and nuanced understanding of stunting classification. Furthermore, the incorporation of Autoencoder-enhanced models offers a novel approach to feature extraction and dimensionality reduction, effectively addressing challenges associated with data complexity and redundancy.
By comparing the performance of these advanced architectures, the study not only evaluates their individual strengths and limitations but also provides actionable insights into their practical applications for stunting detection and classification. These contributions position the research as a critical advancement in leveraging computational methods to address childhood stunting, a pressing public health issue with significant socio-economic implications.
Aim of study
The aim of this study is to explore the effectiveness of machine learning models—specifically Artificial Neural Networks (ANN), Convolutional Neural Networks (CNN), and Autoencoder-based hybrid architectures—for classifying growth patterns in children under 5 years old in Egypt.
Methodology
The methodology in this study is characterized by experimental and quantitative approaches. In our research on child stunting in Egypt, we utilize secondary data obtained from DHS conducted in 2005, 2008, and 2014. It should be noticed that there is no available survey for stunting in Egypt, introduced by DHS, after 2014. This data provides critical insights into the prevalence and trends of stunting among children up to 59 months during these years. Our study, conducted with the approval of DHS, aims to analyze the factors contributing to these trends and to propose effective interventions for reducing stunting rates in Egypt. The data included mothers’ age, weight, height, highest education level, region, place of residence, source of drinking water, Wealth index, Child is twin, Sex of child, Delivery by Cesarean section, Size of child at birth, BMI of mothers, Rohrer’s index of mothers, child age, weight, and height.
To assess the nutritional status of children, we calculated Weight-for-Age Z-score (WAZ) and Height-for-Age Z-score (HAZ) using WHO reference data. WAZ (Weight-for-Age Z-score): Formula: (Observed child weight − Median weight for age (WHO reference))/Standard Deviation (S.D. WHO reference). Its categories are Normal: WAZ between −2 and 2, Underweight: WAZ between −2 and −3, Severe underweight: WAZ less than −3 and Overweight: WAZ greater than 2 (14). HAZ (Height-for-Age Z-score): Formula: (Observed child height − Median height for age (WHO reference))/Standard Deviation (S.D. WHO reference). Its categories are specified as normal: HAZ greater than or equal to −2, stunted: HAZ less than −2 and severely stunted: HAZ less than −3 (World Health Organization, 2014).
Data Distribution
Child growth and development are influenced by multiple factors, including maternal characteristics, birth conditions, and environmental factors. Stunting, measured through Height-for-Age Z-scores (HAZ), reflects chronic malnutrition and inadequate growth over time. Understanding the distribution of HAZ scores across different variables, such as birth size, maternal height, weight, and age, as well as anthropometric indices like BMI, Rohrer’s Index, and WAZ (Weight-for-Age Z-score), is crucial in identifying key determinants of stunting.
This dataset provides a comprehensive overview of child and maternal characteristics to explore their influence on height-for-age outcomes. Visualizations, including raincloud plots, scatter plots, and correlation plots, offer insight into how maternal body composition, parity, and child’s birth size impact growth. While the relationship between maternal height and HAZ shows a slight positive correlation, other variables like maternal weight and age present weak or negligible associations. Additionally, WAZ demonstrates a strong positive correlation with HAZ, reinforcing the importance of nutritional status for preventing stunting. These visual patterns underscore the complexity of child growth, suggesting that multiple interrelated factors must be considered to design effective interventions for stunting reduction and child health improvement. For the sake of detailed data distribution, we present the following.
Figure 1 provides insights into the characteristics of children under 5 in the studied population. A majority of the children (62.4%) reside in rural areas, with most mothers having a secondary education level (51.3%). Wealth distribution shows that 22.2% belong to the poorest group, while 18% are in the richest. Almost all children (96%) are single births, with slightly more females (62.2%) than males. Delivery by cesarean section accounts for 33%, while 67% were vaginal deliveries. Most children (81.6%) were of average size at birth, though 10.5% were smaller than average. Nutritionally, 90.6% of the children were classified as normal, with 6.1% being overweight. In terms of growth patterns, 77.2% of the children were normal, but stunting remains a significant issue, with 13% stunted and 9.8% severely stunted. These insights highlight the prevalence of stunting in this population, underscoring the need for targeted interventions, particularly in rural and socio-economically disadvantaged areas.

Characteristics of studied children (n = 37,051).
The chart in Figure 2 presents the mean values and standard deviations for various parameters related to mothers and children. Mother’s height has the highest mean (160 ± 15 cm), indicating variability in height among the mothers. Mother’s weight shows a mean of 60 kg with a standard deviation of 10, suggesting moderate variation. Similarly, the Richer’s index of mothers (mean = 45 ± 8) also displays variability. Children’s height exhibits a mean of 90 cm with a standard deviation of 12, reflecting differences in growth patterns among children. On the other hand, mother’s age (25 ± 2 years) and BMI of mothers (23 ± 2) are more consistent, with smaller variability. Children’s weight (12 ± 2 kg) and age in months (24 ± 3 months) have relatively stable distributions. This analysis highlights significant variability in some key parameters, such as height and weight, which could affect growth monitoring and interventions.
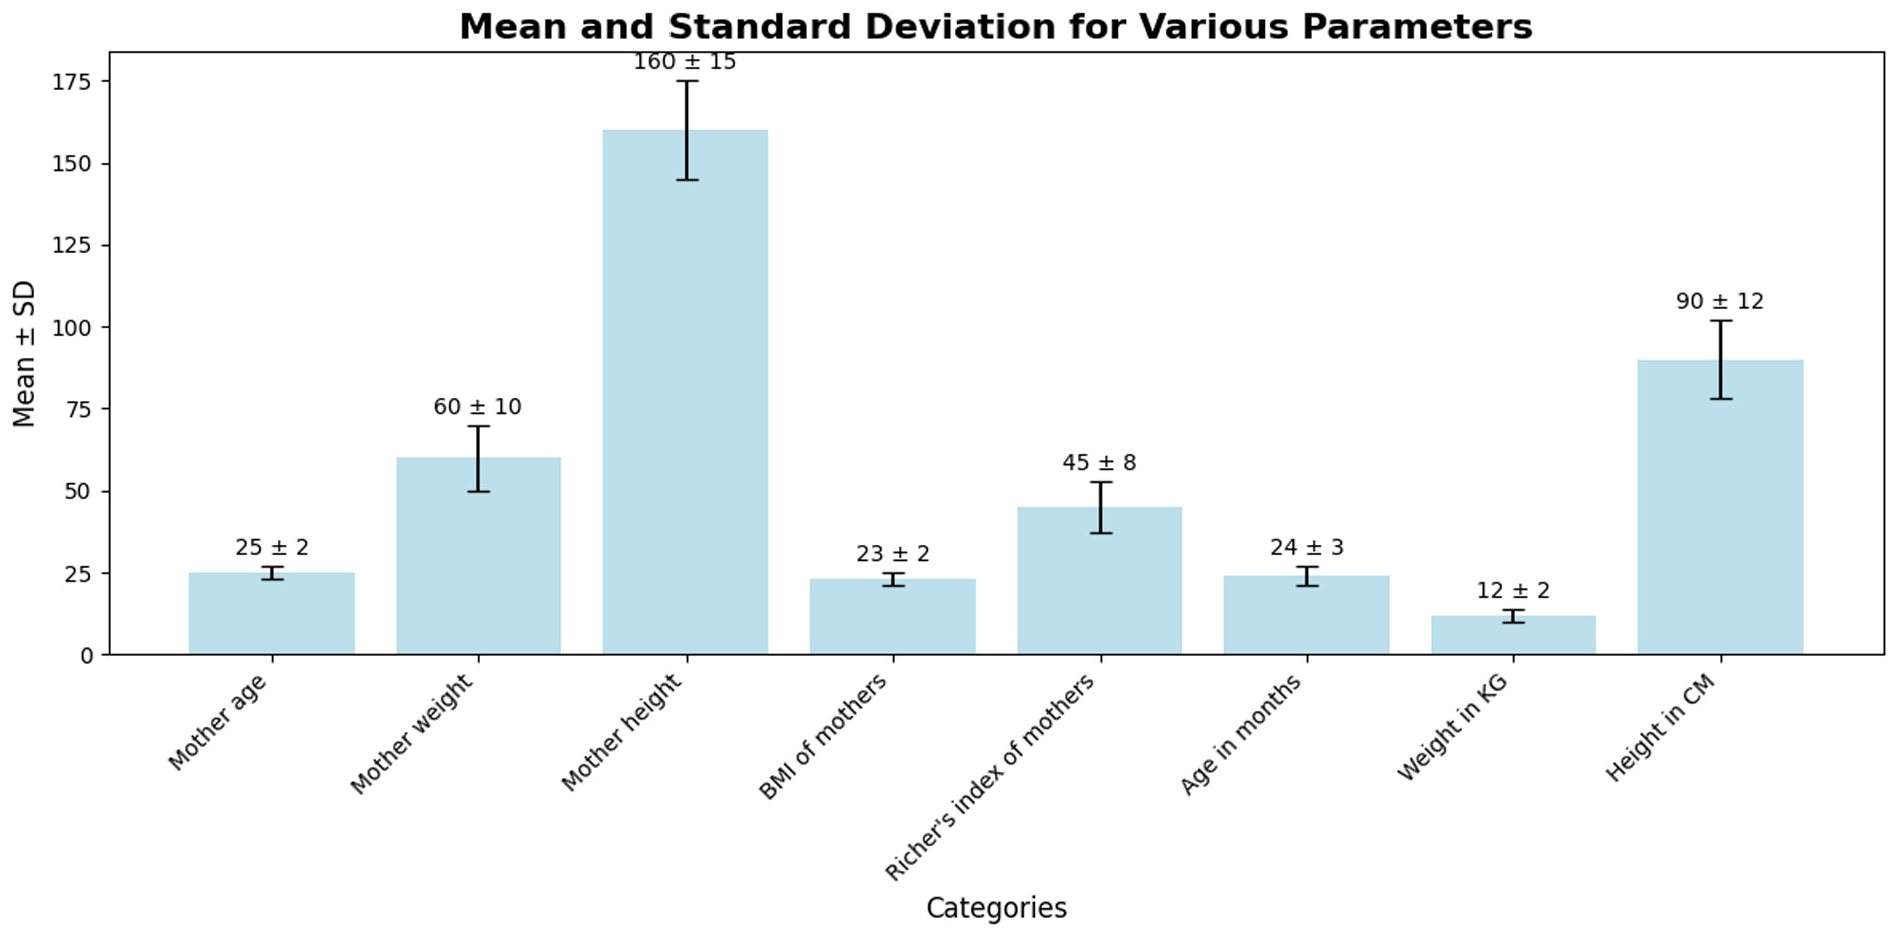
Distribution of key maternal and child health indicators: mean and standard deviation.
HAZ versus Body Mass Index: The trendline is nearly flat with an r-value of −0.04, indicating no meaningful correlation between HAZ (Height-for-Age Z-score) and BMI. This suggests that BMI is not a strong predictor of height-for-age outcomes in this dataset, possibly due to other factors such as nutrition and environmental influences. HAZ versus Rohrer Index: Similarly, the trendline between HAZ and Rohrer Index is flat with a minimal positive correlation (r = 0.02). This reinforces the observation that body composition, as measured by the Rohrer Index, has little impact on height-for-age outcomes. HAZ versus Parity Number: The trendline shows a slightly negative slope with an r-value of −0.04, indicating that higher parity (more children per family) might have a weak negative effect on children’s HAZ. While the correlation is weak, it suggests that children from larger families might face a higher risk of stunting, possibly due to resource constraints or caregiving challenges. HAZ versus WAZ (Weight-for-Age Z-score): The strongest positive correlation (r = 0.78) is observed between HAZ and WAZ. This indicates that improvements in weight-for-age are closely associated with better height-for-age outcomes, emphasizing the importance of weight management in addressing stunting.
Overall, WAZ is the strongest predictor of HAZ, underscoring the importance of ensuring proper nutrition and weight gain to improve children’s height outcomes. Body composition metrics like BMI and Rohrer Index are not significant predictors of stunting, suggesting that stunting may be more influenced by weight, nutrition, and family size rather than body mass or shape alone. Family size (parity) has a weak negative effect on HAZ, hinting at the need for targeted interventions in larger families to mitigate stunting risks, see more in Figure 3.

Relationships between anthropometric indicators and stunting: Insights from HAZ, WAZ, BMI, and parity correlations.
The raincloud plot in Figure 4 reveals a clear relationship between birth size and HAZ (Height-for-Age Z-scores). Larger birth sizes (“Very large” and “Larger than average”) are associated with higher HAZ scores, indicating better growth outcomes, while smaller birth sizes (“Very small” and “Smaller than average”) exhibit lower HAZ scores, highlighting a higher risk of stunting. Children with average birth size show a wider spread around normal scores, suggesting variability in outcomes. The “Don’t know” category presents inconsistent results, reflecting uncertainty in growth trends without reliable birth size data. Outliers across all categories reinforce the importance of early monitoring, especially for smaller birth sizes, to prevent stunting.

Association between birth size and height-for-age outcomes: Insights from HAZ distributions.
The scatter plots reveal weak or negligible correlations between HAZ (Height-for-Age Z-score) and maternal characteristics such as height, weight, and age. The trendline for maternal height shows a slight positive slope, suggesting that taller mothers may have children with slightly better height outcomes, though the relationship is weak. Similarly, the trendline for maternal weight is nearly flat, indicating that weight alone is not a significant predictor of children’s HAZ scores. Lastly, the relationship between maternal age and HAZ is also minimal, with no clear trend emerging. These findings suggest that while maternal height may offer some predictive value, other factors—such as nutrition, socioeconomic status, and access to healthcare—likely play more critical roles in determining stunting and growth outcomes, see more in Figure 5.
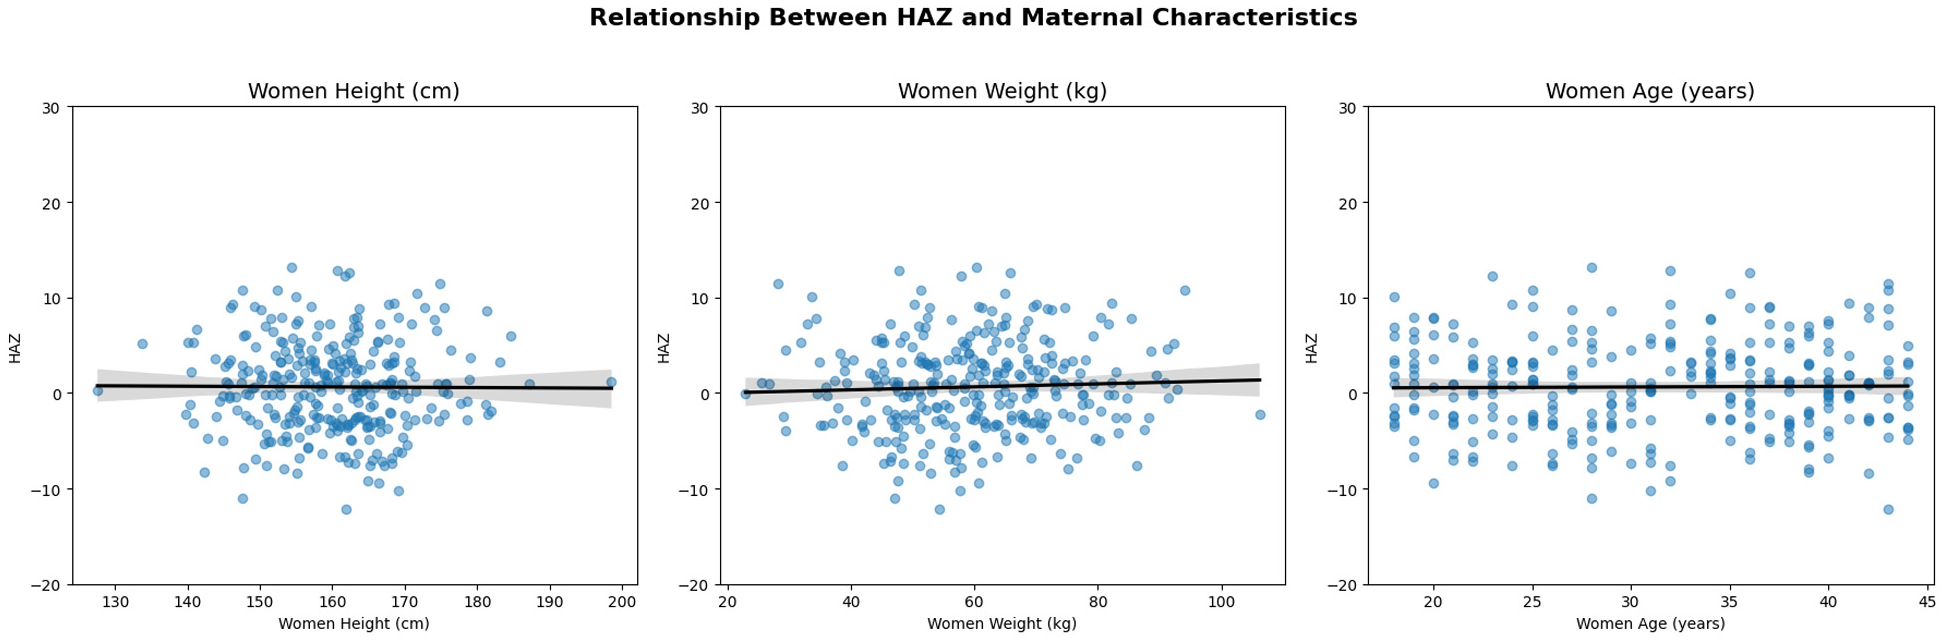
Scatter plots showing the relationship between HAZ and maternal height, weight, and age, with weak or negligible correlations.
Data Preprocessing and Modeling
The datasets are pre-processed and divided into training and test sets. Following the approach suggested by Korjus et al. (2020), a 70:30 split is applied, with 70% of the data allocated for training and 30% for testing, as this ratio often yields more accurate and reliable outcomes by providing the model with sufficient training data. Key columns with the most significant impact and strongest interrelationships, as identified through the previous data distribution analysis, are selected for further analysis. Next, we implement the following data driven techniques.
Artificial Neural Network (ANN) Modeling
The ANN used in this study is composed of three dense (fully connected) layers as in Figure 6, designed to classify children into categories such as normal, stunted, and severely stunted. This architecture allows the model to learn complex patterns by processing input features through multiple layers of neurons. Each neuron in the dense layers connects to every neuron in the subsequent layer, ensuring that the model captures both linear and non-linear relationships within the data.

ANN architecture with three dense layers.
Artificial Neural Networks were chosen for this study due to their ability to handle structured tabular data effectively and their proficiency in capturing both linear and non-linear relationships among features. ANNs excel at identifying intricate patterns within large datasets, making them ideal for analyzing complex child and maternal health data. Their flexibility and adaptability enable them to perform well in multi-class classification tasks, such as categorizing children into normal, stunted, and severely stunted groups. Furthermore, ANNs are computationally efficient, allowing for faster training and convergence, while their robust generalization capabilities make them suitable for predictive modeling in healthcare contexts.
The input layer receives child and maternal health parameters, such as birth size, maternal height, weight, and age, which are expected to influence the child’s growth outcomes. The first dense layer reduces the dimensionality of the input features, transforming them into a smaller set of 64 neurons while applying ReLU (Rectified Linear Unit) activation to introduce non-linearity. The second hidden layer, consisting of 32 neurons, continues refining the learned features, making the model more efficient in identifying meaningful patterns. The final dense layer outputs predictions for the three target classes (normal, stunted, and severely stunted) using a softmax activation function, which ensures that the model produces class probabilities summing to 1.
The model was trained using backpropagation to minimize the error between predicted and actual values, with the loss optimized using the categorical cross-entropy function, a common loss function for multi-class classification. Dropout layers were used during training to prevent overfitting by randomly deactivating a fraction of neurons, helping the model generalize better to unseen data. This structure ensures that the network can effectively learn from complex child and maternal data, providing accurate predictions for growth outcomes.
This ANN architecture leverages the power of dense connections and controlled dimensionality reduction to extract meaningful patterns from the input data. The gradual reduction of neurons across layers ensures that the network focuses on the most informative features, minimizing overfitting while promoting generalization. The compact yet effective structure of this model supports efficient learning, making it well-suited for multi-class classification tasks such as identifying children’s nutritional statuses as normal, stunted, or severely stunted.
The confusion matrix in Figure 7 for the ANN model shows that the model performs well in classifying the three categories: normal, stunted, and severely stunted. 8526 instances were correctly classified as normal, with only 51 misclassified as stunted. The model shows high precision for the normal class, as no samples were misclassified into the severely stunted class. 1077 instances were correctly identified as severely stunted, with 14 incorrectly classified as stunted. The model demonstrates a good ability to distinguish between severely stunted and other categories. 1387 samples were correctly classified as stunted, though 15 were misclassified as normal and 46 as severely stunted. This indicates that while the model performs well for this class, there is some confusion with neighboring categories, especially with severely stunted. Overall, the model exhibits high accuracy for the normal and severely stunted classes, with minor confusion in distinguishing stunted samples. This suggests that the ANN model can reliably predict outcomes, but the borderline cases between stunted and severely stunted may require further refinement.

Confusion matrix for the ANN model.
The training and validation curves for the ANN model in Figure 8 demonstrate the model’s performance over 6 epochs. The training accuracy consistently improves, reaching nearly 99.5% by the end of training, indicating that the model has learned the patterns in the training data effectively. The validation accuracy shows slight fluctuations, with a dip around epoch 3 and then a recovery. This suggests that while the model generalizes well to unseen data, there may be slight variability in performance, possibly due to complex data patterns or overfitting tendencies. The training loss decreases steadily, suggesting that the model’s predictions on the training data improve with each epoch. Validation loss shows an irregular pattern, with a noticeable increase at epoch 3, indicating the model might encounter some difficulty generalizing perfectly to the validation data. However, the gap between training and validation loss remains relatively small, which suggests moderate overfitting. The plots indicate that the ANN model achieves high accuracy, but the fluctuations in validation accuracy and loss hint at slight overfitting. Further improvements, such as regularization techniques or additional training epochs, may help stabilize the performance on the validation set.

Accuracy and loss curves for the ANN model over 6 epochs.
Convolutional Neural Network (CNN) Modeling
The CNN used in this study is designed to classify data into three categories: normal, stunted, and severely stunted. CNNs are well-suited for tasks that require spatial pattern recognition due to their ability to automatically extract hierarchical features through convolutional layers. The structure of the CNN model used here combines convolutional layers, pooling layers, flattening layers, and dense layers to efficiently transform input data into meaningful predictions.
The first convolutional layer (conv2d_18) processes the input data of shape (64, 1, 1), which likely represents 64 features for each sample. This layer outputs 32 feature maps by applying a set of 32 filters, allowing the model to detect patterns in the input data. This is followed by a max-pooling layer (max_pooling2d_8), which reduces the spatial dimensions, making the model more computationally efficient by retaining only the most important features. A second convolutional layer (conv2d_19) further extracts higher-level patterns from the feature maps and outputs 64 feature maps. Another max-pooling layer (max_pooling2d_9) reduces the dimensionality, preparing the data for the dense layers. The flatten layer (flatten_9) transforms the output of the pooling layer into a 1D vector of size 896, making it suitable for dense layer processing. The first dense layer (dense_18) reduces the input to 128 neurons, learning meaningful abstract features. Finally, the output layer (dense_19) produces 3 neurons, corresponding to the three target classes (normal, stunted, and severely stunted). A softmax activation function is typically used at this stage to convert the outputs into class probabilities. This CNN structure leverages convolutional layers for feature extraction and dense layers for final decision-making. The combination of feature extraction and classification layers ensures that the model can effectively handle complex patterns in the data, making it suitable for multi-class classification tasks, Figure 9.

CNN architecture.
While Convolutional Neural Networks are traditionally applied to spatial data such as images, we adapted this method for structured tabular data to leverage its ability to extract hierarchical patterns and complex interactions among features (Zheng & Casari, 2018). The input features, including maternal and child characteristics such as maternal height, weight, child age, and birth size, were treated as one-dimensional tensors. This allowed the CNN to emulate spatial relationships and identify non-linear dependencies between variables. Convolutional and pooling layers were employed to capture high-level patterns and reduce dimensionality while preserving critical information. This adaptation enabled the model to focus on the most informative aspects of the data and differentiate between normal, stunted, and severely stunted growth patterns. The inclusion of CNN in this study also served as part of a comparative analysis with ANN, evaluating its potential in extracting subtle patterns in structured datasets and contributing unique insights into the classification process.
The confusion matrix for the CNN model as in Figure 10 demonstrates the model’s performance across three classes: normal, stunted, and severely stunted. The majority of predictions for the normal class (8049 out of 8577 true labels) are accurate, indicating the model’s proficiency in identifying normal cases. However, misclassifications are evident for the severely stunted and stunted categories, with 933 and 1293 samples, respectively, being incorrectly predicted as normal, suggesting challenges in distinguishing between malnourished and healthy children. Additionally, 41 severely stunted samples were misclassified as stunted, while only 117 were correctly identified. This pattern highlights the difficulty in correctly identifying stunting severity, which may indicate the need for more precise feature extraction or data balancing for better discrimination between similar categories. The relatively high misclassification rates for stunted children show that the model struggles more with stunted cases, requiring further optimization or additional training data to improve classification in those edge cases.

Confusion matrix for CNN model.
The training and validation curves for the CNN model’s accuracy and loss highlight key aspects of the model’s performance over six epochs, see Figure 11. In the accuracy plot (left), training accuracy steadily improves with each epoch, increasing from approximately 50% in the first epoch to around 68% by the fifth epoch. However, the validation accuracy shows an irregular trend, starting high near 74% but then experiencing a sharp drop around the third epoch before partially recovering. This behavior suggests that the model may encounter overfitting or instability, as it initially generalizes well but struggles to maintain consistent performance on unseen data. The fluctuations in validation accuracy indicate that the model may require further tuning or regularization to prevent overfitting.

Accuracy and loss curves for the CNN model over 5 epochs.
In the loss plot (right), training loss decreases consistently throughout the epochs, indicating that the model is learning and improving its ability to minimize errors on the training set. However, the validation loss exhibits a different pattern, with a slight increase over the initial epochs and a sharp rise around the third epoch, followed by a plateau. The divergence between training and validation loss from epoch three onward suggests overfitting, where the model becomes overly specialized to the training data but struggles to generalize effectively to unseen samples. These patterns highlight the need for potential optimizations, such as early stopping, data augmentation, or dropout layers, to improve the model’s robustness and prevent overfitting.
Autoencoder with Artificial Neural Network
The Autoencoder with Artificial Neural Network (AE + ANN) model, in Figure 12, used in this study integrates the capabilities of autoencoders for feature extraction with the learning power of ANN for classification tasks. The purpose of this hybrid structure as observed in Figure 12 is to leverage the autoencoder’s ability to reduce the dimensionality of the input data while preserving essential features, which are then passed into the ANN for classification. This combination ensures the model can efficiently handle high-dimensional data, minimize redundancy, and optimize performance.

Architecture of the AE + ANN model with three dense layers.
The autoencoder (AE) component serves as the first part of the model, responsible for extracting significant features. It begins with an input layer that receives data, such as vectors of 67 features per sample, with the shape (None, 67), where None refers to a flexible batch size. The encoder section consists of multiple dense layers that progressively reduce the dimensionality of the input. For example, the first dense layer may have 128 neurons, followed by a smaller dense layer with 67 neurons. The output of the encoder is a latent space representation, a compressed version of the input that retains only the most important patterns while discarding irrelevant or redundant information.
After encoding, the latent space output is reshaped using a reshape layer to ensure compatibility with the ANN’s input format. This reshaping step ensures the compressed vector from the AE is transformed into the appropriate shape without changing the total number of elements. This bridge between the AE and ANN guarantees seamless integration between both components, enabling efficient processing of the extracted features.
The ANN component follows the autoencoder and is responsible for classification. It comprises several fully connected (dense) layers, each designed to capture complex patterns within the data. The first dense layer typically has 128 neurons with ReLU activation, introducing non-linearity to better model intricate relationships. Subsequent dense layers refine the learning, and the final output layer uses softmax activation to predict probabilities for the three target classes: normal, stunted, and severely stunted.
The AE + ANN model offers several benefits. The autoencoder compresses the high-dimensional input into a smaller feature set, which makes training more efficient while preserving meaningful information. The ANN then uses these extracted features to accurately predict outcomes. This structure is particularly useful for structured data tasks where subtle patterns among features can be crucial for reliable predictions.
In conclusion, the AE + ANN model combines the dimensionality reduction power of autoencoders with the classification capability of ANN, providing an efficient and accurate solution for complex classification tasks. This architecture ensures only essential information is fed into the ANN, reducing computational costs and noise, while improving predictive accuracy. The model is especially well-suited for tasks such as stunting classification, where learning from intricate patterns is essential for accurate health-related predictions.
The confusion matrix in Figure 13, provides detailed insights into the performance of the classification model. The matrix indicates that 7311 normal cases were correctly classified, but 657 normal samples were misclassified as stunted and 604 as severely stunted, reflecting some misclassification errors. For the stunted class, 761 samples were correctly identified, but 118 were incorrectly classified as normal and 200 as severely stunted, suggesting challenges in distinguishing between stunted and adjacent categories. In the severely stunted class, 868 samples were accurately predicted, but 295 samples were misclassified as normal and 302 as stunted, showing that the model faces difficulties in differentiating the severely stunted cases. The model performs reasonably well in identifying normal cases but has higher misclassification rates among stunted and severely stunted classes, highlighting the need for further optimization to enhance class differentiation, especially between closely related classes.

Confusion matrix for AE + ANN model.
The upper plot in Figure 14 visualizes the autoencoder loss during training, with both training and validation losses gradually decreasing over time. The loss drops sharply in the early epochs before stabilizing toward 0.20, indicating that the autoencoder effectively compresses and reconstructs input data over time. The tight alignment of training and validation loss implies good generalization with minimal overfitting. The smooth descent in both losses demonstrates the model’s increasing efficiency in learning data patterns, making it suitable as a pre-training step for downstream tasks such as dimensionality reduction or classification. This indicates that the autoencoder is well-calibrated and performing effectively for this task.
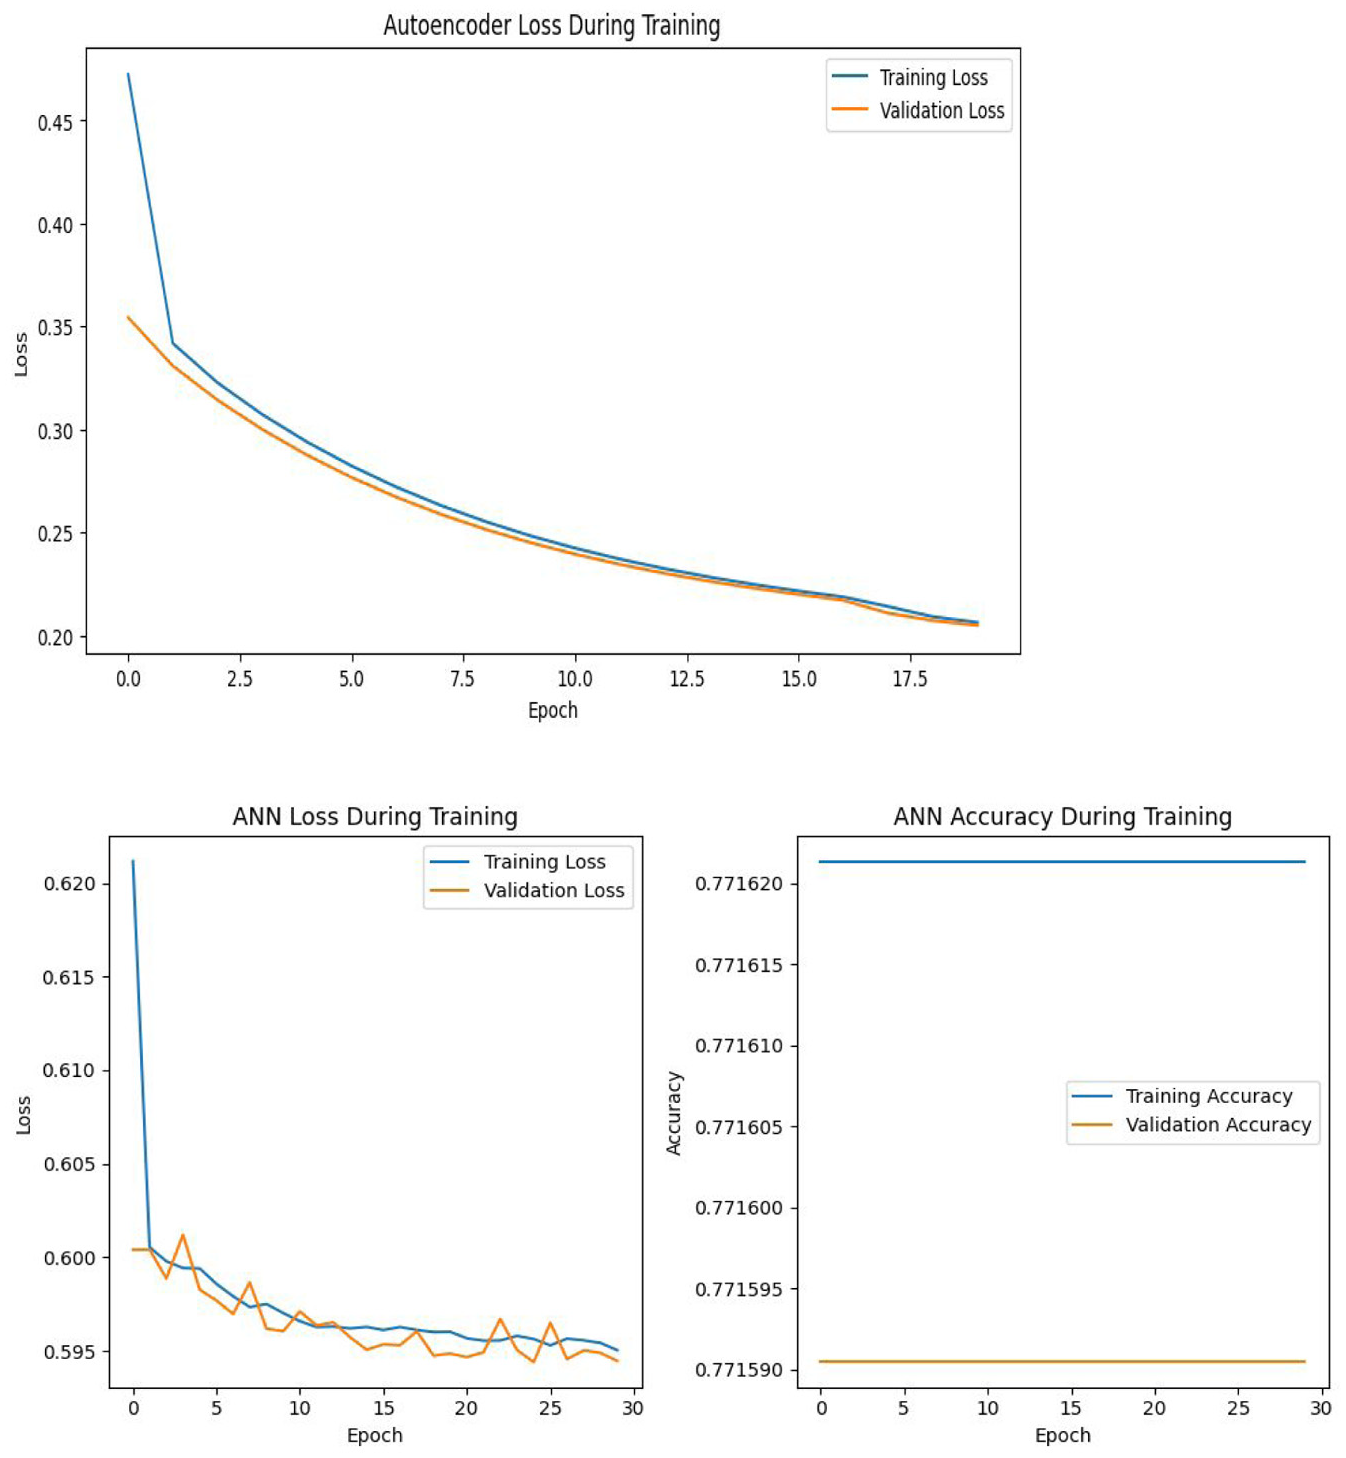
Accuracy and loss curves for AE + ANN modeling.
The lower plot in Figure 14 displays the loss during the training of the ANN model after the application of AE, highlighting the convergence of both training and validation loss over the course of 30 epochs. The training loss decreases steadily from above 0.62 to below 0.595, reflecting the model’s ability to improve with more epochs. Validation loss follows a similar trend, suggesting that the model generalizes reasonably well, though the small fluctuations indicate minor overfitting or noise in the data. The second chart of ANN accuracy, however, is flat throughout the epochs, remaining around 0.7716 for both training and validation accuracy. This suggests that the model may be saturated and not learning further improvements, possibly due to a limited capacity to capture the data’s complexity or the need for tuning.
Autoencoder with Convolutional Neural Network
The Autoencoder with Convolutional Neural Network (AE + CNN) model implemented in this study integrates the strengths of autoencoders for feature extraction and CNNs for classification, Figure 15. This hybrid approach leverages dimensionality reduction and spatial feature learning to effectively classify complex data. The architecture is divided into two main components: The autoencoder (AE) for feature compression and the convolutional neural network (CNN) for spatial feature learning and classification.
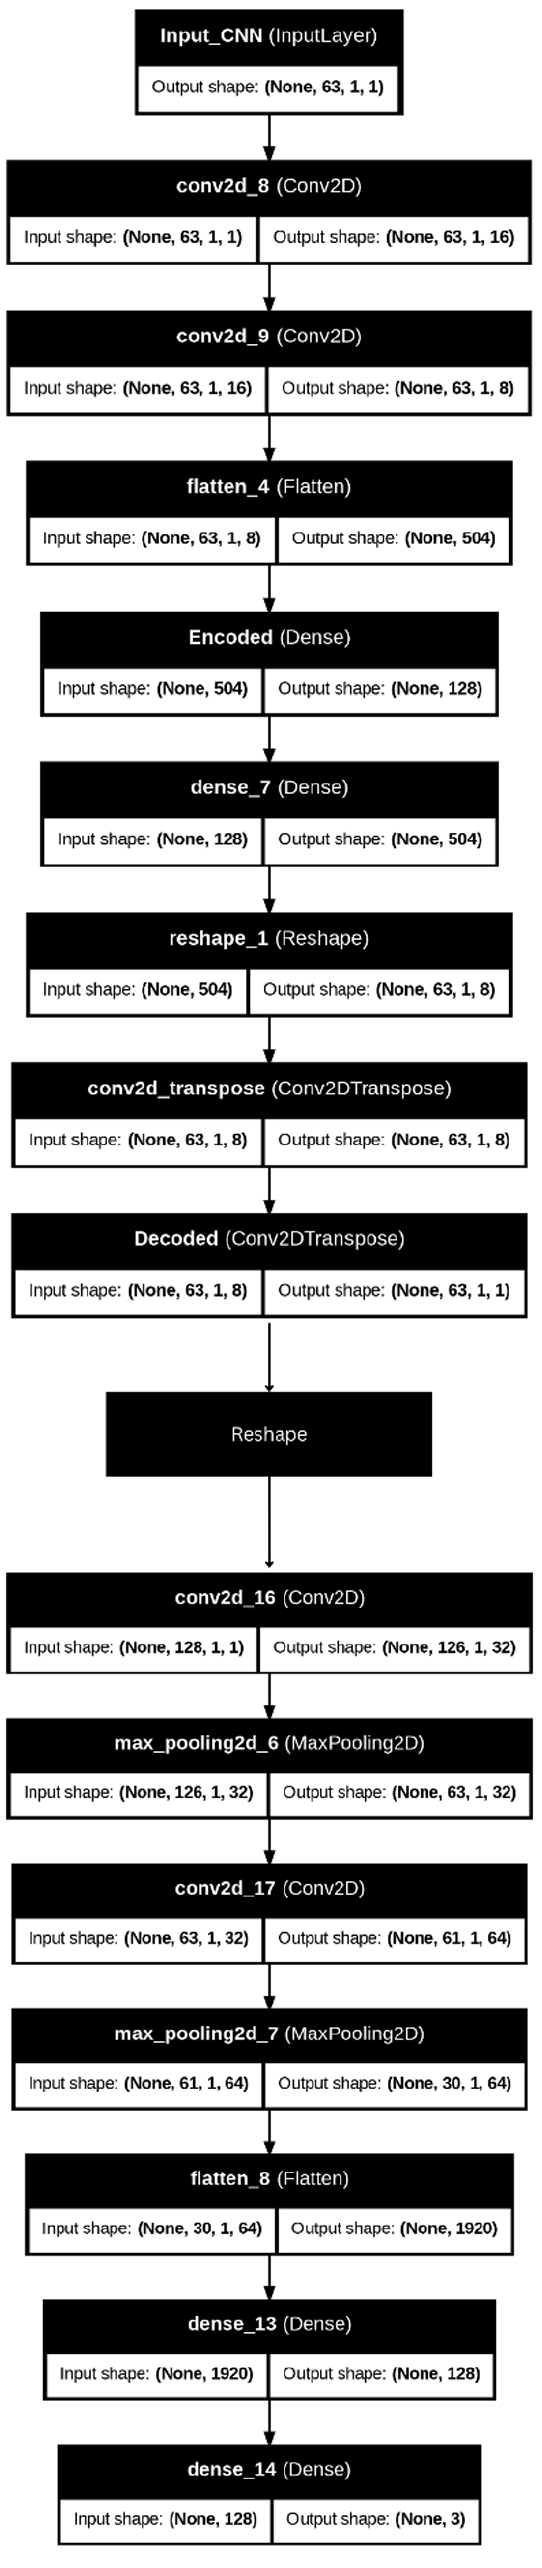
Architecture of AE + CNN modeling.
The autoencoder serves as the initial part of the pipeline, compressing input data into a lower-dimensional latent space that preserves the most significant features while discarding redundancy. It starts with an input layer that receives data with a shape such as (128, 1, 1). The encoder section includes multiple convolutional layers with progressively increasing filters (e.g., 16 and 8 filters) that capture spatial patterns while maintaining the structure of the input data. A flatten layer then converts the multi-dimensional feature maps into a one-dimensional vector, which is passed to a dense encoding layer. This encoded output forms the latent space representation, carrying essential patterns from the input while discarding noise or irrelevant details. The autoencoder, in this way, acts as a feature extractor, ensuring that the CNN component can focus on meaningful patterns for classification.
Between the AE and CNN components, a reshape layer is used to ensure compatibility between the compressed latent space and the input shape expected by the CNN. This step reconfigures the latent space into a two-dimensional tensor without altering the total number of elements, enabling the CNN to operate on the data seamlessly. This reshaping ensures smooth integration between the autoencoder and CNN sections of the model.
The CNN component follows the reshaping operation and processes the data for classification tasks. It consists of multiple convolutional layers that apply filters to the reshaped input to capture deeper spatial dependencies in the data. For example, the first convolutional layer may apply 32 filters with a 3 × 3 kernel to detect basic patterns, followed by a second convolutional layer with 64 filters for more complex feature extraction. MaxPooling layers are used after each convolutional layer to reduce the dimensionality of the feature maps, which helps in minimizing computational costs while retaining essential information. These layers allow the network to efficiently extract spatial features.
The output from the CNN is flattened into a one-dimensional vector before passing through fully connected (dense) layers for classification. A dense layer with 128 neurons and ReLU activation is employed to introduce non-linearity and capture complex relationships among features. The final output layer uses softmax activation to predict probabilities for the three target classes: normal, stunted, and severely stunted. This classification approach ensures that the model can accurately predict the class of each input based on learned patterns.
To further enhance performance, regularization techniques such as dropout layers can be employed between the dense layers to reduce overfitting. Additionally, batch normalization can be integrated to stabilize learning and speed up convergence during training.
In summary, the AE + CNN architecture combines the feature extraction capabilities of autoencoders with the spatial learning power of CNNs, creating a robust framework for classification tasks. This hybrid model is particularly well-suited for handling complex, high-dimensional data such as child growth and stunting prediction where both dimensionality reduction and spatial dependencies are essential. The autoencoder ensures that only relevant features are passed to the CNN, optimizing performance and reducing overfitting risks. This structure allows the model to effectively handle structured data while leveraging CNN’s strength in learning intricate spatial relationships.
The AE + CNN model demonstrates robust classification performance as seen in Figure 16, particularly for the normal category, with 8099 instances correctly classified. This high accuracy for normal predictions highlights the model’s ability to recognize healthy cases effectively. However, the matrix also reveals some misclassifications, with 66 instances of normal cases being misidentified as stunted and 407 instances as severely stunted. This pattern suggests that while the model excels at predicting normal cases, a portion of these predictions is mistakenly assigned to more severe classes, which could indicate the need for improved feature discrimination.

Confusion matrix for AE + CNN modeling.
The stunted category shows mixed performance, with 868 instances accurately classified. However, 121 instances of stunted cases are classified as normal, and 90 are misclassified as severely stunted. These errors suggest that the model struggles to capture subtle differences between normal and stunted conditions and between stunted and severely stunted cases. This confusion may arise due to overlapping characteristics within the dataset, particularly between neighboring categories.
The model’s performance in predicting severely stunted cases is also notable, with 1249 correct predictions. However, 125 instances of severely stunted children are misclassified as normal, and 91 as stunted. The frequent misclassification between stunted and severely stunted categories indicates that the model finds it challenging to differentiate between these two conditions. This could suggest the need for further feature engineering or deeper fine-tuning of the network to better capture the differences between these categories.
Overall, the model’s tendency to perform better in the majority class (normal) and struggle with finer distinctions between stunted and severely stunted categories suggests a possible class imbalance issue in the dataset. To enhance performance, strategies like class balancing techniques, improved feature engineering, and hyperparameter tuning could be explored. These steps would not only help reduce misclassifications but also improve the model’s ability to differentiate between similar cases, ensuring better accuracy in real-world applications.
The upper graph in Figure 17 illustrates the autoencoder loss during training. The rapid initial drop in both training and validation losses highlights the autoencoder’s ability to quickly learn an effective compressed representation of the input data. However, as the epochs progress, both losses plateau, suggesting that the model reaches a point of minimal further improvement. The relatively close alignment between training and validation loss curves indicates that the autoencoder generalizes well without significant overfitting, capturing the essential features effectively. The lower graph in Figure 17, reflecting CNN’s loss during training after applying the AE, reveals some challenges in the second stage of learning. While the training loss decreases steadily, indicating the CNN’s ability to fit the training data, the validation loss increases progressively. This divergence suggests a potential overfitting problem, where the CNN may be learning patterns specific to the training set but not generalizing well to unseen data. This pattern implies that despite the benefits provided by the pre-trained autoencoder, further tuning of the CNN’s hyperparameters or regularization might be needed to improve its performance on validation data. In summary, while the autoencoder performs well, the CNN experiences overfitting, indicating room for optimization. This insight calls for strategies such as adjusting learning rates, implementing dropout layers, or introducing early stopping to prevent overfitting in the CNN stage.

Loss curves for the AE + CNN architecture.
Discussion
Our study explores the performance and outcomes of ANN, CNN, and Autoencoder-based models for growth classification in Egyptian children under 5. The study findings revealed that each architecture presents unique advantages and challenges. ANN achieved the highest accuracy and validation accuracy among all models, showcasing its strength in generalization. This performance highlights ANN’s suitability for structured datasets in predicting child growth patterns effectively.
AE + ANN and CNN demonstrated relatively balanced performances between accuracy and validation accuracy, indicating moderate stability. However, AE + CNN exhibited a noticeable drop in validation accuracy, hinting at potential overfitting or data generalization issues. Furthermore, AE + CNN experienced the highest loss and validation loss, reflecting possible learning difficulties and overfitting concerns. On the other hand, ANN demonstrated minimal loss, reinforcing its effective training and superior generalization. While AE + ANN showed a slightly higher loss, it remained more stable compared to AE + CNN. CNN, despite showing moderate loss, displayed consistency with validation loss remaining close to the training loss, see Figure 18.

Comparison of model accuracy and loss across AE + ANN, AE + CNN, ANN, and CNN architectures.
These results suggest that ANN architecture outperformed the other models by maintaining an ideal balance between accuracy and loss. In contrast, AE + CNN may require additional tuning to mitigate overfitting and enhance its learning capability. AE + ANN, while stable, exhibited slightly lower performance, reflecting the trade-off between model complexity and practical performance. This study underscores the importance of selecting suitable neural architectures based on dataset characteristics and emphasizes the need for further optimization in models like AE-CNN to improve predictive outcomes.
These results were supported with studies conducted by Ndagijimana et al. (2024) who demonstrated an overall accuracy of 72.0% on the test set, with an AUC-ROC score of 0.84, highlighting the model’s strong predictive capability. These findings align with existing research that supports the application of artificial neural networks for healthcare predictions. In particular, ANNs have proven useful in predicting stunting in Rwanda and identifying critical risk factors associated with stunting (Ndagijimana et al., 2024).
ANNs and decision trees are widely utilized in healthcare research for various tasks, such as predictive modeling, optimizing patient care, and testing new treatment strategies (Smith & McConnell, 2024). Their ability to recognize complex patterns gives ANNs a significant advantage in predicting outcomes and analyzing healthcare data (Dancey et al., 2004). In comparative analyses, ANNs have shown superior performance, as reflected by their higher AUROC scores (0.89) compared to logistic regression models (0.87; Pienaar et al., 2022). In addition, Binsar and Mauritsius (2020a) found that Random Forest models achieved the highest accuracy at 89%, followed by Support Vector Machines at 87% and Naïve Bayes at 68%.
The versatility of ANNs extends to education and other domains, with studies reporting the highest accuracy in predicting student performance (Adnan et al., 2021). In healthcare, applications of ANNs include clinical diagnosis, cancer prediction, speech recognition, and prediction of hospital length of stay (Lee & Park, 2001). ANNs are also employed for medical image analysis, such as automated ECG interpretation for diagnosing myocardial infarction, and in pharmaceutical research for drug development (Bartosch-Härlid et al., 2008). A recent study by Wondemagegn and Mulu (2022) conducted a community-based investigation on children under the age of 5 to examine the effects of nutritional status on neurodevelopment. The study utilized logistic regression to identify factors associated with poor child development across various domains, including neurological development. Similarly, Astle et al. (2019) introduced a novel approach to identifying neurocognitive dimensions associated with learning difficulties, providing fresh insights into this critical area of research.
Binsar and Mauritsius (2020b) found that the predicted values generated by the model closely matched the actual values, demonstrating the feasibility and effectiveness of using the Long Short-Term Memory (LSTM) network to predict optimum drug needs for the coming weeks. Furthermore, deep learning models like convolutional neural networks are used to analyze dynamic datasets from electronic health records, enabling real-time predictions of patient outcomes, such as mortality (Kim et al., 2019). Similarly, Aczon et al. (2021) highlighted the potential of recurrent neural networks for continuous prediction of mortality in pediatric intensive care units (PICUs). These results underscore the importance of neural networks in predictive healthcare and illustrate how their advanced capabilities can improve decision-making and resource management across various settings.
Conclusion
In this study, we implemented and evaluated two hybrid architectures, AE + ANN and AE + CNN, along with standalone ANN and CNN models to assess their effectiveness in classification tasks involving child growth and stunting data. Each architecture presents unique strengths and limitations, depending on the data type, structure, and task requirements. The AE + ANN architecture demonstrated strong performance on tabular data, achieving high accuracy with lower loss. By using dense layers after feature extraction from the autoencoder, the AE + ANN effectively captures relationships between features, making it a viable option for structured datasets like demographic or health data. Its lower computational demands and faster convergence make it suitable for scenarios where resources are limited, or rapid prototyping is needed. Furthermore, the AE + ANN model displayed balanced generalization, showing minimal overfitting across the training and validation phases. On the other hand, the AE + CNN architecture struggled with overfitting, exhibiting higher loss and lower validation accuracy. This indicates that while CNN layers excel at capturing spatial dependencies, they require larger datasets or more advanced regularization techniques to perform optimally. AE + CNN’s performance could benefit from tuning hyperparameters, data augmentation, and regularization techniques to prevent overfitting. However, its structure makes it more suitable for image data or spatially correlated data rather than tabular datasets, where ANN architectures excel.
Standalone ANN and CNN models were also analyzed. The ANN model outperformed the CNN in terms of accuracy, validation loss, and stability, highlighting its strength in structured data scenarios. CNN, though not as accurate for this task, remains a valuable choice when dealing with more complex datasets, especially those involving spatial patterns, such as medical images.
To further optimize the AE + CNN model, future research could explore the integration of dropout layers, batch normalization, and transfer learning. Additionally, ensemble learning combining predictions from AE + ANN, AE + CNN, and other architectures could yield more robust results. Larger datasets, particularly for spatial tasks, could enhance the performance of CNN-based models. Moreover, hyperparameter tuning and advanced techniques like early stopping and learning rate schedulers could further improve both AE + ANN and AE + CNN outcomes.
In conclusion, this study shows that the AE + ANN architecture provides the best balance between accuracy, efficiency, and generalization for structured data, while AE + CNN may need further adjustments to unlock its potential. The choice between these models should be informed by the nature of the data and the specific task, with ANN being ideal for structured data and CNN excelling in spatial contexts.
Practical Implications
The findings of this study have significant practical implications for addressing childhood stunting, particularly in resource-limited settings like Egypt. The use of advanced machine learning models, such as ANN and CNN, offers a scalable and efficient solution for early detection of stunting. These models can be integrated into healthcare systems to automate the identification of children at risk, reducing reliance on manual assessments, which are often time-consuming and error-prone.
By leveraging these models, healthcare providers can implement targeted interventions, allocate resources more effectively, and improve health outcomes for vulnerable populations. For instance, policy-makers can utilize these tools to prioritize interventions for severely stunted children or develop region-specific strategies based on predictive analytics. Furthermore, the incorporation of Autoencoder-enhanced models facilitates the handling of complex, high-dimensional data, ensuring more accurate and reliable predictions.
These advancements also enable real-time decision-making, allowing healthcare systems to respond dynamically to changing trends in child health. Ultimately, this research supports the transition toward data-driven healthcare, improving both operational efficiency and the overall quality of care in public health initiatives.
Footnotes
Acknowledgements
The authors extend their appreciation to Princess Nourah bint Abdulrahman University Researchers Supporting Project number (PNURSP2025R844), Princess Nourah bint Abdulrahman University, Riyadh, Saudi Arabia.
Funding
The authors disclosed receipt of the following financial support for the research, authorship, and/or publication of this article: Princess Nourah bint Abdulrahman University, Researchers Supporting Project number (PNURSP2025R844), Princess Nourah bint Abdulrahman University, Riyadh, Saudi Arabia.
Declaration of Conflicting Interests
The authors declared no potential conflicts of interest with respect to the research, authorship, and/or publication of this article.
Data Availability Statement
The data that support the findings of this study are available upon request from the corresponding author.