
Abstract
The cost and profit efficiency of all Indian life insurance businesses is examined in this article using the data development analysis technique for the years 2017 through 2021. The Tobit regression is also used in this study to look into how well life insurance performs in relation to company factors. Cost efficiency scores were higher than profit efficiency ratings, as shown by the study. According to this, one of the most important inefficiencies for Indian life insurance is revenue inefficiency. In addition, state-owned life insurance firm in India is more profitable and economical than private ones, according to this study. In general, joint life insurers are more cost-effective than domestic life insurance companies, whereas domestic life insurance companies are more profit-efficient than joint venture insurers. The profitability and cost-effectiveness of life insurers are positively impacted by the claims ratio. While there are favorable effects of the distribution ratio and market share, respectively, effects on profit and cost-effectiveness. During the study period, the Indian life insurance businesses were relatively cost and profit efficient, according to empirical evidence. This study is the first to examine the profit and cost efficiencies of all Indian life insurance businesses. Decision-makers, top management, regulators, and other industry stakeholders will all gain from the research.
Introduction
In any nation, the insurance industry is a significant economic sector. The country’s economy will be significantly impacted by its excellent development. Commercial insurers are the main participants in the insurance sector (Grmanová & Strunz, 2017). The level of rivalry in this sector has increased with the current era of globalization. Efficiency is required given the environment’s intense competition. As a result, businesses should continually seek dynamic growth and evaluate their performance against that of other insurers (Çelen, 2013). Additionally, it is important to keep an eye on several other metrics. The metrics that characterize profitability are the most important.
Nevertheless, companies can lose out on their competitive edge in the best possible input-to-output conversion if their only focus is on the financial measures (such as assets, equity, and return on investment) as shown by the research in the past (Chen et al., 2015; Greene & Segal, 2004). To compare their performance to that of other companies in the sector, insurers are increasingly employing data envelopment analysis (DEA) to pinpoint activities that require improvement. Frontier efficiency methodologies are an essential new class of benchmarking techniques.
A firm’s performance to “best practice” frontiers established by the companies that employ the DEA in the sector is compared by the frontier methodologies. Conventional methods like financial ratio analysis are outperformed by the DEA measures because they apply a complex multidimensional framework to account for firm differences by condensing business performance into a single statistic. The DEA can be used to calculate the frontiers such as the evaluation of how successfully a corporation has used technology (technical efficiency), maximize profits (profit efficiency), maximized revenues (revenue efficiency), reached its ideal size (scale efficiency), and minimized expenses (cost efficiency) (Cummins, 1999).
To assess the effectiveness of Indian life insurance businesses, cost and profit efficiency analysis is used in this study. For a sample of all insurers that represent all of the sector’s assets, this study computes the cost and profit effectiveness. A productive feature that improves a firm’s competitive advantage, generates financial profit, transforms the input into output, and ultimately improves the performance of the entire company is termed “profit efficiency.” A significant part in performance might be played by improvement (Eling & Jia, 2019). Each industry’s level of impact is different, though. In terms of economy, as compared to others, technical efficiency might be more important to the viability of some industries (Greene & Segal, 2004).
To analyze how efficiency improvements may affect the sector, especially life insurance, which is typically managed by licensed organizations in most markets, an exclusive setting is offered by the insurance industry. The authority responsible for the regulation and growth of the insurance industry in India grants licenses. Emerging life insurance firms are a perfect example of how developed and emerging markets differ because of the stark differences in efficiency levels between them. However, emerging markets do not frequently employ efficiency measures for both profit efficiency (PE) and cost efficiency (CE).
According to the microeconomics optimization principle, businesses should employ current technology and knowledge to cut costs and increase profits. Long-term market eviction of non-optimized businesses is a result of competition (Cummins & Weiss, 2013). However, the reason why even inefficient businesses might endure over the long term, including weak management incentives, behavioral factors, and weak competition is explained through various notions (Stein, 1989).
As a result, efficiency measurements, such as data envelopment analysis (DEA), are used by managers and regulators (i.e., cost and profit efficiency). To evaluate performance optimization, they also test them against competitors in the industry. Locating production processes and units that are not producing in and of themselves is emphasized (Pasiouras & Gaganis, 2013; Shaddady, 2022). The lack of research on the profit efficiency of Indian life insurance businesses is what prompted this study to examine the cost and profit efficiency of the Indian life insurance market. This study’s goal is to examine the cost and profit efficiencies of the Indian life insurance business due to the paucity of literature on the subject.
In this way, the study is original and explicative. Efficiency analysis of life insurance is one of the disciplines with the quickest growth, with more than 100 peer-reviewed journal publications published in the last 10 years (Cummins & Weiss, 2013; Eling & Luhnen, 2010). However, according to Cummins and Zi (1998) and Greene and Segal (2004), there is no data regarding the profitability and cost-efficiency links in the Indian life insurance industry. With the following goals, our study seeks to close this gap in the body of knowledge:
to research Indian life insurers’ profitability and cost-effectiveness.
to investigate the impact of corporate attributes on the cost and profit effectiveness of life insurance firms.
Examining and assessing the effect of fixed characteristics on cost and profit efficacy further extends the existing research. The way Covid-19 affected the financial success of Indian life insurance businesses is also emphasized in the study. The cost and profit efficiency of public and private insurance companies are also empirically compared in this study, along with the profitability and cost-effectiveness of domestic insurance firms and joint ventures.
There are various sections to the current research. Following a description of the Indian life insurance market in Section 2, the existing relevant literature is reviewed. The methodologies employed for this investigation are described in Section 4. Data and factors from the survey are explained in Section 5. The findings of this investigation are reported in Section 6. Results and debates are in Section 7. The study’s implications and limitations are discussed in the concluding section.
Overview of Indian Life Insurance Industry
The premiums collected, the amount of money invested, the expenses incurred, the benefits received, the income from investments, and the profit made all play a role in how much the Indian life insurance market is worth. There are 24 life insurance companies in the Indian life insurance market. According to these criteria, the Indian life insurance market is currently in the following condition, as shown in Table 1: The premiums collected by Indian life insurance firms totaled Rs 5,730,000,000,000 in 2019–2020 and Rs 6,290,000,000 in 2020–21.
The Key Parameters of Indian Life Insurance Industry (in Rs Million).

Source. IRDA Annual Report, 2020–21.
The growth rate was 9.74% for insurers in the private sector, whereas premium income rose by 6.30% in the 2020–21 period for Life Insurance Corporation (LIC) which is a government-run life insurer. The market share for LIC decreased a little bit from 66.22% in 2019–20 to 64.14% in 2020–21 because private insurers’ share of the market increased from 33.78% to 35.86% in 2020–21. Between 1 April 2020 and 31 March 2021, the total capital of Indian life insurance firms was Rs 283,460 million. LIC did not raise its capital in 2020–21, but private life insurance companies did so by 2.58 billion rupees.
In 2020–21, the administrative expenses of Indian life insurance firms increased from Rs 913,140 million to Rs 944,160 million. Additionally, it has been noted that the overall commission for the life insurance industry has increased from Rs 311,920 million in 2019–20 to Rs 329,940 million in 2020–21. However, there was an increase from Rs 213,800 million in 2019–20 to Rs 221,710 million in 2020–21 in the total commission expenses for LIC.
In 2020–21, private life insurance companies will get total commissions of Rs 108,230 million, up from Rs 98,120 million in the previous year. There was an increase in operating costs from Rs. 601,210 million in 2019–20 to Rs. 614,220 million in 2020–21 in India’s life insurance industry. In 2020–2021, the LIC’s overall operating expenses will increase from Rs 345,680 million to Rs 349,890 million. Similar to this, a growth from Rs. 255,520 million in 2019–2020 to Rs. 264,320 million in 2020–21 was seen in the private sector operating costs as a whole.
Benefits are paid out by life insurance companies in a variety of ways, including terminal premiums, annuities, maturity, death, and surrender. The amount paid by Indian life insurance companies was Rs. 3,510,000,000 in 2019–20 and Rs. 3,990,000,000 in 2020–21. In 2020–21, benefits paid made up 63.42% of all premiums collected. In the fiscal year 2020–2021, the Private Life Insurance Companies paid benefits totaling Rs 1,136,500 million while the State Life Insurance Company, or “LIC,” paid benefits totaling Rs 2,860,000 million.
In contrast to the previous year, the state-owned life insurance company of India made investments that brought in Rs 2,790,000 million in 2020–2021. The gross investment income of private life insurers recovered from a loss of Rs 31,050 million the previous year and climbed to Rs 1,866,510 million in 2020–21.
India’s LIC paid a payout of $26,980 million in 2019–2020 even though the corporation has not yet announced its dividend for 2020–21. In contrast to the previous year, the private life insurers paid a dividend of Rs 6,520 million in 2020–21. However, compared to Rs 77,280 million in 2019–20, Indian life insurance companies reported an income revenue of Rs 86,610 million in 2020–21 after taxes. Only 18 of the 24 life insurer life insurers recorded profits in 2020–2021, according to the survey. In comparison to private life insurers as a whole, the State Life Insurance Company (LIC) declared a profit of Rs. 29,010 million for the 2020–2021 year (Insurance Regulatory & Development Authority, 2020–21).
Literature Review
Researchers have been interested in the Indian life insurance industry for many years and have looked into the technological capabilities of the companies (Anandarao et al., 2019; Dutta and Sengupta (2011); Siddiqui & Das, 2019; Sinha, 2015; Sinha & Chatterjee, 2011; Siddiqui, 2020a, 2020b, 2021a, 2021b). The productivity of insurance businesses in India has also been the subject of research (Parida and Acharya (2017); Chakraborty et al., 2012; Sinha, 2007; Siddiqui, 2021a, 2021b). The studies by Tone and Sahoo (2005), Chatterjee and Sinha (2009), Sinha (2012) also evaluated the cost-effectiveness of a small number of Indian life insurance providers.
The revenue efficiency of Indian life insurance firms was evaluated in a recent study (Bhatia & Mahendru, 2022). However, there is a research gap because no prior study has assessed the profit efficiency of Indian life insurance companies. This work closes this gap and adds to the body of knowledge. The profit efficiency of financial services is not well covered in the literature. The profit efficiency of non-life insurance companies has been the subject of some research (Jarraya & Bouri, 2014; Sinha, 2021). The profit efficiency of life insurance companies has been examined in several studies (Cummins, 1999; Cummins, Tennyson, et al., 1999, 2004; Cummins & Rubio-Misas, 2006, 2021; Cummins & Xie, 2008).
The DEA was used by Cummins et al. (2010) to evaluate the profit efficiency of life insurance companies. They calculated the US insurance industry’s cost, revenue, and profit efficiency from 1993 to 2006. Between 1994 and 2004, Hardwick et al. (2011) examined the impact of board features on the profit efficiency of UK life insurance companies. The board’s features have little bearing on the effectiveness of the organization as shown by the findings. Furthermore, profit efficiency had a concordant connection with company size and was inversely correlated with risk substitution as concluded.
From 2009 to 2013, Bian and Wang (2019) looked at the profit efficiency and cost-effectiveness of Chinese life insurance firms. They discovered that international life insurers were more economical than local life insurers. However, it was discovered that domestic life insurers were more profit-efficient in this case. The cost and profit efficiency of life insurance businesses in Indonesia from 2010 to 2014 was also examined by Wicaksono and Mulyaningsih (2019). The typical cost and profit efficiencies are 0.36 and 0.52, respectively as concluded by them.
Additionally, in contrast to joint venture insurers, domestic insurers were more cost-effective as shown by the study. The joint venture insurers were more profit-efficient according to their research. Rubio-Misas (2022) analyses the factors that led to the synchronization of bancassurance with different distribution channels and projects the profit and cost efficiency of life insurance companies through time in Spain. In contrast to distribution channels, which do not affect profit efficiency, the study indicated that the banking channel boosts cost efficiency.
Research Methodology
Efficiency was evaluated using cutting-edge boundary analysis (Cooper et al., 2004). This methodology compares each company’s performance to “best practice” efficiency standards made up of the leading businesses in the sector. Scores for efficiency vary from 0 to 1. For Indian life insurance firms, an efficiency score of 1 indicates an efficient unit, whereas a score of less than 1 indicates an inefficient business. Technical Efficiency (TE) is the ratio of the input that a company uses to create the same output vector at maximum efficiency to the input that the target firm consumes.
Scale efficiency (SE) and pure technical efficiency (PTE) are the ingredients that make up technical efficiency. PTE stands for efficiency against Variable Returns to Scale (VRS) constraints, and SE stands for the separation between VRS and CRS boundaries. Later, to calculate cost, revenue, and profit effectiveness using different input/output combinations at each price, the DEA was changed (Fried et al., 2008).
Cost Efficiency (CE)
According to Färe and Grosskopf (1997), the cost efficiency of a specific life insurer is defined as the difference between its actual costs and those of a perfectly efficient life insurer generating the same volume at the same input price.
Suppose, a vector of p inputs


The answer

The most effective life insurance provider in the sample has a cost efficiency score of 1, which is in the range of 0 to 1.
Profit Efficiency (PE)
To describe the ideal and real profits made by life insurance businesses, profit efficiency is the term used. If they were 100% efficient, this profit is what these companies would have made. Profit efficiency is a highly helpful strategy because maximizing profit is every life insurance company’s main objective. The net result of a life insurance company’s cost and revenue efficiency is shown by its profit efficiency. To identify the root causes of inefficiencies, cost efficiency and revenue efficiency must be analyzed independently. Profit efficiency assesses how closely life insurers get to realizing the maximum profit for a given set of cost levels, inputs, and outputs. The linear programing model created by Färe and Grosskopf (1997) and Färe et al. (2004) can be used to evaluate the profit efficiency of life insurer j, as shown below:


The output vector
The profit effectiveness for the life insurer j (PEj) can be determined using the equation shown below:

The deaR program developed by Serrano et al. (2018) was used to calculate the cost efficiency and profit efficiency estimations for this investigation. The impact of significant characteristics unique to life insurers on the cost and profit efficiencies of the insurance company was examined using the Tobit regression.
Data and Variables
The Insurance Regulatory and Development Authority of India (IRDAI) manuals and annual reports were used in the study to gather data for the years 2017 through 2021. All 24 life insurance firms’ data were compiled; 23 of them were private and one was a state life insurance business. Like other studies in the financial services industry, the data for this study is restricted to information provided by insurers under the IRDAI. Moreover, financial services associated with claims, risk pooling and underwriting services, and brokerage services provide benefits to insurers as identified by this study (Cummins et al., 2017).
Benefits provided by insurers, or the value of acquired remunerations and their distribution to provisions, are a strong measure of the degree of risk pooling (Rubio-Misas, 2022; Siddiqui, 2021b). The value of the invested assets serves as a proxy for the intermediary function. Operating costs, equity, and liabilities are the study’s input factors. On the other hand, accrued earnings as well as increases in reserves and invested assets are included in the output variables. The distribution between accumulated benefits and reserves that determines the price of insurance benefits is denoted as = (P-IB)/IB, where P stands for the premium. IB stands for reserves plus accumulated benefits. On the other hand, the price of invested assets (r2) was calculated using the net investment return to invested assets ratio (Rubio-Misas, 2022).
The current analysis, like earlier ones (Fenn et al., 2008), substituted operating costs for personnel, material, and commercial service. According to Rubio-Misas (2022), the operating cost (
Variables Used in the Cost, Revenue and Profit Efficiency Estimation (Amount in Rupees Million).

Source. Authors’ calculation.
Results and Discussion
The experimental findings of this research are presented and discussed in this part of the paper. The research tries to show how firm factors affect the expenses and profitability effectiveness of Indian life insurance businesses.
Cost and Profit Efficiency
Figure 1 depicts the expenditure and profitability performance trajectory of the Indian life insurance industry. Table 3 lists the projected expenses and profitability of the Indian life insurance sector. Indian life insurers squander almost 28% of their expenditures as opposed to the most effective life insurance companies, according to the research’s aggregate cost-effectiveness index of 0.7213. Throughout the research interval, the average cost-effectiveness for the Indian life insurance business varied from 0.5963 to 0.7869. These outcomes are in line with what was previously documented in the research.

Cost and profit efficiency of Indian life insurance sector.
Cost and Profit Efficiency Scores of Indian Life Insurance Industry.

Source. Author calculated.
According to Cummins and Rubio-Misas’s research from 2022, the mean cost-effectiveness for 10 European countries was between 0.8 and 1. Comparably, research on the cost-effectiveness of a few Indian life insurance firms between 2002 and 2010 indicated that the cost-effectiveness varied from 0.4 to 1 (Chatterjee & Sinha, 2009; Sinha, 2012; Tone & Sahoo, 2005). Table 4 presents the company-specific cost-effectiveness projections, which are visually displayed in Figure 2.
Estimates of Cost Efficiency (2017–21).

Source. Authors’ calculation.
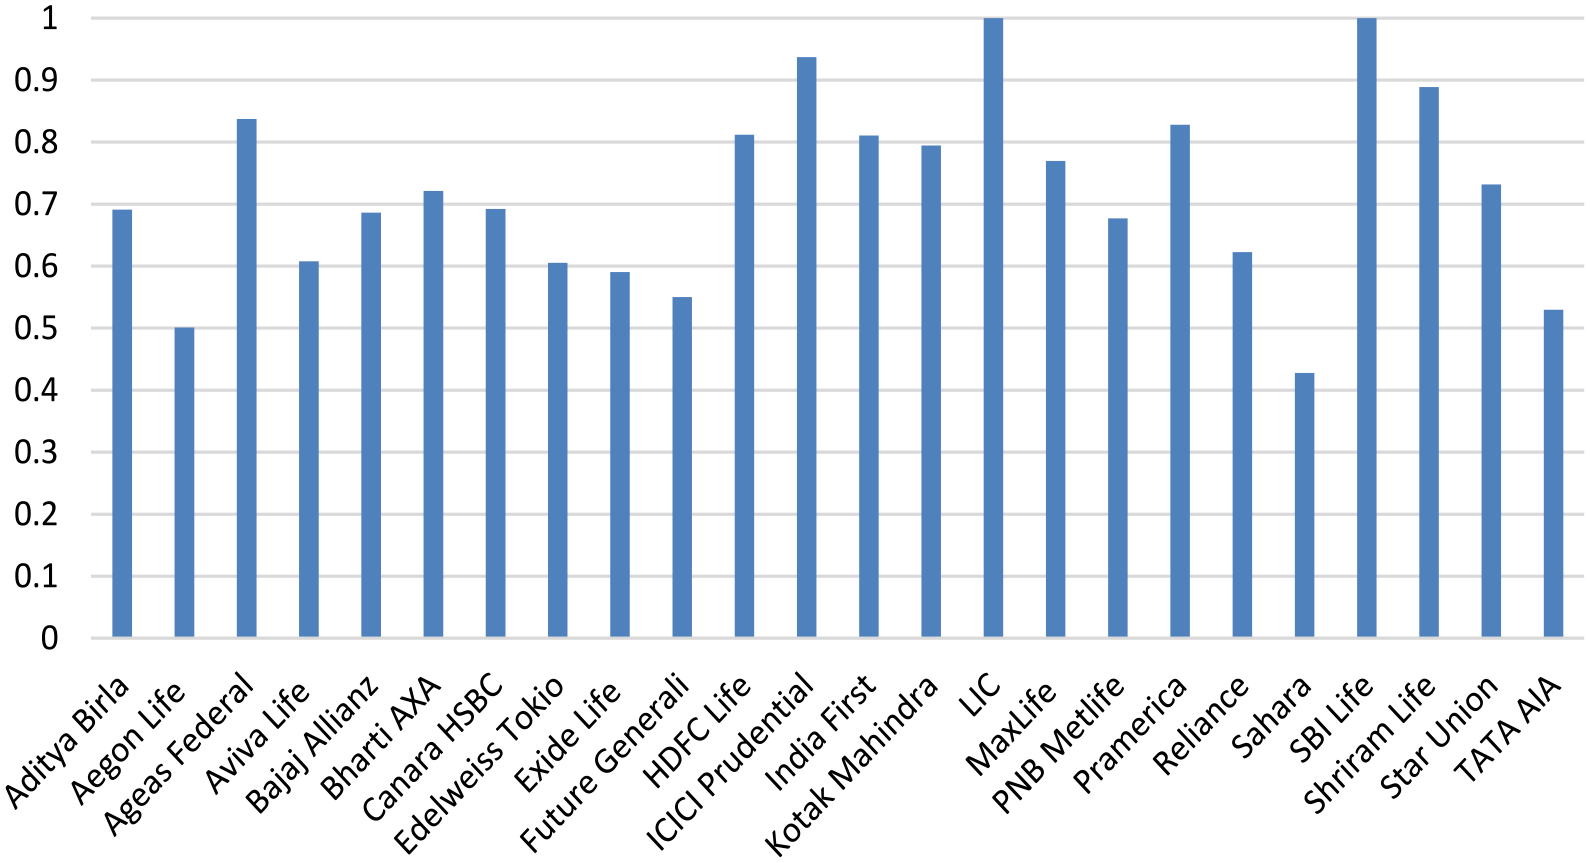
Cost efficiency scores of Indian life insurers (2017–2022).
Throughout the research, consortium life insurance companies proved to be generally more cost-effective (0.7249) than standard life insurance firms (0.7032). These results are consistent with those of the prior research (Ariff & Can, 2008). Compared to the government’s life insurance business, LIC, which maintained total cost-effectiveness during the research duration following prior research, private life insurance companies had a mean cost efficiency rating of 0.7092 (Chatterjee & Sinha, 2009; Sinha, 2012; Tone & Sahoo, 2005).
Shriram Life, Pramerica, and Edelweiss Tokyo are private life insurance providers; they were completely cost-effective in years 4, 3, and 1 of the research period. LIC, a public limited company and SBI Life, a privately owned insurance company, both maintained complete cost-effectiveness over the research considering the cost-effectiveness rating of all life insurance firms in India.
Having a value of 0.4277, Sahara life insurance was the least cost-effective throughout the research. The cost-effectiveness of Indian life insurance firms was, on standard, 72.13%, with the least cost-effectiveness recorded in the year 2020 (59.63%) and the maximum cost-effectiveness was noticed in the year 2017 (78.69%) with a range of 7.83% during the entire research.
According to a profitability effectiveness rating of 0.3138, life insurance companies only make around one-third as much money as companies who follow standard procedures. Indian life insurance companies’ profitability numbers are not higher than their cost-effectiveness findings. These findings are in line with what has already been documented in the research (Ariff & Can, 2008; Bian & Wang, 2019; Cummins et al., 2010). The comparison at a national scale is not possible because this research is the initial attempt to evaluate the profit-efficiency of life insurance businesses in India.
Joint venture life insurance companies were discovered to be less profit-efficient in general (0.2958) than conventional life insurance companies (0.4041). The profit efficiency score for the private life insurance businesses was 0.2840. Both the public sector life insurance company LIC and the privately owned life insurance company SBI Life were completely profit-efficient across the duration of the research.
In the fourth, third, and first year of the research, private life insurance firms, Shriram Life, Pramerica, and Edelweiss Tokyo remained profitable. Considering a value of 0.0474, Canara HSBC OBC Life had the lowest profit efficiency throughout the research period. The mean profit performance of Indian life insurance firms was 31.38%, ranging from 0.2025 in 2021 to 0.3741 in 2020, with a variability of 6.5% during the entire research. The projections of the company-wise profitability are displayed in Figure 3 and provided in Table 5.

Profit efficiency scores of Indian life insurers (2017–2022).
Estimates of Profit Efficiency (2017–21).

Nexus of Firm Characteristics With Cost and Profit Efficiency
Considering all Indian life insurance businesses, expense and profitability efficiency ratings have been computed as part of the present research. The next phase has been an analysis of firm-related factors that affect the expense and return effectiveness of a life insurance company. Since the efficacy numbers vary between 0 and 1, the present research additionally employed the Tobit regression, like most of the prior research (Rubio-Misas, 2022; Siddiqui, 2022).
The cost/profit efficiencies of life insurance businesses are employed as contingent factors. The size of the company (natural log of fixed assets), the ratio of solvency (the percentage of equity capital to total assets), the claims ratio (the proportion of claims to total premiums), and the ownership arrangement (dummy, 1 for public insurance firms, 0 for private life insurance companies). Following in the wake of prior research (Ariff & Can, 2008; Chakraborty et al., 2012; Siddiqui, 2022), the distribution ratio (percentage of the compensation received to the sum of the expenses spent) and market share (a percentage in all premiums issued) were selected as independent factors in this analysis. Here is a display of the calculated Tobit regression model.
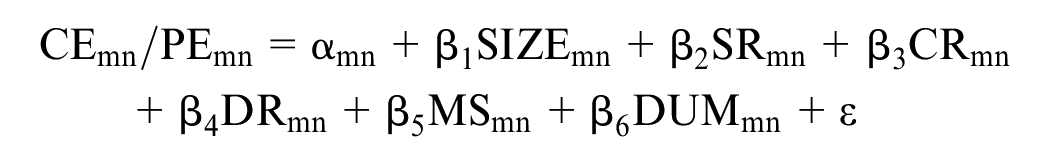
Where CE/PE stands for costs and profit efficiency at varying yields of return, m stands for the life insurance companies, and n for the number of years. The parameters are α, β1, β2, β3, β4, β5, and β6. SR stands for Solvency Ratio, CR for Claims Ratio, DR for Distribution Ratio, MS for Market Share, Dummy for Ownership Structure, and ε for Error Term.
The results of Tables 6 and 7 reveal that four of the six explicating factors are statistically important. The R version 3.6 AER software (Kleiber & Zeileis, 2008) is used for computing Tobit regression. The coefficients are used to examine the connections between modifications to expenses and earnings efficiency and the independent determinants. The claim ratio has a favorable and substantial impact at the 1% significance threshold on the expenses and profit effectiveness of Indian life insurance firms. This demonstrates unequivocally the expenses and profit-effectiveness of life insurance firms with high claims percentages.
Coefficient Estimates from Tobit Regression and Pooled Regression Using Firm Characteristics: Dependent Variable – Cost Efficiency Scores under VRS (2017–2022) Observations = 120.

Note. Signif. codes: ***.001. **.01. *.1.
Coefficient Estimates From Tobit Regression and Pooled Regression Using Firm Characteristics: Dependent Variable – Profit Efficiency Scores Under VRS (2017–2022) Observations = 120.

Note. Signif. codes: ***.001. **.01. *.1.
Both Cummins et al. (1996) and Chakraborty et al. (2012) discovered that life insurance businesses are more practically effective when their claims percentage is significant. Because of the advantageous and substantial coefficient, the market share of life insurance firms has a beneficial impact on cost-effectiveness. This implies that because of their existing systems, life insurance firms with larger market shares tend to be more cost-effective.
The results of Chakraborty et al. (2012), nevertheless, showed that size had a detrimental influence on the technical effectiveness of life insurance firms. Since the value of the coefficient is favorable and substantial at the 10% level, the form of ownership (Public/Private) has a bearing on both expense and profitability efficiency. Given that the value of the coefficient is beneficial and substantial at the 1% threshold of importance, the distribution ratio has a favorable impact on profit efficiency. In their research, Cummins et al. (1996) and Chakraborty et al. (2012) similarly discovered that the distribution ratio had a favorable impact on the technological efficacy of life insurance providers.
Conclusions
In 2020, India allowed international insurance providers to work in partnership with Indian insurance companies. Also, it permitted insurance firms to increase capital via the stock market and other venues. Numerous studies have been done on the effects of technical efficacy, deregulation and company traits on insurers. According to the present research, none of the research has looked at the profitability and cost-effectiveness of the Indian life insurance market. The shortcomings in the prior research are addressed in the current study. The information gathered using the envelope analysis technique is used in the present research to assess the expense and profitability efficacy of every life insurance firm operating in India from 2017 to 2021. The ownership structure and size of the 24 insurance firms studied in this study vary.
The findings of this study are consistent with earlier research on the effectiveness and traits of life insurance companies. The initial result of the research reveals that life insurance providers’ profit efficiency is considerably less compared to their cost-effectiveness. Furthermore, local life insurance firms are shown to be more profit-effective than joint life insurance firms, but joint life insurance firms are more cost-efficient. Finally, just two life insurance firms SBI Life (private) and LIC (public) maintained complete cost and profit efficacy throughout the research duration. The profit efficiency of Indian life insurance firms decreased with time, from 0.3324 in 2017 to 0.2025 in 2021. Likewise, cost-effectiveness is also decreased over time, from 0.7869 in 2017 to 0.6950 in 2021. This could be the result of Covid’s influence on Indian life insurance firms.
Tobit regression was employed in the present research to examine how business factors affect the profitability and cost-effectiveness of Indian life insurance firms. The findings indicate that higher claims proportion life insurance firms tend to be more cost and profit effective. The ownership structure also has an impact on the profitability and cost-effectiveness of life insurance companies. It has been noted that life insurance firms with a greater distribution ratio are more profit-efficient. Conversely, life insurance companies with larger market shares prove to be more cost-effective. The life insurance companies that maintained cost and profit efficiency throughout the research term were Life Insurance Corporation of India and SBI Life. The results offer “IRDA,” the industry regulator, as well as the life insurance firms who work in India’s life insurance market, a wealth of new information.
Implications and Limitations of Study
Throughout the research duration, the market shares of public and private life insurance companies stayed largely stable. The study will help decision-makers, legislators, and other life insurance company stakeholders make more informed choices. On the other hand, by enhancing their claims proportion, distribution proportion, and market share via partnerships and aggressive advertising methods, life insurance providers can increase cost and profit efficiency. The management of ineffective life insurance firms can speed up efforts to boost profit through the greater utilization of the resources at hand.
To boost the revenue of this industry, the regulatory body “IRDA” can develop regulations that include the needs of policyholders. Ineffective life insurance companies ought to restrict production rate aberrations from the optimal production threshold and encourage the adoption of innovative technologies that minimize the number of resources needed to produce the necessary production. India’s life insurance industry is one of the nation’s most adaptable and quickly expanding industries.
The research’s data comes from the Indian Life Insurance Regulatory Authority (“IRDA”) and is contingent upon the applicable life insurance companies’ statements. The expense and profitability effectiveness of Indian life insurance companies has been evaluated in this research using data envelopment analysis.
Like other methodologies, data envelope analysis has restrictions and disadvantages. The DEA lacks discriminatory ability when the quantity of DMUs is low in comparison with the number of factors, is susceptible to outliers and noisy data, is impacted by data that is unavailable and is susceptible to outliers. When gathering the data for this research, several problems were addressed. The lack of a method for assessing the choice of input and output factors objectively is a further limitation. Input and output parameters for the present research were chosen based on existing and well-recognized publications.
An additional problem is the homogeneity of the reported DMUs, which could occasionally not be the case. Since all companies are involved in the life insurance industry, it is not relevant to our research. A further drawback is that while DEA can offer suggestions for enhancement and standards, it does not give companies any information on the expense, challenges, or period needed to implement those procedures (Villa & Lozano, 2020).
Footnotes
Acknowledgements
Authors are grateful to the anonymous referees and editor of the journal for their extremely useful suggestions to improve the quality of the article. The usual disclaimers apply.
Declaration of Conflicting Interests
The author(s) declared no potential conflicts of interest with respect to the research, authorship, and/or publication of this article.
Funding
The author(s) received no financial support for the research, authorship, and/or publication of this article.
Ethics Statement
This study does not involve any animal or human being.