
Abstract
China’s GEM (Growth Enterprise Market, also named as ChiNext stock market) enterprises are mainly small and medium-sized enterprises in the start-up stage, which have high-speed growth. This work uses three-stage least squares (3SLS) based on combines system equation to study the impact of technological innovation investment, executive incentive, and enterprise financial performance. The results show that in China’s GEM enterprises, R&D in the current period positively affects financial performance in 1% significance level. R&D of the lag period has a significant negative impact on the financial performance of the current period. Conversely, the financial performance of the current period has a significant negative impact on R&D. While both salary incentive and equity incentive will improve financial performance, executives seem to value short-term interests MORE. Executive equity incentive has a significant negative moderating effect ownership due to ownership structure in GEM is needed to strengthen the control right. This work proposes a new research horizon in GEM in China, and can help the GEM design an effective management mechanism to improve the financial performance of the enterprise.
Keywords
Introduction
GEM (Growth Enterprise Market, also named as ChiNext stock market) market serves small and medium-sized enterprises in China. Compared with the main-board markets in Beijing and Shanghai, the main body of GEM is growth enterprises, especially science and technology entrepreneurial start-up (Martin & Wang, 2015; Yi et al., 2021). GEM is an important supplement to China’s main board market in Shanghai and Shenzhen. In China, its stock code starts with “300.” GEM is characterized by low threshold, high risk and strict supervision. Its purpose is to encourage the development of entrepreneurial start-up (Gui et al., 2022) and realize the independent innovation strategy of domestic enterprises.
On October 23, 2009, the China GEM held the commence ceremony (Yi et al., 2021). On October 30, 2009, the GEM was officially started, which has gone through 12 years up to now. It can be seen from Table 1 that China’s GEM enterprises number have reached 1090, with a total market value of 2057.2 billion USD and a daily turnover of 35.2 billion USD (Shenzhen Stock Exchange, 2022). GEM has become a favorable promoter to integrate of traditional industries with new technologies, new industries, and new commercial mode (Martin & Wang, 2015). Representative enterprises in GEM include Tongyu Heavy Industry Co., Ltd. (300185), Cixing Co., Ltd. (300307), Risen Energy Co., Ltd. (300118), AIer Eye Hospital (300015), Zhenxin Technology (300101), Gao Meng New Materials Co., Ltd. (300200), etc.
Transactions of Chinese GEM Enterprises by 2021.

Source. Shenzhen Stock Exchange.
In this work, we collect data on GEM R&D expenses from 2016 to 2021. The results are obtained from the average annual R&D expenditure from 451 valid samples. From Figure 1, we find a noticeable phenomenon: the annual R&D expenses is very striking. At the same time, the year-on-year growth shows an obvious trend. This may be due to the characteristics of this sector: GEM enterprises need a lot of R&D expenditure. The above rapid growth has attracted the interest of researchers: What are the consequences of the rapid growth of GEM R&D expense? What factors influence the growth of GEM R&D funds? These issues need to be discussed in depth.

Change of GEM R&D expenses from 2016 to 2021.
The advantages and disadvantages of R&D expenses on financial performance are widely discussed topics. While some scholars believe that R&D expenditure has a positive effect (Vanderpal 2015; N. Wang et al., 2017), the other empirical evidence shows R&D expenditure has a long cycle, high risks and uncertain future returns (Huang et al., 2014; Kim et al., 2016; Saliba et al., 2018). When this controversial topic is introduced into GEM, it becomes more highlighted. Due to the characteristics of high risk and return of GEM enterprises (S. N. Xu et al., 2011), whether to increase the current period R&D investment has become the focus of researchers.
Generally speaking, innovation advantages include core competitiveness of enterprises. Innovation is fundamental for the future sustainable development of enterprises (Acemoglu et al., 2018). The progressing of entrepreneurial global economic integration intensifies the competition among enterprises all over the world, and the key factor for the success of enterprise is technological innovation (Hitt et al., 1997).
On the other hand, the disadvantage of R&D activities is that they may incur uncertainty and risk. The smooth implementation of this technological innovation strategy must be backed by a large amount of R&D funds, especially for high-tech enterprises (Chan et al., 1990). Regarding GEM, a large amount of R&D investment is a crucial management decision, which needs to be evaluated based on financial performance. So whether innovative activities can bring about future profit growth still needs to be explored.
The R&D process of enterprises is relatively long-term process. In the relatively long-term process, there will be interference from financial, resource, human and other factors. Among these factors, senior executives play the most important role. As the leading force in enterprise operation, senior managers determine the direction and goal of enterprise operation. The attitude of senior managers will directly affect the success of technological innovation (Miao et al., 2018). So the influence of senior managers related to the association between the R&D investment and financial performance is strongly highlighted. In the reality, senior executives often fall into a dilemma when involving in R&D activity.
On the one hand, managers’ income mainly depends on short-term financial operation performance (Bennett et al., 2017). The new R&D plan will reduce the current cash flow of operating activities and affect the financial net profit margin. On the other, the new R&D plan will improve the future value of the company and enhance shareholders’ equity (Vanderpal, 2015). In order to solve the short-term choice of executives, a sound incentive system must be designed. An effective incentive mechanism is the key to ensure the managers to facilitate innovation activities (X. L. Xu et al., 2020). The implementation of the mechanism, including salary incentive and equity incentive for executives, will directly reduce their short-sighted behavior and departmentalism. In order to reduce the supervision cost of equity owners, the company also can carry out incentive plans to achieve the convergence interests between the management and shareholders (X. L. Xu et al., 2019). This incentive plan can guarantee the supply of technological innovation resources, further improve the enterprise’s technological R&D ability, and finally improve enterprise financial performance (C. Cheng, 2018). Therefore, the impact of executives incentive on GEM’s innovation activities needs to be studied. And a incentive system needs to be designed through research conclusions.
This work has several contributions to the existing literature. First, based on endogenous considerations, this work studies the bidirectional relationship between R&D investment and financial performance. Compared with previous studies, a large number of literature discussed the one-way relationship between R&D investment and financial performance. This work reveals the two-way relationship between them in different time period through the method of Three-Stage Least Squares (3SLS). Furthermore, in the test of R&D expense, executive incentive and financial performance in GEM, this work adopts OLS and 3SLS estimation methods simultaneously. Through result comparison, it is found that the 3SLS method is more robust and reliable under the premise of endogenous. At the same time, this work absorbs more control variables in the analysis, so that the conclusions of the analysis are more accurate. Finally, this work finds that equity incentive plays a negative role in GEM. The research gap lies in a large number of literature discuss the advantages of equity incentive, but ignore the disadvantages of equity dilution of start-ups in GEM. This paper proposes the negative effects and underlying reasons of equity incentive in GEM. The rest of this study is organized as follows. Section 2 puts forward the literature review, and Section 3 presents the research method, data sources and variables. Section 4 presents the empirical analysis while the last section concludes and makes suggestions.
Literature Review and Research Hypothesis
At present, the research on the relationship between executive compensation incentive, technological innovation and enterprise financial performance at home and abroad mainly included in the following three aspects.
Technological Innovation and Enterprise Financial Performance
There are abundant literatures on the relationship between technological innovation strategy and enterprise financial performance. Some scholars focus on the relationship between R&D activities and corporate profitability (Artz et al., 2010; Bigliardi, 2013; Saliba et al., 2018). The other part focuses on the impact of R&D activities on the value of the company (Connolly & Hirschey, 2005; Parcharidis & Varsakelis, 2010; Sofronas et al., 2020). Most studies showed that R&D activities had a positive relationship with profitability and corporate value. Zhang (2018) argued that if enterprises want to improve their core competitiveness and enterprise market value, technological innovation strategy must be carried out. Qin et al. (2019) found that technological innovation had a partialing effect on ownership structure and enterprise financial performance. However, some scholars have advised opposite conclusion. Since R&D activity is a long-term return, it increases the uncertainty of enterprises (Saliba et al., 2018). Enterprises engaged in R&D bear high risks and the failure may be a fatal to small and medium-sized enterprises. R&D expenditure is a competition that may harm the financial performance of enterprises (Kim et al., 2016).
For example, Huang et al. (2014) conducted econometric analysis on the R&D investment and corporate performance of agricultural listed companies using the individual random effects model. The econometric analysis results showed that the positive impact of R&D investment on corporate financial performance was not significant. On the contrary, there was a weak negative impact on financial performance.
In our work, enterprises listed on the GEM are more dependent on R&D than those listed on the main board (Li & Hou, 2019). Therefore, technological innovation is particularly important for GEM enterprises. Through regression analysis of technological innovation input and profitability, some scholars found that there was a positive causal relationship between technological innovation input and profitability of high-tech enterprises (Liang & Zhang, 2005). Moreover, the greater the R&D investment, the higher the financial performance of the enterprise (Liang & Zhang, 2005; N. Wang et al., 2017). At the same time, there was an inverted U-shaped relationship between the sustainability of technological innovation and corporate financial performance (He & Zhang, 2017). Similar research evidence has also been found in other industries. J. M. Xu et al. (2018) concluded a significant positive correlation between low-carbon R&D investment and financial performance of equipment manufacturing enterprises.
Based on the previous research, this study makes the following assumptions:
H1: R&D investment has a significant positive correlation with enterprise financial performance.
Executives Incentive and Enterprise Financial Performance
The word motivation comes from Latin (Movere), which originally means to promote or advance. In modern enterprise organizations, leaders, or managers of enterprises often carry out targeted promotion plans for employees according to organizational goals, so as to generate motivation and achieve the expected goals. The achievements of the traditional incentive theory school have been very plentiful, such as Taylor Theory (Peaucelle, 2000), which emphasizes differential pricing reward; Hawthorne Experiment led by Mayo (Önday, 2016), which found the existence of informal organizations; the opposite XY Theory proposed by McGregor (1985) in his book The human side of enterprise.
At present, with the establishment of modern enterprise system, the incentive content within the enterprise is constantly changing, and the incentive theory is also continuously innovating and developing. For instance, the five-level demand theory of physiology, safety, society, respect, and self-realization (Maslow, 2007); two factor theory of motivation and healthcare factors (Herzberg et al., 2009), which explains the reasons for job satisfaction and dissatisfaction. Skinner Theory, emphasizing that human behavior is affected by past results and highlighting the role of enhancement, avoidance, punishment and fade out (Xie, 2003). Previous incentive theories provided a lot of research basis, and all emphasize the importance and methods of motivating employees in the organization. In GEM, senior managers play a leading role in Chinese organizational culture. So the incentive of senior managers is imperative to the whole company.
In GEM in China, enterprises are at a stage of rapid growth. As entrepreneurial and start-up enterprises, most of GEM are high-tech SMEs. Therefore, it is necessary to study the relationship between executive incentive and financial performance. As a result, these high-tech SMEs can becoming a formal main board listed company. In terms of the relationship between salary incentive and enterprise performance: Abowd (1990) conducted a study on the relationship between executive compensation and corporate financial performance, showing that executive compensation had a significant positive correlation with stock returns.
J. C. Sun et al. (2019) believed that the executive payroll gap can affect the power of the management, and the improvement of the management power will in turn widen the executive payroll gap. The widening salary gap with the different hierarchy staffs can stimulate the motivation of executives, which will eventually increase the financial performance of the enterprise. So the listed companies can increase the actual monetary compensation of executives to increase the loyalty, so as to improve their work efficiency, and finally improve the financial performance (Demirer & Yuan, 2013; Mehran, 1995).
On the other hand, there are many works supporting the relationship between equity incentive and enterprise performance: Listed companies usually implement equity incentive plans to align the interests of both parties (C. H. Wang et al., 2021). Because the stock value held by senior executives is closely related to the performance of the enterprise. In the medium and long term of enterprise development, equity incentive is more effective than cash incentive (Q. Cheng & Warfield, 2005). The shareholding makes them more loyal to the company and exert more effort on the work (Tchistyi et al., 2011). The literature showed that compensation and equity incentive both had a significant positive impact on corporate financial performance.
Based on the above literature, this study proposes the following assumptions:
H2a: Executive compensation incentive has a significant positive correlation with enterprise financial performance.
H2b: Executive equity incentive has a significant positive correlation with enterprise financial performance.
Moderating Effect of Executive Incentive on R&D Investment and Enterprise Financial Performance
In the operation of enterprises, the relationship between the two variables may be affected by other factors. This is indeed the case in the relationship between R&D investment and enterprise financial performance. The agent theory holds that once there is information asymmetry between the principal and the agent, the principal will sign a series of contracts with them in order to prevent the agent’s moral hazard and adverse action selection (Jensen & Meckling, 1976). In this theory, agency cost includes three aspects: supervision cost, guarantee cost, and residual loss. The first two are the costs actually incurred in the operation of the enterprise, and the third is the opportunity cost. In order to ensure that managers work with the interests of owners and reduce agency costs, appropriate incentive contracts are necessary (C. H. Wang et al., 2021).
On the other hand, the business operation will face fierce competition and uncertainty of the environment, senior managers may take risk aversion to technological innovation on behalf of their interests (Guan & Zhang, 2020; Xi & Zhang, 2021). According to agency theory, the most important game is the asymmetry of information (Joura et al., 2021). The management may start from their own selfish perspective, and choose non-corporate value maximization (Van Dun et al., 2017). In China’s compensation system, owners often assess the ability of senior managers through year-end bonus (Yao, 1997). The amount of the bonus depends on the company’s sales achievement rate, annual plan completion rate, PKI completion rate, etc. As it is known to all, investment innovation mainly focuses on long-term returns, and it maybe harmful to short-term returns (Crowley & Jane, 2018). That is, managers will reduce the R&D expenses and operating costs of the current period, in order to improve the profit level (X. L. Xu et al., 2020).
These shortsighted behaviors are extremely harmful to the sustainable development of enterprises, so effective measures must be taken to eliminate these action. Then the resources of technological innovation can be guaranteed, and finally the performance can be improved (Kato et al., 2007). Zhang et al. (2014) believed that Chinese information technology enterprises can design effective senior executives salary management system. Through this system, the company could reduce their risk aversion behavior, ensure the process of technological innovation, and finally promote the further financial performance. It can be seen that executives, as the key figures of the enterprise and an integral part of the core labor force, will play a positive transitional role. Executive incentive not only can promote enterprise financial performance directly, but also have a moderating effect through innovation activity to financial performance (Guo et al., 2019).
Excellent incentive measures can alleviate agency and management defense (X. L. Xu et al., 2020), so that managers can pay more attention to innovation and development (Crowley & Jane, 2018). Equity incentive enables management to focus on long-term goals and guide senior executives to promote innovation activities (Miller et al., 2002). The implementation of equity incentive can encourage managers to carry out innovative activities and drive the interests of management to be the same as those of shareholders (X. L. Xu et al., 2020; Zahra et al., 2000). Senior executives can incentive the enthusiasm of the overall employees, integrated the company’s resources, and improve the company’s performance to the greatest extent.
Based on this, this study proposes the following assumptions:
H3a: Executive compensation incentive plays a positive moderating role in R&D investment and enterprise financial performance.
H3b: Executive equity incentive plays a positive moderating role in R&D investment and enterprise financial performance.
Research Design
Sample Selection and Data Source
GEM listed companies are generally abundant in high-tech enterprises, who pay more attention to technological innovation and have high growth in their operation progress. Therefore, this work selects the companies listed on GEM in 2016 to 2021 as the research sample, excluding companies with missing data and abnormal data. Finally, 451 companies remind for the next analysis. Among them, the return on equity, R&D investment, total remuneration of top three executives, total assets, growth rate of operating revenue and asset liability ratio, and other indicators are mainly provided by WIND database.
Variable Quantity Selection and Definition
Explained Variables
The financial performance is a traditional research topic (Kaplan & Norton, 1996; Plumlee et al., 2015; Solomons, 1965; Stern et al., 1995). At the same time, famous measurement standard proposed by DuPont (DuPont analysis) also use return on net assets (ROE) as the core indicator (Burja & Mărginean, 2014). Academic circles generally believe that this index can systematically and comprehensively reflect the profitability of enterprises, and can be used to evaluate the profitability of companies. Therefore, this work selects the rate of return on equity (ROE) to measure the financial performance of enterprises. It is the ratio of profit after tax to owner’s equity. The ratio reflects the profitability of owner’s equity. This indicator can measure the efficiency of enterprises in using their own capital, and is widely used in literature measuring the financial performance (C. H. Wang et al., 2021; Xing et al., 2014). The higher the ratio, the stronger the profitability of enterprises. Refer to a number of domestic scholars (Tong & Wei, 2021; S. N. Xu et al., 2011), this study uses ROE to measure the financial performance of GEM.
Explanatory Variables
The index of R&D investment can scientifically and reasonably reflect the actual effect of technological innovation strategy. Generally, scholars will use R&D investment (Erdogan & Yamaltdinova, 2019) to measure the innovation. Moreover, it is more reasonable to replace R&D expenditure with R&D density in order to avoid the impact of the size of enterprises. Drawing on previous literature (Chauvin & Hirschey, 1993; J. M. Liu & Zhou, 2018; Shih, 2008), this paper measures R&D density through dividing R&D expenditure by the net amount of sales revenue in the current year. The indicators of R&D density can make enterprises of different sizes horizontally comparable. Therefore, this work selects R&D investment density (RDD) as the explanatory variable.
Moderating Variables
Because salary of senior executives (SAL) plays a moderating role between technological innovation strategy and enterprise financial performance, this work chooses it as the moderating variables of this model. “Total compensation of top three executives” (Quan et al., 2010; Z. J. Wang & Mai, 2019; Zou et al., 2015) can better reflect executive compensation incentive (SAL). Based on previous literature (Q. Cheng & Warfield, 2005; Tchistyi et al., 2011), equity incentive is also an important influence variable. Equity incentive plan (EQ_INC) can motivate CEO to promote R&D process (Miller et al.,2002; Zahra et al., 2000). Therefore, this work selects these two incentive factors as the moderate variable.
Control Variables
On the basis of existing relevant literature (Andersen & Dejoy, 2011; Hu, 2015; Jin, 2021; J. M. Liu & Zhou, 2018; C. H. Wang et al., 2021; X. L. Xu et al., 2020), eight variables are selected as control variables: the natural logarithm of total asset (SIZE) reflecting enterprise size; financial leverage (LEV) reflecting solvency; growth of operating income (GROWTH) reflecting growth; Equity concentration (EQ_CON) reflecting the concentration of common shares issued outward; Equity balances (EQ_BAL) reflecting appropriate control rights in the company; Cash flow (CF) reflecting the financial flexibility of the enterprise; The integration of the two positions (DUAL) reflecting the internal governance structure of the enterprise; The proportion of technicians (TECH) reflecting the allocation of human resources in enterprises.
The specific variable definition and sources are shown in Table 2.
Variable Names and Definitions.

Model Design
According to the previous theoretical analysis and research assumptions, the following three models are constructed to test the relationship.


The model (1)/(2) is used for the relationship between RDD and ROE to verify Hypothesis 1.
In addition, in order to test the moderating effect of SAL/EQ_INC between RDD and ROE, model (3) adds the cross term (RDI × SAL/RDI × EQ_INC) on the basis of model (1) and model (2).
Cross items used to verify Hypothesis 3a/3b.
If the cross term is significant in statistics, it shows that SAL/EQ_INC has a moderating effect on RDD and ROE.
Empirical Analysis
Descriptive Statistical Analysis
Descriptive analysis generally shows the basic data fluctuation and distribution. This study used Stata to carry out descriptive statistics, and the specific results are shown in Table 3. In order to reduce the impact of extreme values before data analysis, the data shall be shrunk by 1%. The variables SAL and SIZE use the natural logarithm of their original values.
Descriptive Statistical Results.

From the statistical results in Table 3, we can see the mean of RDD is 8.004%. The highest financial performance ROE of enterprises listed on GEM is 41.67%, and the lowest is −124.9%, which means that the performance of enterprises vary dramatically. There are remarkable differences in profitability level between different companies. The difference of executive compensation of enterprises listed on GEM is minute. The standard deviation is 0.586. The data fluctuation is subtle.
Correlation Analysis
Correlation analysis is an important method to test association between variables. Stata is used to analyze the correlation of samples, and the relevance is generally determined by the level of significance. The specific output is shown in Table 4. The correlation relationship between ROE and RDD is significant negative at 1%. The two variables SAL, EQ_INC showed significant positive correlation with ROE at the significance level of 1%. This has preliminarily verified the previous assumption.
List of Correlation Analysis Results.

, **,*: Significant at 1%, 5%, and 10% levels, respectively.
Except EQ_CON and EQ_BAL, the correlation coefficient of each variable is not greater than 0.7, which indicates that there is no collinearity between independent variables and control variables. This provides an excellent basis for subsequent regression analysis.
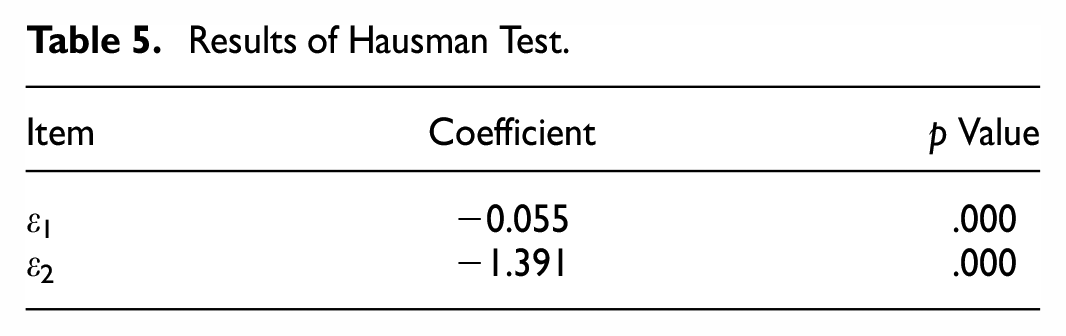
Endogenous Test
In the management practice of enterprises, R&D investment and financial performance are mutually causal. The relationship between independent variable and dependent variable is likely to cause endogenous problems. Therefore, in this study, we use Hausman test to check whether endogeneity exists. It can be seen from Table 5 that the regression coefficients are −0.055 and −1.391, respectively. They all pass the 1% significance level test. This shows that the original hypothesis is rejected, and the endogenous problem indeed exists. Therefore, in the following analysis, this work uses 3SLS to effectively solve the endogenous problem.
Results of Hausman Test.
Regression Analysis
In Table 6, we use OLS and 3SLS for analysis the full sample. The comparison show that the estimated results of OLS and 3SLS are partially different. This shows that the use of OLS estimation cannot effectively explain the endogenous relationship between RDD and ROE. In order to better verify the hypothesis, this study uses the 3SLS estimation method to solve the endogenous problem.
Regression Results.
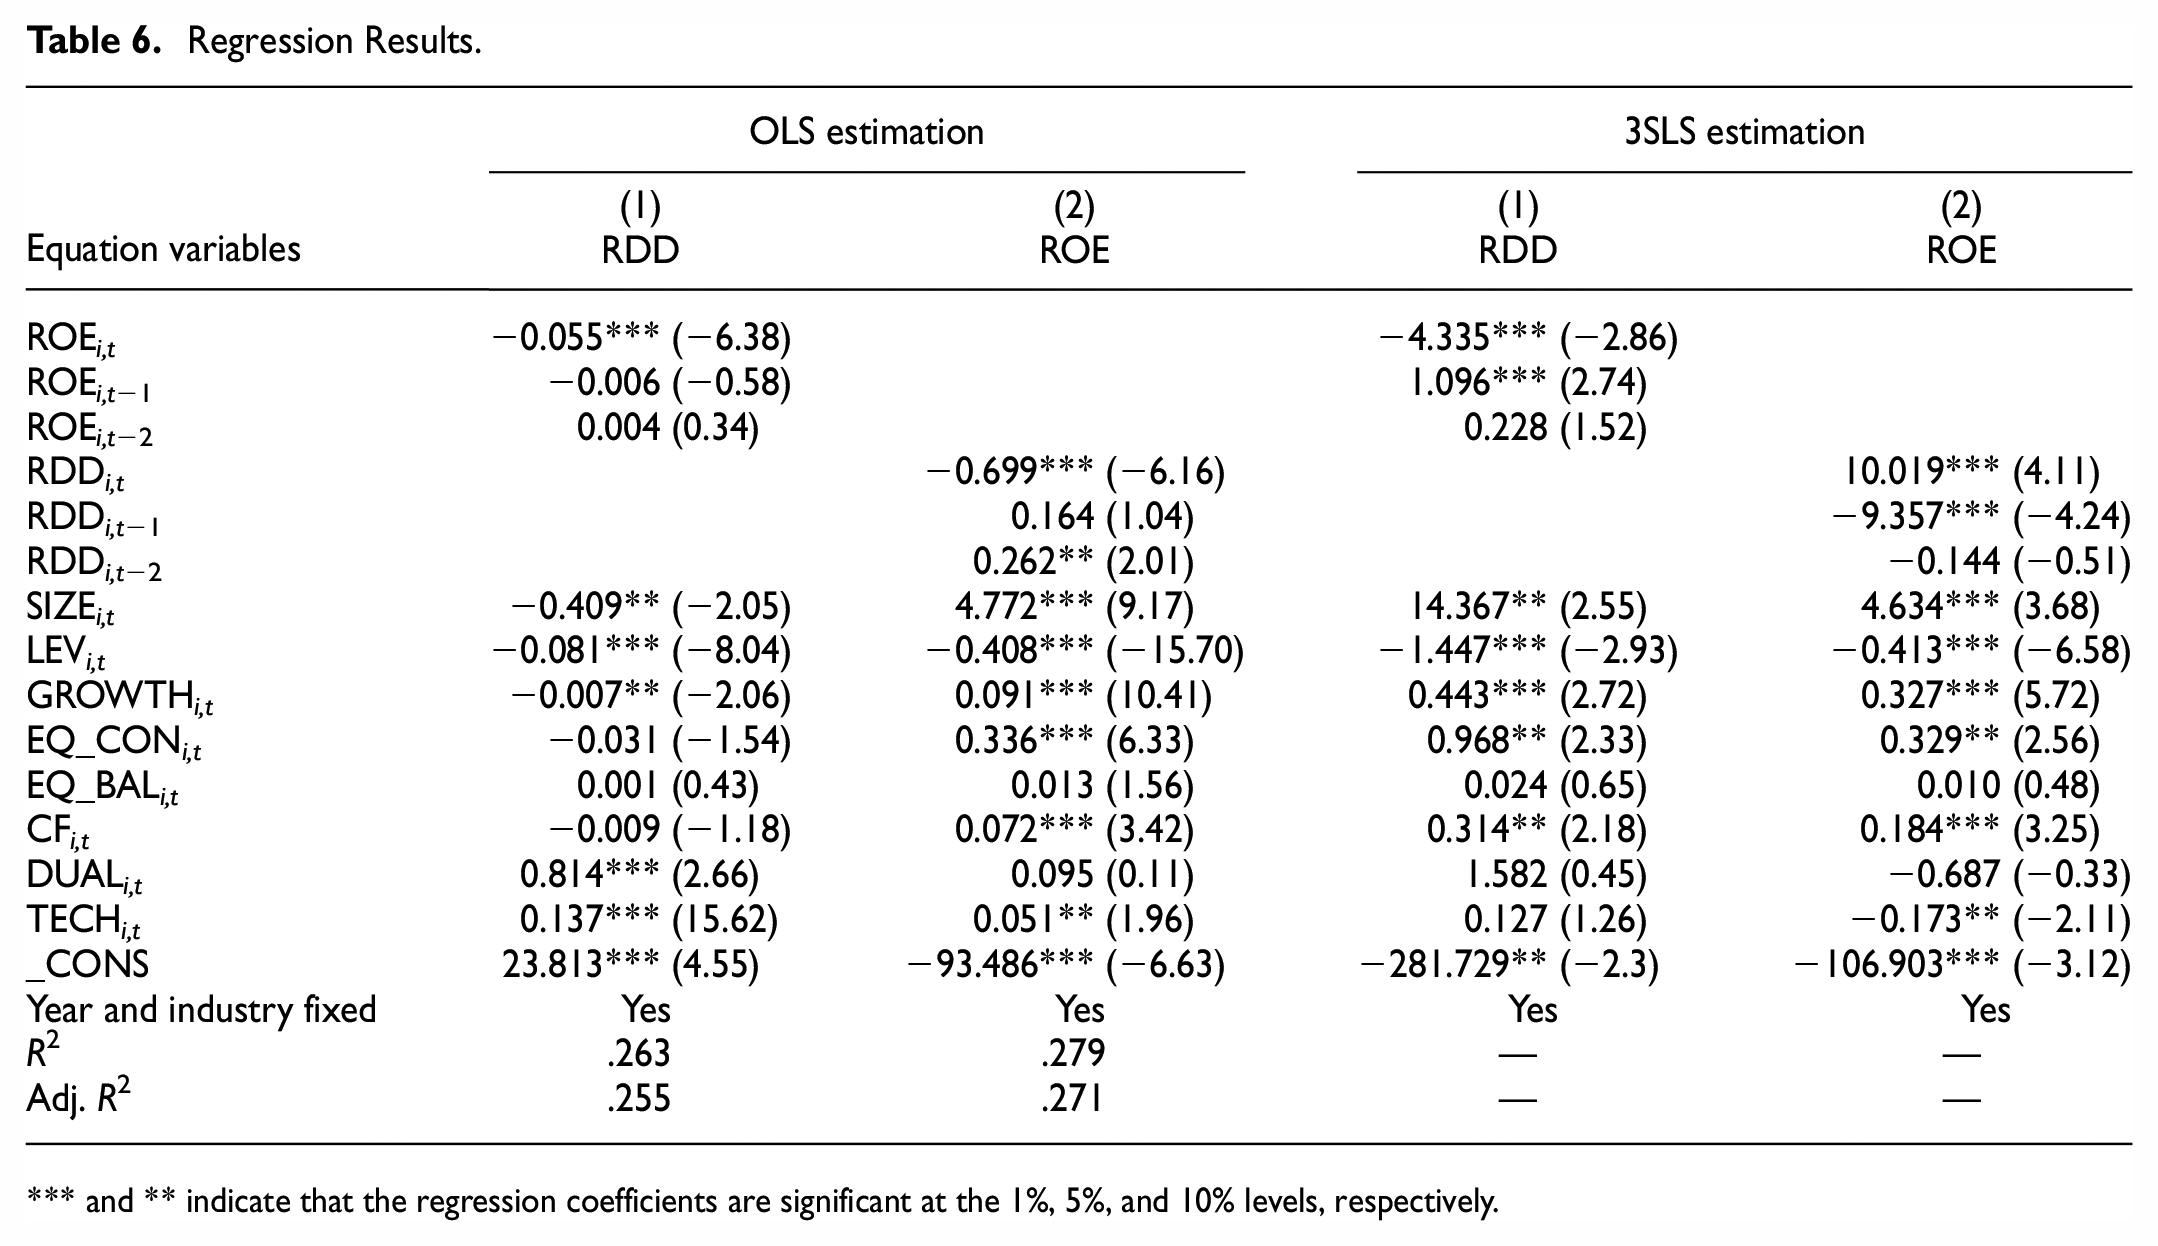
and ** indicate that the regression coefficients are significant at the 1%, 5%, and 10% levels, respectively.
In Table 6, RDD in the current period positively affects ROE in 1% significance level, which means that R&D investment in the current period can produce expected effects instantaneously. At the same time, RDD of the lag period has a significant negative impact on the ROE of the current period. This may due to the R&D activities in the previous period incur a large amount of expenses in the current period. These expenses may include intangible assets amortization, depreciation of fixed assets purchased, salaries of R&D personnel recruited, and so on. These newly increased expenses reduce the financial performance of the current period.
The lag effect of R&D also shows that enterprises may suffer from a revenue decline brought by innovative technologies when R&D activities enters the second year. The reason may come from fierce market competition and technology upgrading in GEM. Regarding the ROE reversely impact on RDD, the ROE of the current period has a significant negative impact on RDD, and the impact coefficient is −4.355.
This indicates if the current financial profit level is high, it may hinder the current innovation activities. This may be due to management’s complacency. Since there is a better source of profit in the current period, the management may cut or give up the uncertain R&D activity. On the other hand, the better financial performance in the lag period can promote the R&D activities in the current period. This means that enterprises will consider increasing future R&D activities when they have better profit indicators and cash flows.
Meanwhile, it can be seen from Table 6, the regression results of the six control variables passed the significance level. Financial leverage and R&D personnel both have a negative relationship with company financial indicator. The remaining four control variables all have a positive impact on financial performance.
Regression Analysis and Moderate Effects of Executive Incentive
In Table 7, incentive variables are introduced from the perspectives of cash and equity respectively, and tested with OLS regression. The SAL regression coefficient is 3.265, and it is significant at the level of 1%. It shows that in the case of increased executive compensation, the motivation of executives will be obviously improved, and the financial performance of enterprises will also be improved subsequently.
The Moderating Effect of Different Executive Incentives.

Note. t-Values are enclosed in parentheses.
, **, * indicate that the regression coefficients are significant at the levels of 1%, 5%, and 10%, respectively.
At the same time, there is a significant positive correlation between executive equity incentives and corporate financial performance. From the comparison of incentive effect, the coefficient of salary incentive (3.265) is much higher than that of equity incentive (0.117). It proves that executives in GEM value short-term interests more. Therefore, we confirm the hypothesis H2a and H2b.
In order to examine the role of senior executives in moderating R&D investment and return on equity, this work adds the interaction of R&D investment and senior executives incentive (RDD × SAL; RDD × EQ_INC) on the basis of models 1. In order to overcome the influence of endogenous problem, this work introduces the lag period of R&D investment and senior executives incentive into model 3. In Table 7, SAL has no significant moderate effect.
On the other hand, the regression coefficient for the interaction term (RDI × EQ_INC) is −0.009, and significant at the 5% level. It shows that executive equity incentive has a significant negative moderating effect between R&D investment and financial performance. Therefore, hypothesis H3a and H3b fail to pass the test.
Robustness Check
In order to improve the robustness of the empirical results, this study uses alternative variables for testing. We retest the sample data after removing the two dummy variables of industry and year. We also apply the 3SLS estimation method to the model. Compared with the current model, the results show that there is no significant difference in the coefficients of variables. Compared with the previous model, the results show that there is no significant difference in the coefficients of variables. This proves that the study has better robustness.
Conclusions and Policy Implications
Conclusions of the Study
In a nutshell, this work first reviews the literature and theoretically analyzes the relationship between the R&D investment and the return on equity of GEM companies from the perspective of senior executives incentive. This study builds a conceptual research model that empirically examines the impact of R&D investment on financial performance in Chinese GEM companies, along with a special focus on the moderating effect of executive incentive between the two variables.
ROE levels in different time periods have reverse impacts on R&D investment decisions. The high level of ROE in the past period will positively affect RDD. At the present period, the case is just the opposite. With regard to the previous scholars’ debate on R&D and financial performance, this study testifies different results in different time periods. In current period, this work proves the existence of significant positive influence from RDD on ROE. This positive link also supports Cohen and Levinthal (1990), Bayus et al. (2003), who argued that continuous innovation can generate high sales, other financial benefits and company growth.
The findings of this study correspond with previous scholars (Qin et al., 2019; Zhang, 2018), who argued that technological innovation strategies show a significant positive impact on corporate financial performance. It is necessary to effectively strengthen the investment of funds for technological innovation. This also strongly confirms Bigliardi (2013) that innovation is an important source of competitive advantage for businesses, where the level of innovation increases the financial performance of enterprises.
On the contrary, when considering the impact of RDD in the past period on ROE, the results show that there is a significant negative correlation. Just like the research of Kim et al. (2016) and Santos et al. (2014), who argued that the relationship between R&D investment and return on equity is not obvious or negatively correlated. This work shows R&D investment has a significant role in the return on equity. This lag time negative relationship shows that, in GEM, the updating speed of enterprises innovation is fast, and the competitive advantage of new technologies cannot be maintained for a long time.
For the control variables, six variables passed the significance test. It proves that they also have a significant impact on ROE. The larger the company (SIZE), the higher the financial performance of the enterprise. This conclusion is consist with previous studies on this variable (C. T. Liu et al., 2013; J. M. Liu & Zhou, 2018). The asset liability ratio (LEV) of the enterprise is negatively correlated with the financial performance, and the correlation coefficient is significant. This finding is similar to previous studies by many scholars (Mohamed et al., 2022; Xiong, 2013). A high debt ratio will increase the financial risk of the enterprise (Yazdanfar & Öhman, 2015), and reduce the expected income of the enterprise. At the same time, the high debt ratio means that the enterprise needs to bear high interest in the current period, thus reducing the profit rate in the company.
Executives are more motivated to work hard due to the incentive policy, which will promote the financial performance of the enterprise. That is, the salary and equity of senior executives have a significant positive impact on the return on equity. Specifically, the weight of cash impact is much more greater.
Based on empirical data, we strongly support the conclusions of Zhao and Gao (2018); Kato et al. (2007); Xing et al. (2014); and Xue and Li (2015), who argued that the cash compensation of senior managers has a positive correlation with the performance of corporate. Just like energy companies (X. L. Xu et al., 2020), in GEM in China, we also find salary incentive can promote the profitability of the firm.
Contrary to Demirer and Yuan’s (2013) view that the use of cash compensation has a negative impact on corporate performance. This study argues that executive compensation, rather than long-term deferred compensation, has a positive impact. The possible reasons lie in the cultural difference. China’s traditional culture is more focused on monetary incentives. Because society is in a high-speed development and full of uncertainty, long-term compensation incentive plans may not work well.
In the two moderated variables, cash compensation is insignificant, while equity incentive shows negative significance. The executive compensation incentives have a significant positive impact on corporate financial performance. However, it does not have a significant moderate effect between R&D capital investment and financial performance. This conclusion does not support Bosetti et al. (2015); Faggian and McCann (2009); and Hunt and Gauthier-Loiselle (2009), who generally recognized that executives compensation could play an important moderating role in implement innovative activities. For the equity incentive, this paper finds that this variable will play a negative moderate role.
This conclusion is different from the traditional equity incentive assumption. According to agency theory (Jensen & Meckling, 1976), the interests of managers and owners are in conflict in some area. Equity incentive is generally considered as an effective means to coordinate long-term interests between them. However, the conclusion of this work indicates that the role of equity incentive in GEM has not yet emerged. The possible reason is that the negative effect of equity incentive scheme is more highlighted in GEM. Specifically, equity incentive will cause dilution of equity. In GEM, due to the uncertainty in the initial stage of entrepreneurship, enterprises often face the choice of multiple products or business strategies. A centralized ownership structure is needed to strengthen the control right. Strengthening control can enable major shareholders with more voice to choose a predetermined business strategy. This is beneficial for the development of GEM companies in their early stages.
Policy Implication
Generally speaking, for GEM enterprises, sufficient investment in technological innovation is indispensable. R&D is an important knowledge-based resource of enterprises. Considering the negative impact of lag time behind, enterprises should shorten the R&D cycle and try to invest in projects with quick results. GEM companies in China are facing fierce competition and uncertainty in the future. In order to reduce the uncertainty of future R&D activities, enterprises should expand R&D investment and improve R&D efficiency in the short term, so as to gain competitive advantage.
Based on the difference of the effects of the two different incentive schemes, GEM is suggested to design a sound system of cash compensation scheme. In this salary system, the assessment indicators of tasks need to be quantified and have certain challenges for managers. Companies should set reasonable annual growth performance targets and provide matching compensation levels for top managers. In this way, managers will exert all their strength to serve the company.
Combined with China’s current conditions, short-term compensation schemes are more attractive than long-term incentive schemes such as equity and options. Short-term compensation could make them more responsible for undertaking high-risk R&D projects (C. Sun & Zhuang, 2021; Usman et al., 2018). Cash incentive is more effective than equity incentive (C. Wang et al., 2021). The total cash income should include basic salary, post salary, quarterly performance bonus, half-year performance bonus, annual comprehensive performance bonus et al.
The benefits of equity incentives have been widely proved, but the positive moderate effect may not be applicable in GEM. In GEM, the R&D decisions of enterprises are often uncertain. Owners of start-ups are often confused about the direction of product R&D development. For example, which is better, to choose to develop the technology of the product, enhance the appearance of the product, or improve the brand relationship of the product? The equity incentive plan means that the equity structure is decentralized. Decentralized control will lead to many divergence of decision views. After stock ownership dilution, the ownership structure is easy to incur overlapping leadership. This study suggests that equity incentives have a negative moderating effect. So in GEM, the ownership structure should be centralized.
Research Limit and Future Plan
The indicators of the technological innovation only select the investment of R&D funds, and do not include R&D policy factors into the explanatory variables. Therefore, in future research, the R&D policy factors can be included in the explanatory variables, and the explanatory variables can be enriched and supplemented. At the same time, there are other factors driving financial performance. Whether the company’s social responsibility, and the influence in the secondary market could effectively promote the growth of the company’s financial performance? These are all issues that require continued attention in the future. Finally, the time span of financial data was short. So future research can expand the selection range of time span of financial data.
Supplemental Material
sj-xlsx-1-sgo-10.1177_21582440231210428 – Supplemental material for R&D Investment, Executive Incentive, and Financial Performance in GEM: Based on Three-Stage Least Squares Method
Supplemental material, sj-xlsx-1-sgo-10.1177_21582440231210428 for R&D Investment, Executive Incentive, and Financial Performance in GEM: Based on Three-Stage Least Squares Method by Luxing Liu, Keyu Lei, Hong Jin and Yin-Pei Teng in SAGE Open
Footnotes
Author Contributions
Luxing Liu: Conceptualization, Data curation, Writing—original draft, Writing—review & editing;
Keyu Lei: Translation, Validation;
Hong Jin: Data curation, Investigation;
Yin-Pei Teng: Supervision, Project administration.
Declaration of Conflicting Interests
The author(s) declared no potential conflicts of interest with respect to the research, authorship, and/or publication of this article.
Funding
The author(s) disclosed receipt of the following financial support for the research, authorship, and/or publication of this article: Project supported by the Ministry of Agriculture and Rural Affairs of the People’s Republic of China: Collaborative Innovation Center Project of Modern Agricultural Industrial Park in Anxi County, Fujian Province (KMD18003A);
Data Availability
All data used to support the conclusions of this work are available from the corresponding author on request.
Supplemental Material
Supplemental material for this article is available online.
References
Supplementary Material
Please find the following supplemental material available below.
For Open Access articles published under a Creative Commons License, all supplemental material carries the same license as the article it is associated with.
For non-Open Access articles published, all supplemental material carries a non-exclusive license, and permission requests for re-use of supplemental material or any part of supplemental material shall be sent directly to the copyright owner as specified in the copyright notice associated with the article.