
Abstract
This study investigates how R&D affects firm performance and examines whether and how state ownership moderates the R&D–firm performance nexus. Moreover, this study investigates whether and how product market competition moderates the association between R&D and performance across the different natures of firms. Employing a sample of Chinese listed firms from 2000 to 2020, the study performs estimations by applying pooled ordinary least squares regressions, fixed-effect panel regressions, and a two-step system GMM model to account for endogeneity problems. The findings reveal that firm performance reduces as R&D expenses rise, with the impact being less pronounced for state-owned enterprises. The adverse impact of R&D on corporate performance is also alleviated under intense competition. The results have important implications for policymakers, investors, and corporations seeking to understand how R&D spending influences corporate performance in competitive industries.
Introduction
R&D investment is an important attribute for enhancing firm value (Johnson & Pazderka, 1993) and economic growth (Alam et al., 2019; Brown et al., 2009). High-growth companies like Google, Apple, Samsung, and Huawei have increased their investment in R&D to enhance the desirability and quality of their core products (Kim et al., 2018). One of the primary considerations of academia and practice in this setting is how R&D expenditures impact corporate value. Preliminary studies have provided contradictory findings on the R&D–firm value nexus. Some prior studies find that spending on R&D has the capability to produce substantial future earnings, thereby increasing corporate value (Chauvin & Hirschey, 1993; Ho et al., 2005; Jaffe, 1986; Lev & Sougiannis, 1996; Tyagi et al., 2018). By contrast, some other studies show that various structural factors of firms, including size, industry, and risk tolerance, have differential impacts on the value created by R&D expenditures (Bae et al., 2008; Czarnitzki & Kraft, 2006; Pindado et al., 2010). Therefore, the evidence suggesting the sign of the association between R&D investment and corporate performance remains inconclusive.
This study extends the increasing body of literature by illustrating how R&D expenditures relate to corporate performance in the Chinese context. We investigate the relationship in Chinese firms for the following reasons. First, the investments of Chinese firms in R&D have grown significantly, fostering the expansion and diversification of existing sectors and promoting the creation, expansion, and development of new sectors and industries. Chinese firms are at the forefront of R&D investment because they are able to take advantage of low labor costs and other competitive advantages to enhance innovation and amass the technical resources necessary to compete globally (McKinsey, 2021). Second, a market-based economy is emerging in China as it transitions from a centrally controlled one. Therefore, the acceptance and implementation of free-market concepts, as well as the transitory characteristics of the Chinese economy, have generated several possibilities for listed companies to engage in R&D. However, capital markets are undeveloped during market transitions, and it is apparent in a transition economy that companies will spend on R&D to compete and enhance their performance because firms face numerous changes in various areas during the market transition. Therefore, we anticipate a significant influence of R&D spending on firm performance. Third, private companies and state-owned enterprises (SOEs) coexist in China. SOEs, in particular, represent a considerable portion of China’s economy, and their political ties to the government presumably make it easier for them to get investment finance (Cheng et al., 2017; Cull et al., 2015). Moreover, it is evident that SOEs are supported and facilitated by the government since the latter finances and encourages their growth and development (Bo & Zhang, 2002). The government also provides discounted bank loans to SOEs. Non-SOEs, on the other hand, depend on their own resources to enhance performance (Guariglia & Yang, 2018) and often struggle to acquire bank financing to invest in R&D. Kang et al. (2000) argue that intimate connection to creditors (banks) might enhance and make it easier to implement investment strategies that maximize shareholders’ wealth and improve firm performance. Guariglia and Mateut (2016) indicate that firms with political connections have an advantage over firms without such connections in terms of gaining easier access to external financing under high competition. Therefore, we expect R&D spending to have an impact on how well firms perform, and this association may be influenced by state ownership.
R&D investment is significant corporate spending that contributes to creating firm value (Porter, 1992). Therefore, employing a sample of Chinese non-financial listed firms for the period 2000 to 2020, this study applies three estimation techniques, including pooled ordinary least squares (OLS), fixed-effect model, and robust two-step system-GMM estimators, to investigate the influence of R&D on firm performance. Furthermore, it shows whether and how state ownership moderates the R&D–performance nexus. Czarnitzki and Toole (2013) also show that firms operating in extremely concentrated (vs. competitive) sectors invest lower in R&D. This is due to the fact that in fiercely competitive sectors, when a company involved in an innovative competition successfully completes an R&D initiative, other firms cease similar initiatives since a breakthrough reduces the need for duplication of effort and the additional advantages disappear (Gu, 2016). Therefore, the present research further explores whether the R&D–performance nexus is moderated by product market competitiveness. The results indicate an adverse impact of R&D investment on firm performance, and this relationship is weaker for government-owned firms. Moreover, the adverse association between R&D spending and firm performance is attenuated for SOEs in highly competitive industries.
This study adds to the existing body of knowledge in the following respects. First, it extends the theoretical literature on R&D spending by propositioning how R&D spending influences firm performance. Considering R&D as a ratio of total sales, this research supports the prediction mentioned above by indicating that R&D spending has a detrimental effect on corporate performance. Our results likewise support the underlying assumption of real options theory by demonstrating that companies postpone investment and seek additional knowledge and information about market dynamics. Second, this research explores the understudied moderating influence of product market competitiveness on the nexus between R&D and corporate performance. New evidence from the empirical analyses of this research indicates that this nexus is significantly moderated by product market competitiveness. Finally, this study adds to the existing body of knowledge by demonstrating that the impact of product market competitiveness on the relationship between R&D and performance varies among firms with varying ownership structures. This result suggests that firm ownership is a critical aspect that might mitigate the negative impact of R&D in a highly competitive environment.
The rest of the paper is designed as follows. Section 2 develops the hypotheses. Section 3 presents a description of the dataset, variables, and econometric models. Section 4 reports the empirical findings of the study and tests for robustness. Finally, Section 5 concludes.
Literature Review
Researchers have been attempting to estimate the nexus between R&D spending and corporate performance. The findings, however, are still inconclusive. Numerous studies reveal a significant positive association (Ehie & Olibe, 2010; Gunday et al., 2011), whereas studies by Alam et al. (2020); S. H. Chan et al. (1990); Chen et al. (2019); Kim et al. (2018); Knecht (2013); and Yang et al. (2009) show R&D intensity and company performance to be negatively correlated. Although the concern of whether R&D expenditure enhances firm performance has been debated, we contend that R&D spending may have a detrimental effect on corporate performance, as developing new products, techniques for developing new products, and information technology may not always provide positive outcomes. Moreover, owing to its costly, uncertain, and risky nature, the R&D procedure might not be able to meet the current market expectations (Liao & Rice, 2010). In similar research, Knecht (2013) concluded that R&D expenses for the current year reduce current-year profitability. R&D expenditure has also been shown to have a negative effect on profit in the year of the investment (Natasha & Hutagaol, 2009; Parcharidis & Varsakelis, 2007).
Furthermore, the S-curve model proposed by Foster (1986) suggests that initial R&D expenditures have such low marginal productivity that it is challenging for firms to produce significant innovative output. A firm’s performance suffers and declines when the returns of technological advancement are insufficient to cover the underlying R&D expenses. This condition is referred to as a “management discomfort zone” by Becker and Speltz (1983).
Organizational learning theory describes R&D as a learnable activity and considers innovation a learning process (McKee, 1992). This description indicates that expertise may minimize new product failure rates (Booz, 1982) and increase the consistency of success relative to competitors (Cooper & Kleinschmidt, 1987). Nonetheless, the cumulative learning experiences entrenched in people require time to disperse, integrate, and assimilate at an organizational or “meta-learning” level (McKee, 1992), that is, the absorptive capacity of organizations is not merely the sum of its workers’ existing knowledge (Cohen & Levinthal, 1990). This situation is particularly obvious when a company develops a varied technological portfolio in which certain R&D initiatives do not resemble their expertise. The significance of the knowledge and experience is reduced when a new endeavor is unrelated to previously learned knowledge (Cohen & Levinthal, 1990). Therefore, a high-tech company managing a portfolio of technologies may not be capable of reaping the advantages of sharing and learning knowledge across several R&D units and groups with a lower level of R&D spending.
R&D initiatives may take a long time to become effective and productive. However, if R&D projects are eventually successful, it may take some time for the innovative outcomes of R&D to be significantly implemented. According to the theory of innovation diffusion, even if innovation is technologically successful, a newly introduced product will require time to disseminate (Mansfield, 1961; Turnbull & Meenaghan, 1980) and must surpass a “chasm” before being broadly accepted (Moore, 2004). Some other studies, such as Kim et al. (2018), Chen et al. (2019), and Alam et al. (2020), also support the claim that R&D and corporate performance are negatively correlated.
In essence, the inadequacies caused by initially lower R&D expenditures are due to the incapacity to attain economies of scale, foster absorptive capacity, and disperse risk. Such inadequacies exceed any anticipated gains from R&D expenditure. Therefore, we formulate the following sub-hypotheses.
Understanding the R&D–firm value association is significantly assisted by taking into account the ownership structure of the firm. This is considerable since ownership structure influences how corporate resources are allocated (Jefferson et al., 2006; Ruiqi et al., 2017). Zhang et al. (2003) provide evidence that, in the case of Chinese firms, the state sector invests less in R&D and is less productively efficient than the private sector. This suggests that a larger degree of state ownership in transition economies might reduce the total productivity of firms. Since SOEs invest lower in R&D and contribute to continuing social welfare and promoting societal stability owing to their public nature, their financial performance may be incentivized at a lower profit rate (Bai et al., 2004).
Unlike other types of ownership structures, SOEs tend to be less innovative and risk-taking (Peng et al., 2004; Tan, 2002). This is because many SOEs rely only on government funding to finance their innovative projects (Mascarenhas, 1989) and the remuneration of managers in SOEs is generally unrelated to the performance of the firm, thus deterring SOEs from innovating (Tan, 2002). Contrarily, non-SOEs are more interested in innovating and seeking developmental prospects (Tan, 2002).
We likewise argue that state ownership may lead to less pressure for firms to see a direct financial return on R&D investment and may provide a cushion for firms to invest in R&D even if the immediate financial returns are unclear. Moreover, state ownership may provide access to additional resources and support for R&D, such as government funding and partnerships with research institutions. Such resources could lead to higher-quality R&D and better performance for the firm.
Based on the discussion above, we test whether the relation between R&D spending and corporate performance is moderated by state ownership and hypothesize the following:
We further argue that product market competition might significantly impact the R&D–performance nexus, which may differ for firms of different natures of ownership. The research findings of Lai et al. (2015), Saidani et al. (2017), and (Jung & Kwak, 2018) show that competition significantly impacts the R&D activities of corporations of varying natures and sizes. In intensely competitive sectors, a corporation’s valuation relies on its assets-in-place, making corporations riskier, especially during uncertainties, when the productivity of a company’s assets declines (Aguerrevere, 2009). Several studies (Guariglia & Yang, 2018; M. A. Khan et al., 2019) suggest that SOEs benefit from larger internal resources and easier accessibility to external finance, making them more competitive. By contrast, non-SOEs under high competition have a less innovative capability to compete with SOEs since the former may not have the resources needed to recoup and sustain if an R&D project proves unsuccessful. Therefore, we predict that non-SOEs under high competition spend more on R&D than do SOEs and suffer the adverse impact as a result of higher external funding costs and lower levels of internal resources. Based on the discussion above, we propose that SOEs under high competition better mitigate the adverse effect of R&D on corporate performance than do non-SOEs and formulate the following hypothesis:
On the basis of the aforementioned hypotheses, we provide a theoretical framework presuming a negative relation between R&D and corporate performance in China which may vary for firms with various ownership structures. Additionally, as illustrated in Figure 1, the impact of product market competition on this association may differ for firms of varying natures.

Theoretical model.
Methodology
Data
This research examines all non-financial (A-share) listed firms over the period 2000 to 2020. The financial data of firms are obtained from Wind and CSMAR databases. The observations with missing data are omitted, and the firms with data for a minimum of three consecutive years are employed in the two-step system GMM approach to instrument the endogenous variables appropriately. After the initial screening, the finalized sample consists of 38,444 firm-year observations. Controlling for the outliers’ effect, we winsorize all continuous variables at the lower and upper one percentile.
Measurement of Variables
Dependent Variable
This research uses firm performance as a dependent variable, proxied by return on equity (ROE), calculated as net profit divided by shareholders’ equity (Ahmadi et al., 2018; Liu et al., 2015; Ullah et al., 2019). To check the robustness of the analyses, this study employs an alternative proxy for firm performance, namely, return on assets (ROA), which is measured as “profit before interest and taxes normalized by total assets” (Alam et al., 2020; Chen et al., 2019; Karamshahi et al., 2018; B. Khan et al., 2022).
Independent Variable
The primary independent variable used in this research is R&D investment, computed as the ratio of R&D spending to total sales (M. A. Khan, Qin, Jebran, & Ullah, 2020; Lodh et al., 2014; Ross et al., 2018). For robustness, we calculate R&D as the ratio of R&D spending to total assets (Fang et al., 2014; M. A. Khan, Qin, Jebran, & Ullah, 2020; Xiao, 2013) and the ratio of R&D capital to total assets (K. Chan et al., 2015; M. A. Khan, Qin, Jebran, & Ullah, 2020; Li, 2011). R&D capital is measured as the five-year weighted mean of annual R&D expenditure, depreciated at 20% annually:

The three indicators of R&D investment exhibit a strong significant association, with correlation coefficients ranging from .7717 to .9342 (as shown in Table A1). For the missing data, we presume that there was no R&D expenditure.
Moderator Variable: Product Market Competition
This study uses product market competition as a moderator variable and measures it by computing the Herfindahl-Hirschman index (HHI) (Gu, 2016; M. A. Khan, Qin, Jebran, & Ullah, 2020; Wang et al., 2017):

where J denotes the total number of companies operating in the industry j and sij denotes the sales for ith firm in the industry j. HHI is the sales volume-weighted index for industry j. A high HHI value signifies a highly concentrated industry, whereas a low HHI value indicates a higher level of firm competition, denoted by PMC.
Econometric Model
To investigate the nexus of R&D–firm performance, this study opts for three estimating parameters: pooled OLS regressions, fixed-effect panel regressions, and dynamic panel data (DPD) approach (i.e., robust two-step system-GMM). To account for endogeneity, we estimate the results using a robust two-step system-GMM approach, as suggested by Arellano and Bond (1991), Arellano and Bover (1995), and Blundell and Bond (1998) and first implemented in Stata by Roodman (2009).
We integrate the explanatory variable (i.e., R&D) into our model, including several firm-specific variables. The current performance of a firm is a common phenomenon significantly impacted by its past performance (Alam et al., 2020; Chen et al., 2019). Therefore, we control persistency in a firm’s performance by adding a one-period lagged dependent variable into the model. Since firm performance depends on the amount of R&D expenditure, studying the relationship between the two is of importance. To test H1, we develop equation (1), which depicts the influence of R&D on the firm performance.

where firm and time are indicated by the subscripts i and t, respectively. ROE and ROA are two metrics used to measure firm performance (FP) for firm i in year t. Conforming to the prior research (Alam et al., 2020; Chen et al., 2019), we included the first lagged FP in the model to account for the possibility that endogeneity affects the R&D–performance relationship. In other words, lagging performance might have an impact on present performance. Three proxies are used to assess R&D: the primary independent variable, including R&D_S (R&D normalized by total sales); R&D_A (R&D normalized by total assets); and R&D_C (R&D capital normalized by total assets). Additionally, we control for several additional variables that might impact firm performance. Cash holdings (Cash) are included and calculated by dividing cash and cash equivalents by total assets (Alam et al., 2020; M. A. Khan, Qin, & Jebran, 2020). Since highly leveraged firms do not perform better (Gao et al., 2017; Jung & Kwak, 2018), we use Leverage as a control variable, which is calculated by dividing total liabilities by total assets (Jebran et al., 2019; Ullah et al., 2019). We compute tangible assets as a percentage of total assets to control for tangibility (Jebran et al., 2019). Sale ratio is controlled and is calculated by dividing total sales by total assets (Ullah et al., 2019). Firm size (Size) is controlled by calculating the natural logarithm of total assets. Larger companies are believed to perform better because they may benefit from higher economies of scale, greater total assets, and easier capital access (M. A. Khan, Qin, Jebran, & Rashid, 2020). Firm age (age), calculated as the number of years since the company’s inception year, is included to take into consideration the impact of the firm’s life cycle on the association between R&D spending and corporate performance (Gao et al., 2017). Cash flow ratio (Cf) is calculated using the firm’s net earnings plus depreciation scaled by capital stock (Guariglia & Yang, 2018). Lastly, we account for the fixed effects of industry and time, denoted by fi and ft, respectively.
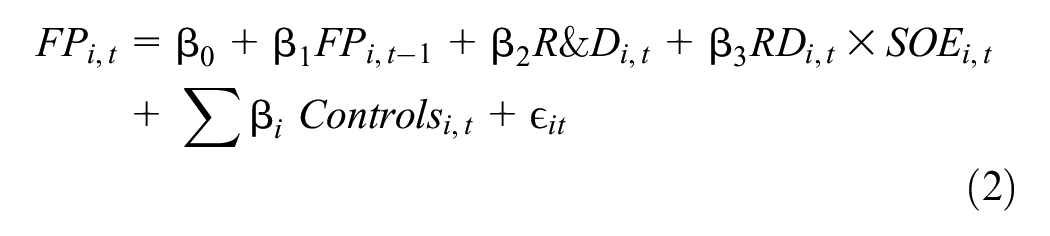
To test H2, we estimate equation (2) to investigate the moderating influence of state ownership on the R&D–performance association.
Finally, equation (3) tests our H3 by examining the moderating influence of competition on the R&D–performance nexus for SOEs and non-SOEs.

where FP signifies firm performance taking the form of ROE. R&D represents R&D expenditure. We calculate the HHI index of each industry to determine the industrial concentration level. A large value of HHI indicates firms operating in concentrated industries, and a small value of HHI (denoted by PMC) indicates firms operating in competitive sectors. Controls represent a group of control variables: Cash, Leverage, Tangibility, Sale, Size, Age, and Cash flow.
Empirical Findings
Descriptive Statistics
The descriptive statistics for the whole sample, SOEs, and non-SOEs are shown in Table 1. The mean (median) value of ROE for the whole sample is 5.12% (6.90%). The mean values of ROE and R&D of SOEs (non-SOEs) are approximately 0.0484 (0.0532) and 0.0018 (0.0038), respectively. These figures show that both kinds of companies have varying levels of R&D and performance, even within the same industry. This result suggests that compared to the non-state sector, the state sector is less innovative and productive, implying that, in transition economies, firms with a large share of state ownership might have lower total productivity. For other variables, we obtain significant mean and standard deviation differences between SOEs and non-SOEs.
Descriptive Statistics

Note. This table reports descriptive statistics for variables. ROE is a company’s net income ratio to its total shareholders’ equity. R&D_S represents spending on R&D normalized by total sales. Cash stands for cash holding ratio, Lev is the ratio of total liabilities to total assets, Tang is the ratio of tangible assets to total assets, Sale is the ratio of total sales to total assets, Size represents firms’ size in terms of total assets, Age represents company age since the inception year, and CF represents a cashflow ratio.
p < .05. ***p < .01.
We further assess statistically significant differences between SOEs and non-SOEs by performing a t-test. Table 1 shows the t-test estimates, which imply that the t-statistics of all variables are significant; specifically, there are statistically significant differences between SOEs and non-SOEs for our primary variables, such as firm performance (ROE) and R&D.
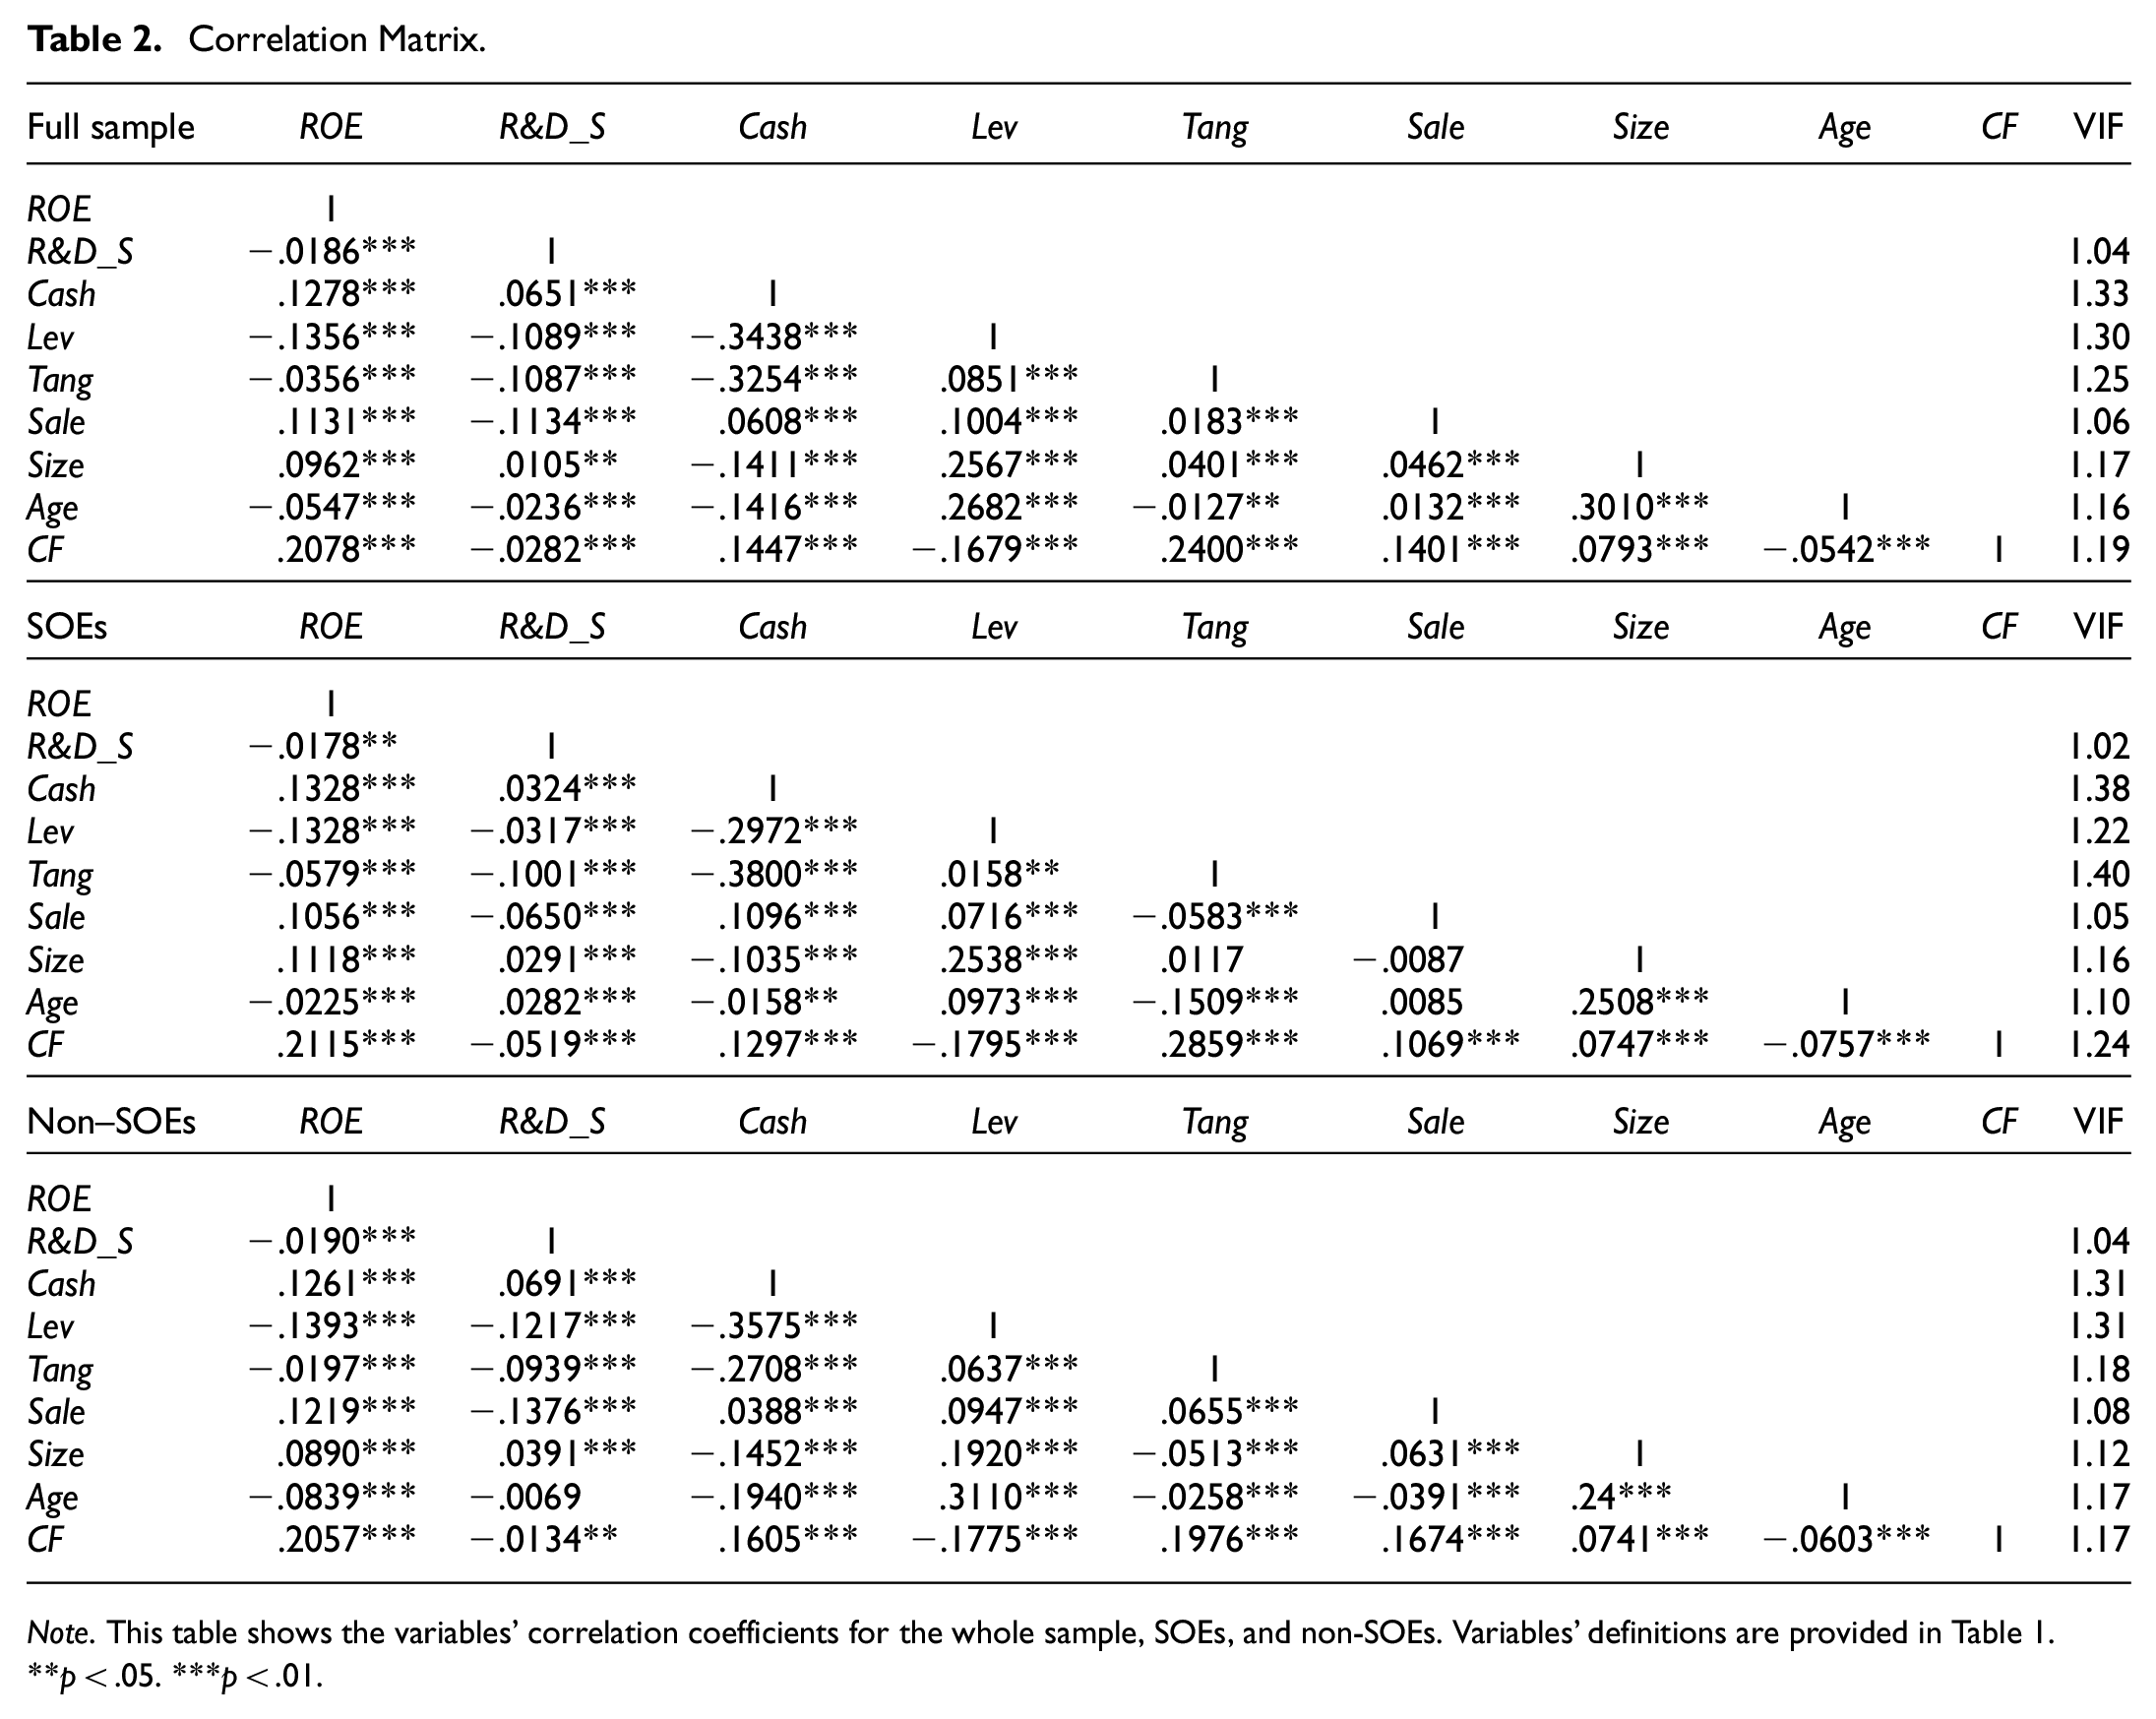
Correlation Analyses
Table 2 reports the variables’ coefficients of correlation for the whole sample, SOEs, and non-SOEs. The findings indicate a significant inverse relationship between ROE and R&D, leverage, tangibility, and age. However, ROE shows a significant positive correlation with cash, sales, size, and cash flow. The correlation coefficient for R&D is smaller for SOEs that for non-SOEs. For the control variables, we find the same sign and significance of correlation coefficients for the whole sample, SOEs, and non-SOEs over the sample period.
Correlation Matrix.
Note. This table shows the variables’ correlation coefficients for the whole sample, SOEs, and non-SOEs. Variables’ definitions are provided in Table 1.
p < .05. ***p < .01.
However, the correlation coefficients of the underlying variables are lower during the sample period. We calculate VIF to address multicollinearity problems accurately. The findings show that the maximum values of VIF for SOEs, non-SOEs, and the whole sample are 1.40, 1.31, and 1.33, respectively, indicating that multicollinearity concerns will not impair our analyses.
Influence of R&D on Firm Performance
The findings for the regression equation (1) are shown in Table 3. Column (1) shows the conventional model, including 1-year lagging ROE, R&D_S (R&D spending scaled by total sales), and control variables. The results indicate a substantial consistency between current and lagged performance (ROE) by exhibiting significant positive coefficients of lagging ROE at 1% in all of our models. The findings indicate a statistically significant (at the 1%) negative coefficient for R&D_S as well, which indicates that firm performance deteriorates as R&D spending rises, consistent with the notion that R&D spending decreases current year earnings. Similar conclusions were obtained by Alam et al. (2020), Chen et al. (2019), and Kim et al. (2018). This negative relationship between R&D and firm performance is both statistically and economically significant. For example, the coefficient of R&D_ Si,t (column 1) is −0.3618, which means that a one-standard-deviation increase in the R&D spending of a firm is associated with a decrease of 36.18% (= 0.3618 × 0.0117/0.2009) of a standard deviation in firm performance as measured by ROE, ceteris paribus.
Influence of R&D on Firm Performance.

Note. The variables are defined in Table 1. Numbers in parentheses are Robust Standard Errors clustered at the firm level.
p < .05. ***p < .01.
We employ an alternative R&D measurement in column (2), denoted by R&D_A, which is computed as R&D spending scaled by total assets. We observe a significantly negative coefficient for R&D_A, indicating that firm performance declines as R&D investment increases.
Column (3) shows that R&D Capital, denoted by R&D_C, likewise has a significant negative coefficient, implying that R&D_C reduces firms’ ROE. Our results support the findings provided in prior studies (Alam et al., 2020; Chen et al., 2019; Kim et al., 2018; Yang et al., 2009). Consequently, the findings in Table 3 are congruent with the notion that in the early phases of a lower level of investment in R&D, firm earnings could be reduced as a consequence of the diseconomy caused by the lower level of R&D, limited absorptive capacity, lower rates of innovative success, overspending, the time lag that may happen when companies fail to recognize that technological constraints are approaching or become careless with cost control, and investing in projects that push their R&D portfolio outside of their efficiency frontier, such that firm performance deteriorates when R&D spending increases. These outcomes corroborate our Hypothesis 1a.
We observe that the control variables, cash holding, firm size, sales, and cash flow, positively influence firm performance, which is consistent with prior studies (Alam et al., 2020; Chen et al., 2019; Kim et al., 2018; Ullah et al., 2019; Yang et al., 2009). Moreover, the findings show that leverage (Alam et al., 2020; Chen et al., 2019), tangibility (Alam et al., 2020; Ullah et al., 2019), and firm age (Yang et al., 2009) have a detrimental influence on firm performance.
Moderating Influence of State Ownership on the R&D–Performance Nexus
The results for estimating regression equation (2) pertaining to the moderating influence of state ownership on the R&D–performance association are reported in Table 4. We observe significant negative effects of R&D_S, R&D_A, and R&D_C on corporate performance in columns (1), (2), and (3) of Table 4, respectively. For the three different measures of R&D, the estimates do not indicate any substantial variation in sign or level of significance. The results also show that state ownership deteriorates the detrimental effect of R&D on corporate performance by finding significant positive coefficients for the interaction terms R&D_S × SOEi,t, R&D_A × SOEi,t, and R&D_C × SOEi,t in columns (1), (2), and (3), respectively.
Moderating Influence of State Ownership on the R&D–Performance Nexus.

Note. See variables’ definitions in Table 1. Numbers in parentheses are Robust Standard Errors clustered at the firm level.
p < .1. **p < .05. ***p < .01.
This result might be due to SOEs having easier access to resources and funding for R&D, including government financing and collaborations with research institutes. In addition, SOEs have low R&D and productivity efficiency and are less inclined to take risks and innovate. These results support the previous studies (Peng et al., 2004; Tan, 2002; Zhang et al., 2003) and confirm Hypothesis 2.
Moderating Influence of Product Market Competition on the R&D–Performance Nexus of SOEs and Non-SOEs
The regression findings for equation (3) that tests our third hypothesis about the moderating effect of competition on the R&D–performance nexus are shown in Table 5. Column (1) indicates that the main impact of R&D_S remains statistically insignificant for SOEs. Corroborating Hypothesis 3, we likewise show that the interaction term of product market competition and R&D (R&D_S × PMC) has a significantly positive coefficient, illustrating that the adverse influence of R&D on SOEs’ performance is mitigated under high competition.
Moderating Influence of Product Market Competition on the R&D–Performance Nexus of SOEs and Non-SOEs.

Note. The variables are defined in Table 1. Numbers in parentheses are Robust Standard Errors clustered at the firm level.
p < .1. **p < .05. ***p < .01.
For non-SOEs, we re-estimate equation (3) to measure the moderating impact of competition on the R&D–performance nexus and provide the results in columns (2) of Table 5. The results show that the direct impact of R&D is negative (significant at 1%), exemplifying that the isolated effect of R&D is consistent with the findings for non-SOEs provided in Table 5. However, the coefficients of the interaction term appear statistically insignificant, showing that competition does not mitigate the adverse impact of R&D.
Through a comparative analysis of columns (1) and (2), we observe that the coefficient for the interaction of R&D with competition is significant for SOEs only, implying that SOEs better alleviate the detrimental impact of R&D on performance under high competition. These findings corroborate our Hypothesis 3. SOEs invest lower in R&D; however, under high competition, they are financed and supported by the government while non-SOEs rely on their own internal resources. The findings indicate that competition is a significant factor in determining firm performance under high R&D spending.
In columns (3) and (4), we check for robustness using an alternate measure of the dependent variable. The results remain robust for both measures of the dependent variable (ROE and ROA). They are also in line with those stated in columns (1) and (2), indicating that non-SOEs in intense competition are more sensitive to the effect of R&D on their performance.
Robustness Tests
Testing Robustness Using ROA as a Dependent Variable
Following the literature (Alam et al., 2020; Chen et al., 2019; Yang et al., 2009), we consider ROA as an alternative measure of firm performance for checking robustness. The results stated in Table 6 support the prior findings reported in Table 3, indicating that R&D_S, R&D_A, and R&D_C negatively affect firm performance. The findings of the control variables likewise persist, confirming that our results are unaffected by a different performance proxy.
Robustness Test Using ROA as a Dependent Variable.

Note. The variables are defined in Table 1. Numbers in parentheses are Robust Standard Errors clustered at the firm level.
p < .01.
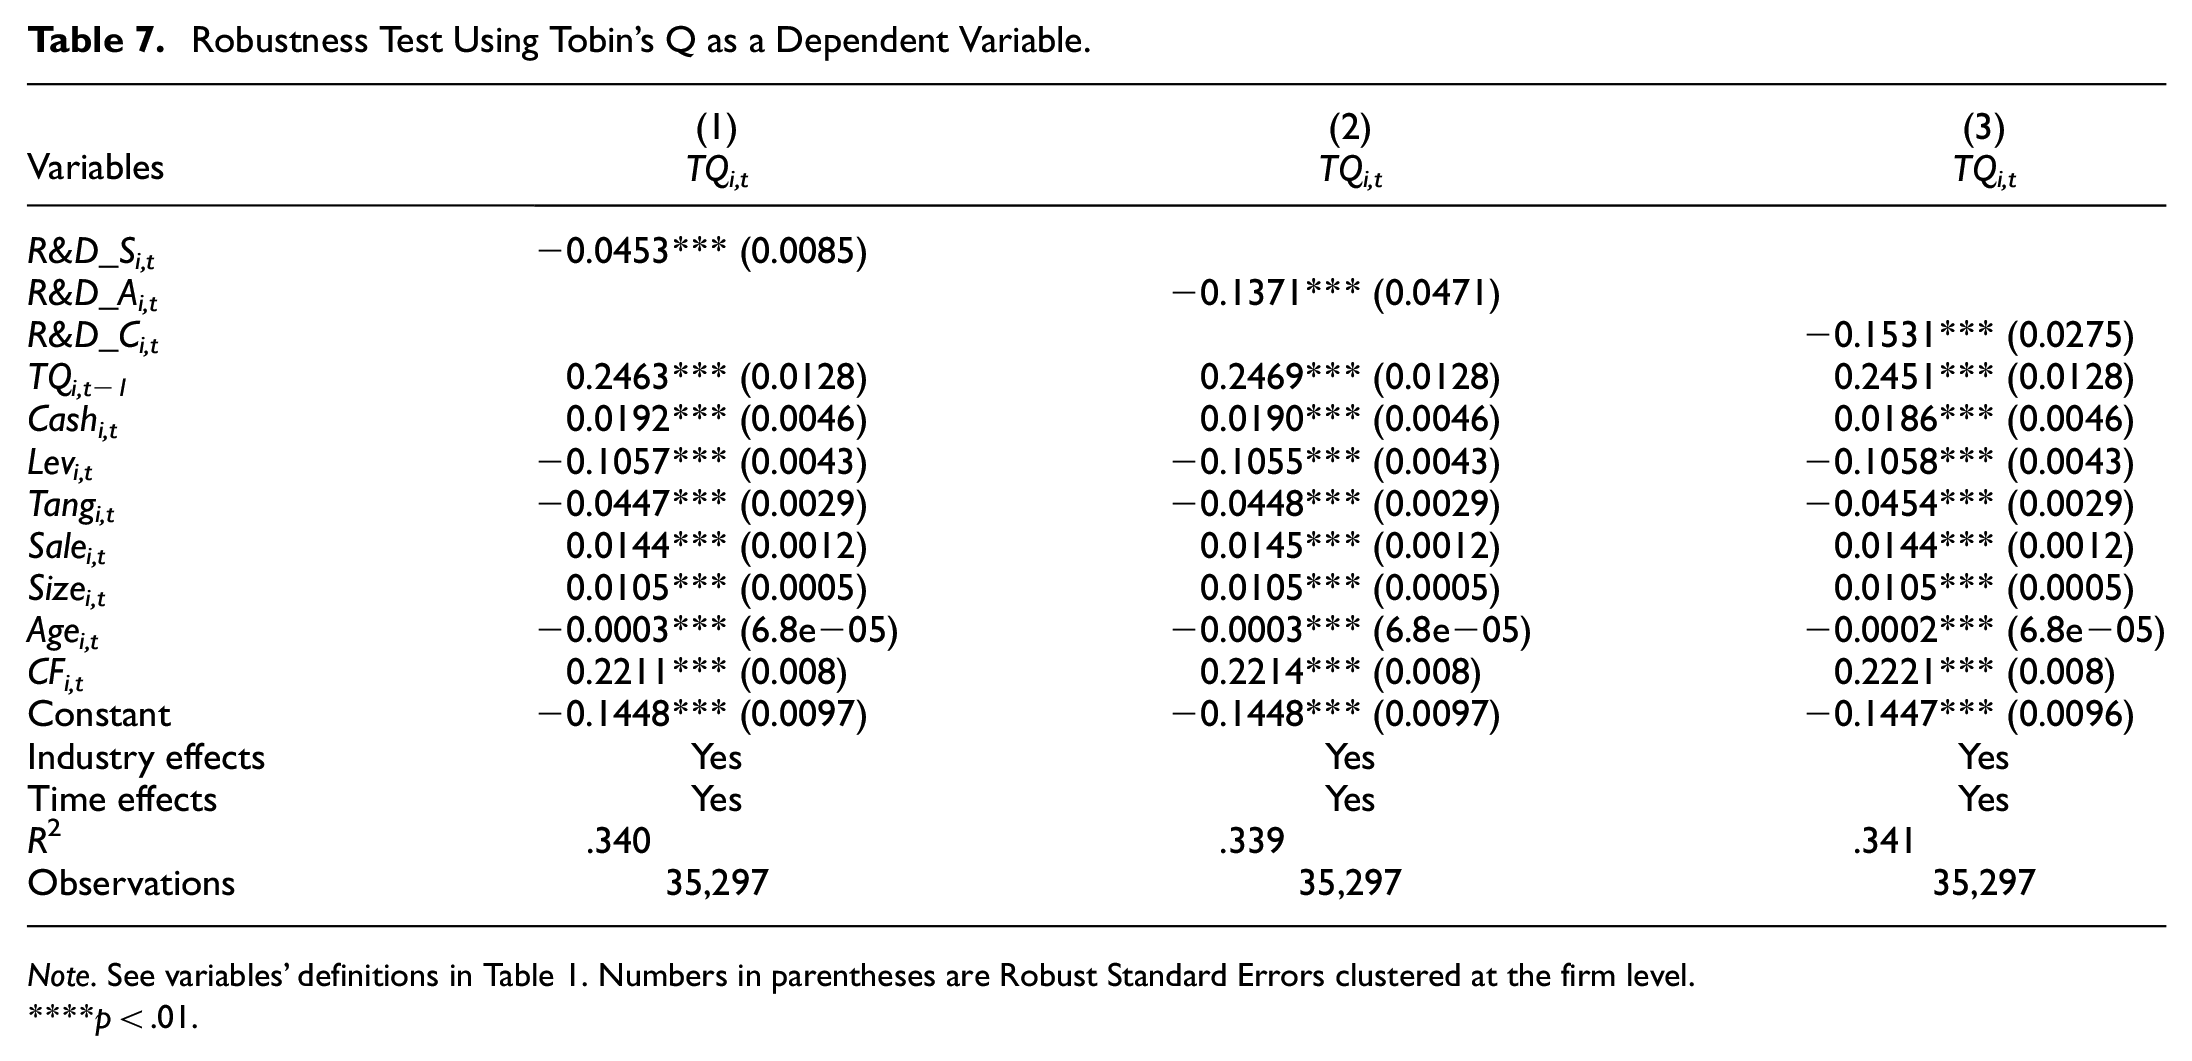
Testing Robustness Using Tobin’s Q as a Dependent Variable
Following the literature (Ferry et al., 2023; Kim et al., 2018; Ullah et al., 2019), we consider Tobin’s Q as a market-based measure of firm performance for the robustness test. The findings shown in Table 7 confirm the previous results reported in Table 3, indicating that R&D_S, R&D_A, and R&D_C adversely influence firm performance. The results of the control variables are also consistent, confirming that a different performance proxy does not affect our findings.
Robustness Test Using Tobin’s Q as a Dependent Variable.
Note. See variables’ definitions in Table 1. Numbers in parentheses are Robust Standard Errors clustered at the firm level.
p < .01.
Testing Robustness Employing Fixed Effect Model
To account for factors that are firm-specific but unobserved, we re-estimate our main model by employing the fixed effect model. The findings in Table 8 show that R&D_S, R&D_A, and R&D_C negatively impact performance. These results concur with those presented in Table 3. The results imply that the R&D–performance nexus persists after controlling for firm-specific characteristics.
Robustness Test Employing Fixed Effect Model.

Note. The variables are defined in Table 1. Numbers in parentheses are Robust Standard Errors clustered at the firm level.
p < .1. ***p < .01.
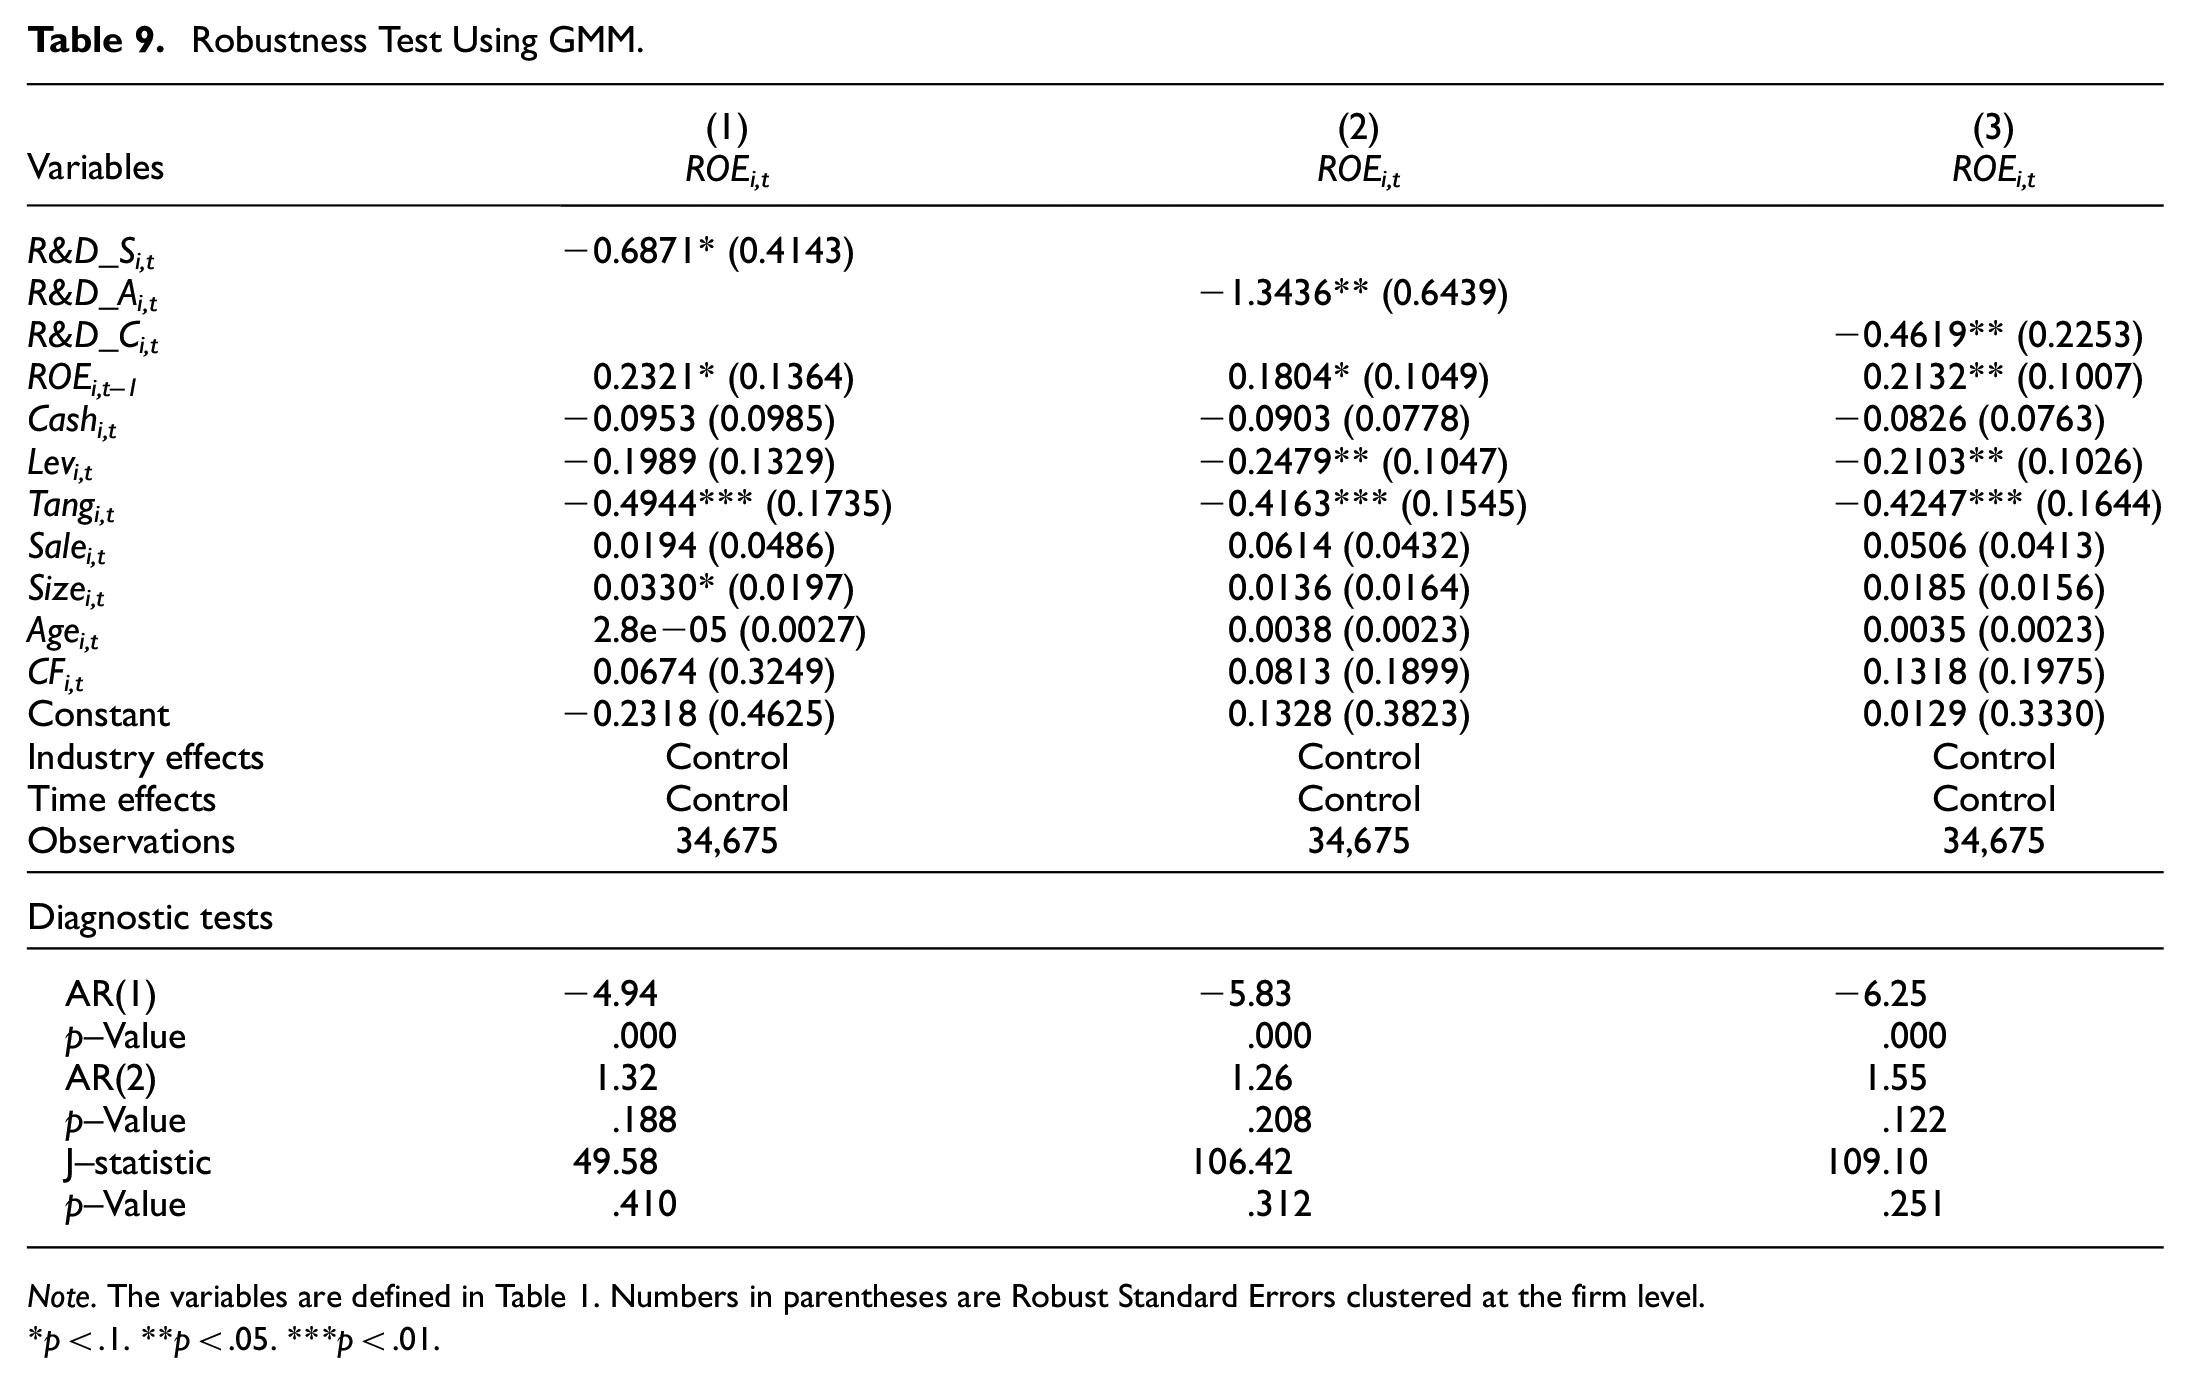
Testing Robustness Using GMM
We re-estimate our primary model by employing a two-step system GMM approach to account for endogeneity. The results reported in Table 9 corroborate the findings stated in Table 3, indicating that R&D_S, R&D_A, and R&D_C have a detrimental effect on performance. The findings show that the R&D–performance nexus remains persistent after controlling for the endogeneity.
Robustness Test Using GMM.
Note. The variables are defined in Table 1. Numbers in parentheses are Robust Standard Errors clustered at the firm level.
p < .1. **p < .05. ***p < .01.
Omitted Variables Concern
We analyze the impact threshold of a confounding variable (ITCV) to rule out the concerns of endogeneity from omitted variables (including the variables which are variant over time). The ITCV assess how strongly correlated an omitted variable would overturn the results of our analyses (He & Marginson, 2020; Hill et al., 2021; Xu et al., 2019). This analysis provides scholars with a sensitivity analysis of how high the estimate of an omitted variable/confounding variable would have to be to alter the findings of a statistical analysis.
Specifically, we followed Frank et al. (2013) by estimating the threshold for percent bias to invalidate the inference. As shown in Figure 2, to invalidate the inference, 52.24% of cases (20081) would have to be replaced with cases with an effect equal to 0. This figure suggests that omitted variable endogeneity does not seriously affect our regression results.

Percent bias to invalidate the inference for the effect of R&D.
Additional Analyses: Moderating Impact of Firm Growth, Financial Constraints, Stock Option Holdings by Executives, and Patent Protection on the R&D–Performance Nexus
Table 10 reports the findings for the moderating effect of firm growth, financial constraints, and stock option holdings by executives on the association between R&D and firm performance. Consistent with the findings reported in Table 3, the impact of R&D remains significantly negative in all three columns. Moreover, column (1) shows a significant positive impact of firm growth (FG) on performance. Firm growth is measured as the growth of sales (Ayaydin & Karaaslan, 2014; Bae et al., 2008). We find that the interaction term of R&D and firm growth (R&D_S × FG) has a significantly positive coefficient, illustrating that firm growth mitigates the adverse influence of R&D on corporate performance. These findings suggest that firm growth can affect the returns on R&D investment by influencing the availability of resources for R&D investment. Growing firms may have more resources and capabilities to invest in R&D, leading to higher returns on investment and better performance.
Moderating Impact of Firm Growth, Financial Constraints, Stock Option Holdings by Executives, and Patent Protection on the R&D–Performance Nexus.

Note. See variables’ definitions in Table 1. FG is the firm’s growth. FC is financial constraints measured as KZ Index. StEx is stock options held by executives. Patent is the number of patents. Numbers in parentheses are Robust Standard Errors clustered at the firm level.
p < .1. **p < .05. ***p < .01.
On the other hand, firms that are not growing may struggle to generate the same returns on R&D investment because of resource constraints. It is well established that R&D investment requires significant resources, including financial, human, and technological resources. Therefore, the more resources a firm has, the more it can invest in R&D, which can lead to higher returns on R&D investment and better performance. The stage of growth can also moderate the relationship between R&D investment and firm performance. For example, firms in the early stages of growth may be more focused on survival and may not have the resources to invest in R&D. Therefore, R&D investment may not have a significant impact on firm performance in these firms, as the priority is to survive in the market. On the other hand, firms that are in a mature stage of growth may have more resources and capabilities to invest in R&D, and as a result, R&D investment can have a more significant impact on firm performance.
Column (2) shows that the direct impact of financial constraints (FC) on a firm’s performance is negative (significant at 1%). Financial constraints is measured by the KZ index (Kaplan & Zingales, 1997). Furthermore, the coefficient for the interaction term between R&D and financial constraints (R&D_S × FC) appears negative and statistically significant, showing that financial constraints intensify the negative impact of R&D on corporate performance. These findings imply that firms that are financially constrained may struggle to invest in R&D and other growth opportunities, which can limit their ability to innovate and improve their performance. Financial constraints can also lead to a lack of diversification and a focus on short-term goals at the expense of long-term growth. Additionally, financially constrained firms may not have the resources to invest in the necessary infrastructure, equipment, and personnel to support R&D activities, which can also limit their ability to innovate and improve their performance. Financially constrained firms may likewise be at a disadvantage when competing with firms that have better access to capital, as they may not be able to invest in the same level of R&D or other growth opportunities. In conclusion, financial constraints can have a negative impact on a firm’s ability to invest in R&D and other growth opportunities, which can limit its ability to innovate and improve its performance. Therefore, it is important for firms to have access to adequate financing to support their R&D activities and growth initiatives.
Column (3) indicates a significant positive influence of stock option holdings by executives (StEx) on corporate performance. Stock option holdings by executives is measured as the number of stock options held by executives divided by the total number of shares (Cui & Mak, 2002). Moreover, the interaction term of R&D and stock option holdings by executives (R&D_S × StEx) has a significantly positive coefficient, showing that stock option holdings by executives alleviate the negative impact of R&D on firm performance. These results suggest that holding stock options can have an impact on the behavior of executives and their decision-making. For example, stock options align the interests of executives with those of shareholders, as executives’ wealth is tied to the performance of the company’s stock. This alignment can lead to executives making decisions that are in the best interest of shareholders, which can improve the firm’s performance. Executives with stock options may also have a short-term focus, as they may be more interested in increasing the value of their stock options in the short term instead of focusing on a long-term strategy. However, it is also possible that executives with stock options may be more likely to make decisions that will benefit the long-term growth and success of the company, as the value of their stock options is tied to the performance of the company’s stock over time.
We measure patent protection as the natural logarithm of the number of patents registered by a firm during a year (Tsao et al., 2015). We find a significant positive coefficient for the interaction term of R&D and patent protection (R&D_S × Patent) in column (4), showing that patent protection alleviates the adverse influence of R&D on corporate performance. These results suggest that patent protection can provide a “barrier to entry” for competitors, allowing firms that invest in R&D to reap the benefits of their investments for a longer period of time. Moreover, patent protection can provide an incentive for firms to invest in R&D, as the potential returns on their investments are protected. Therefore, this can also lead to a positive moderating impact on the relationship between R&D investments and firm performance.
Conclusion
This study investigates the impact of R&D spending on firm performance as well as whether and how state ownership moderates the R&D–performance association. It also explores the moderating influence of product market competition on the R&D–performance nexus for firms of different natures. This study uses an unbalanced dataset of Chinese listed firms spanning 2000 to 2020 and employs three estimating assumptions, including pooled OLS, fixed-effect model, and the DPD approach (i.e., robust two-step system-GMM), to account for endogeneity problems.
The notable findings show a significant adverse influence of R&D expenditure on corporate performance. Furthermore, the negative effect of R&D on the firm performance is positively moderated by state ownership. We likewise observe that PMC deteriorates the adverse R&D–performance nexus, with the impact being more pronounced for SOEs. This is based on the fact that SOEs (compared to non-SOEs) are assisted and subsidized by the government under high market competition.
A higher level of spending on R&D is correlated with a lower level of operating profit because R&D expenses reduce the operating profit. Therefore, firms lower their R&D spending and wait for further information to avoid financial loss and perform better. Our results add to the literature on real options theory by demonstrating that corporations prefer to decrease R&D expenses. A substantial amount of R&D initiatives include irreversible capital (e.g., expenses for equipment, materials, and personnel salaries) that cannot be recovered in the event of project failure. Consequently, firms mitigate their loss by delaying investing in R&D projects and waiting for more information about market conditions. This effect is more magnified for SOEs. Moreover, when a company involved in an innovative race accomplishes an R&D initiative, other companies in the same intensely competitive sector cease identical initiatives and lose additional advantages since a breakthrough eliminates the need for duplicating operations. Therefore, the current study advances the research on the influence of competitiveness on business practice. The results demonstrate a mechanism that prior studies have not examined, that is, competition has a significant moderating impact on the relation between R&D and performance. Our findings also demonstrate that different types of firms have different levels of the moderating influence of competition on the R&D–performance relationship. These findings advance the literature in this area by indicating that state ownership is a vital feature that might attenuate the detrimental impact of R&D expenses on performance under high competition.
The findings of this study have substantial implications for policymakers, managers, and investors. First, this study asserts that it is imperative for corporations to carefully plan their R&D expenditures since R&D expenses may adversely impact firm performance. Second, this study demonstrates that state ownership impacts the R&D–performance nexus. Consequently, the findings have implications for policymakers in emerging economies, particularly state-dominated and state-controlled ones. Our findings suggest that product market competition may enhance the efficacy of R&D spending, which might eventually lead to greater investment in innovative projects by firms. Finally, our research has substantial managerial implications by arguing that competition is a significant moderator of the R&D–performance nexus for SOEs.
Footnotes
Appendix

Declaration of Conflicting Interests
The author(s) declared no potential conflicts of interest with respect to the research, authorship, and/or publication of this article.
Funding
The author(s) received no financial support for the research, authorship, and/or publication of this article.