
Abstract
National innovation is important for driving a country’s long-term economic growth and identifying social problem solutions. However, while some countries maintain favorable policies for promoting innovation, some seem to fall behind. In addition, a country’s innovation policies may change over time. In this study, we examine when and why policy-makers change innovation policies. Specifically, we draw on performance feedback theory to theorize how aspirations for national innovation may affect a country’s innovation policies. Based on the data of member states of the Organization for Economic Co-operation and Development (OECD), we find that when national innovation output is below the level of aspiration, policy-makers improve policies to attract private R&D investment (expand public R&D investment) if national private R&D investment (national public R&D investment) is also below the aspiration levels. However, the shortfalls in national private or public R&D investment alone do not motivate policy-makers to take any action. Such findings provide strong implications for policy-makers and innovators in both the private and public sectors.
Keywords
Introduction
National innovation is defined as the ability of a country to generate novelty in information and technology (Allard & Williams, 2020). It is important for the long-term economic growth of a country (K. Lee et al., 2021), as it increases productivity by using new ways to combine raw materials, optimizing production processes, and improving the end product quality (Helpman, 1992; Khalil & Ezzat, 2005; Romer, 1990). In addition, national innovation can contribute more than just economically. For example, it helps to offer answers to social problems such as pollution and national defense (Borrás & Edquist, 2013; Osei & Zhuang, 2020).
R&D investment is necessary for driving a country’s innovation (Furman & Hayes, 2004; Furman et al., 2002; Hu & Mathews, 2005, 2008; Young et al., 2020). There are two major types of R&D investment: public R&D investment funded by the government and private R&D investment funded by the private sector. While both types of R&D investment are subject to national policy changes (S. H. Lee & Yoo, 2007; Miravitlles et al., 2017; Rikap, 2022), the determinants of such policy changes are still unclear. This study contributes to helping us further understand when and why policy-makers adjust R&D or innovation policies. Considering that location choice significantly influences the innovation performance of the private sector (Piperopoulos et al., 2018), this study can also help business firms, research institutes, and entrepreneurs predict future policies and decide where to conduct their R&D activities internationally.
This study draws on performance feedback theory in the organizational literature to theorize how aspirations for national innovation influence authorities’ corresponding R&D policies. According to performance feedback theory, the situation in which performance falls below aspiration causes dissatisfaction among decision-makers, who will then take action to solve the performance problem (Cyert & March, 1963; Kotiloglu et al., 2021). Our key proposition is that when national innovation output falls below the level of aspiration, policy-makers may expand public R&D investment and improve policies to attract private R&D investment, interactively conditional on the current level of national private or public R&D investment.
Examining 31 member states of the Organization for Economic Co-operation and Development (OECD), this study finds that when the shortfalls in national innovation output are greater, these member states, on average, are more likely to enforce intellectual property rights to activate private R&D investment. Contrary to our expectations, on average, they do not expand public R&D investment. However, interaction analyses show that greater national innovation output’s shortfalls will lead policy-makers to increase private (public) R&D investment measures if the shortfalls in national private (public) R&D investment are larger. Finally, we show that these governments do not respond to the shortfalls in national public and private R&D investment, which may influence the national innovation output in the future.
Theoretical Development
Aspirations for National Innovation Output and R&D Investment
Given the abovementioned benefits of national innovation, both developed and developing countries may maintain national innovation goals (Khalil & Ezzat, 2005; S. H. Lee & Yoo, 2007; Mytelka & Smith, 2002). For example, in 2007, U.S. President Bush signed The America Creating Opportunities to Meaningfully Promote Excellence in Technology, Education, and Science Act to maintain the status of the U.S. as the most innovative nation around the world. From 2001 to 2006, Mexico conducted the Special Programme on Science and Technology to stimulate innovation in the country (Gonzalez-Brambila et al., 2007). According to China’s 2011 to 2015 five-year plan, ambition targets were set at the national level for the number of patent applications (Harris, 2012).
Performance feedback theory delineates the mechanism linking goal performance and organizational changes (Kotiloglu et al., 2021). Due to the bounded rationality of decision-makers (March & Simon, 1958; Simon, 1947), they prefer to use the level of aspiration as a reference point to determine goal success and failure (Shinkle, 2012). The presence of surplus (i.e., performance above the level of aspiration) leads decision-makers to believe that the status quo is optimal. In contrast, a shortfall (i.e., performance below the level of aspiration) indicates the existence of problems and leads decision-makers to look for solutions (Billinger et al., 2021). The search will stop when satisfactory solutions are found (Cyert & March, 1963).
Performance feedback theory has been applied to state government decisions (e.g., Jones, 2003; Jones & Baumgartner, 2005; Simon, 1995; Zhang, 2021). For example, based on Anderson and McKeown’s (1987) research, policy-makers maintain aspirations for the shares of world capacity and use performance feedback to determine the necessity of launching wars. Consistently, this study argues that policy-makers who value national innovation develop aspirations for national innovation and use performance feedback to decide whether the existing innovation policies are optimal. Specifically, if there is a shortfall in national innovation output, it may cost policy-makers support from constituencies that value national innovation, such as firms, research institutes, and economists. Poor performance in national innovation also jeopardizes future economic growth (Helpman, 1992; Romer, 1990). Hence, policy-makers may begin the process of problemistic search for effective solutions and change relevant policies.
Increasing public and private R&D investment have been proven to be an effective solution by past research (Eaton & Kortum, 1996; Furman & Hayes, 2004; Furman et al., 2002; Hu & Mathews, 2005, 2008; Yan et al., 2022). When considering the generation of countable innovation outputs, such as trademarks and patents, private R&D investment is more economically efficient than public R&D investment because the former carries higher personal risks (Griliches, 1995). However, public R&D investment performs in a different way, which mainly takes the form of funding for public research institutions and universities, as well as subsidies and contracts for private sector companies (Tang et al., 2014). Though less economically efficient, public R&D projects tend to produce greater social returns (Buisseret et al., 1995; David et al., 2000; Feldman & Kelley, 2006; Sánchez-Sellero & Bataineh, 2022).
We predict that when national innovation output shows shortfalls, on average, policy-makers may respond by both improving policies to attract more private R&D investment and expanding public R&D investment. Policy-makers can use the shortfalls to justify proposals for these policy changes that need to be reviewed and approved by veto players. 1 Another point performance feedback theory provides is that the expansion of the shortfalls enlarges problemistic searches and promotes greater organizational changes (Greve, 1998; Kotiloglu et al., 2021). Therefore, we predict the following:
If public and private R&D investments are the necessary input of national innovation, they can be considered the means goals for the end goal of national innovation in a goal hierarchy (Greve, 2010; Mazzelli et al., 2019). We argue that policy-makers may also maintain aspirations for these two means goals. A notorious example is the European Union’s target for the proportion of GDP devoted to research and development by 2020, which specifies that 1% comes from public sources and 2% come from the private sector. 2 Drawing on performance feedback theory, we argue that as the shortfalls in national private and public R&D investment increase, policy-makers may respond by improving policies to attract private R&D investment and expanding public R&D investment, respectively. We hypothesize as follows:
Solution Choice for Shortfalls in National Innovation Output
H1a and H1b argue that policy-makers, on average, may improve policies to increase private R&D investment and expand public R&D investment to address the shortfalls in national innovation. However, the preferences for these two solutions are likely to vary on different occasions (Borrás & Edquist, 2013). Cyert and March (1963) posited that problemistic search occurs near the symptoms of the problem, which explains why the selected solutions probably target the mainspring of the problems. We, therefore, argue that when devoting attention to explaining and predicting the preferred solution, mainly about whether public R&D investment should be expanded or actions should be taken to attract private R&D investment, it is important to understand policy-makers’ attributions concerning the shortfalls in national innovation output (Hui, 2016).
Specifically, when national innovation output and private R&D investment fail to reach the levels of aspiration simultaneously, policy-makers may believe that shortfalls in national private R&D investment are the main reason for performance shortfalls in national innovation output. In this case, policy-makers may be more likely to improve policies to attract private R&D investment to narrow the shortfalls in national innovation. We hypothesize as follows:
Similarly, when national innovation output and public R&D investment fail to reach the levels of aspiration simultaneously, policy-makers may tend to believe that inadequate national public R&D investment is the main reason for performance shortfalls in national innovation output. The preference for choosing to expand subsequent public R&D investment as the solution to the shortfalls in national innovation output may increase.
Method
Sample
The hypotheses were tested using a sample of 31 OECD member states from 1985 to 2010. OECD countries were chosen because the OECD has been highlighting the importance of national innovation (Mytelka & Smith, 2002). 3 Membership in the OECD is subject to a strict review process. Member states must have their science and technology policies conform to the core principles of the Committee for Scientific and Technological Policy. For example, they should promote the development of science and technology, create an enabling environment for the generation of policies that encourage and protect innovation, and support the acquisition and dissemination of knowledge. The OECD Directorate for Science, Technology and Industry (DSTI) would also provide member states with policy advice. We thus believe that OECD member states have the motivation and ability to pursue national innovation goals. Another advantage of using this sample is that the DSTI releases reliable data on the innovation activities of member states (OECD, 2011).
Dependent Variables
Policies to Attract Private R&D Investment
We used two variables, namely, intellectual property rights enforcement and legal environments for technology. The data were from the Institute for Management Development (IMD) World Competitiveness Reports, which have been used substantially by national innovation research (e.g., Andreeva et al., 2021; Furman & Hayes, 2004; Furman et al., 2002; Hu & Mathews, 2005, 2008). The IMD surveys senior business executives in a sample of countries annually. These executives have worked for a company with international business, so they could answer the survey questions regarding the institutional environments of the country in which they have lived or worked for the past year by drawing on the wealth of their international experience. The sample of the survey is statistically representative as the IMD considered the industrial distribution and significance of a country when it distributed the survey to respondents in that country. In 2010, around 4,000 executives from 58 countries responded to the survey.
The survey question for measuring intellectual property rights enforcement is “intellectual property rights are fully enforced.” The survey responses (on a 0–10 scale) were adjusted for a 2-year moving average (t + 1 and t + 2) in this study. The survey question for measuring legal environments for technology is “the legal environment supports the development and application of technology.” The survey responses (on a 0–10 scale) were also adjusted for a 2-year moving average (years t + 1 and t + 2) in this study. We chose these two measures because R&D investment is often costly and risky. Private sectors are unwilling to invest in R&D unless their R&D outcomes are protected from plagiarism and counterfeits. However, governments can strengthen firms’ incentives to invest in R&D by enforcing intellectual property rights and constructing a legal environment that protects technological innovation, so firms can better appropriate economic rents from their R&D investment (Borrás & Edquist, 2013). In addition, law systems that are stable and encourage free and competitive markets can also promote private R&D investment. Therefore, a higher value of intellectual property rights enforcement or legal environments for technology means a greater degree to which policy-makers improve policies to attract private R&D investment.
Subsequent Public R&D Investment
The 2-year moving average (t + 1 and t + 2) of government-funded R&D investment divided by the GDP of the focal state was taken as the measurement. The data were acquired from the OECD Main Science and Technology Indicators (MSTI) database.
Independent and Control Variables
Performance Gap in National Innovation Output
In the absence of a perfect measurement for national innovation output, Acs et al. (2002) propose a compromise, which is using the number of patents as a proxy. 5 The OECD reported three kinds of patents that have been widely used in previous studies—European Patent Office (EPO) patents, United States Patent and Trademark Office (USPTO) patents, and Triadic patents (i.e., patents filed at both the USPTO, EPO, and Japanese Patent Office). Using them to measure the national innovation output of OECD member states appears to make sense, as policy-makers and constituencies in OECD member states are likely to observe and use the same patent indicators for their decision-making (Borrás & Edquist, 2013; de Rassenfosse & van Pottelsberghe de la Potterie, 2009). In this study, we opted for Triadic patents because such patents do not suffer from the problem of home bias like EPO and USPTO patents do. 6 In addition, the cost of applying for a patent in all three patent offices, including considerable time and financial costs, is usually high, and the granting process of the three patent offices will undergo rigorous scrutiny. For these reasons, many of the innovations involved in Triadic patents have commercial or social significance (de Rassenfosse & van Pottelsberghe de la Potterie, 2009; Häggmark & Elofsson, 2022). As such, national innovation output was measured as the number of Triadic patents granted to applicants from the focal country in year t.
Anderson and McKeown (1987) have shown that historical performance can be used for measuring the level of aspiration of state governments. However, this approach ignores the factor of social performance. This study takes into account the competitive factor; that is, other OECD member countries act as a reference group and compete in terms of national innovation output (Furman & Hayes, 2004). We applied the switching model first developed by Bromiley (1991) and later confirmed by Bromiley and Harris (2014). The switching model suggests that on the one hand, organizations with performance below the average of their peers tend to use the average performance as the level of aspiration. This proposition makes sense as some countries have been catching up with other countries in terms of national innovation (Furman & Hayes, 2004; Khalil & Ezzat, 2005; Lundvall & Rikap, 2022; Mathews, 2001). On the other hand, organizations with performance above the average are unlikely to aspire to an average performance that is even lower than their performance. They may choose historical performance as the benchmark combined with some upward adjustments. Therefore, the switching model can logically take into account both historical and social performances. The formulas for the switching model are as follows:
If National innovation outputi, t−1 < Peer national innovation outputi, t−1, then National innovation output aspirationi, t = Peer national innovation outputi,
t−1 or If National innovation outputi, t−1 > Peer Performance outputi, t−1, then National innovation output aspirationi, t = a*national innovation outputi, t−1
Peer national innovation output was the median number of Triadic patents of OECD member states; i is the focal country; t indicates year; and a is a possible upward adjustment factor for historical performance. In a sample of business firms, Bromiley (1991) used 1.05 for a; however, this value may not apply to our context of state governments. We searched from 1.01 to 1.20 in increments of 0.01 to reestimate the value of a. The final value of a is determined by the highest goodness of fit of our fixed effect models, namely, the size of the R-square. The final result is 1.13. 7
Based on this switching model, the number of Triadic patents minus the level of aspiration would be the value of the performance gap in the national innovation output of the focus country in year t. Following the standard practice in the performance feedback literature, we applied the spline function (Greene, 1993). Specifically, we split the variable of performance gap in national innovation output into two variables: shortfalls in national innovation output and surplus in national innovation output. Shortfalls (surplus) in national innovation output was set at 0 when the number of Triadic patents was above (below) the level of aspiration and was set at the number of Triadic patents minus the level of aspiration when the number of Triadic patents was below (above) the level of aspiration. Shortfalls in national innovation output would be the key independent variable for hypothesis development. The data were from the OECD MSTI database.
Performance Gap in National Private R&D Investment
National private R&D investment was calculated by dividing total R&D investment funded by the focus country’s private sector by the GDP of the focal country in year t. For the level of aspiration for national private R&D investment, the following switching model was used to estimate it:
If National Private R&Di, t−1 < Peer National Private R&Di, t−1, then National Private R&D Aspirationi, t = Peer National Private R&Di,t−1 or If National Private R&Di, t−1 > Peer National Private R&Di, t−1, then National Private R&D Aspirationi, t = a*National Private R&Di, t−1
Peer National Private R&D was the median level of national private R&D investment of OECD member states; i is the focal country; t indicates year; and when a was 1.00, there was the best overall model fit. 8
We measured the performance gap in national private R&D investment as national private R&D investment minus the level of aspiration in year t. Through the analysis of the spline function, surplus in national private R&D investment and shortfalls in national private R&D investment were calculated. H2 was tested using shortfalls in national private R&D investment, and H3a was tested using the interaction term between it and shortfalls in national innovation output.
Performance Gap in Public R&D Investment
National public R&D investment was calculated by dividing the amount of R&D investment funded by the government by the GDP of the focal state in year t. For the level of aspiration, the switching model was used.
If Public R&Di, t−1 < Peer Public R&Di, t−1, then Public R&D Aspirationi, t = Peer Public R&Di,t−1 or If Public R&Di, t−1 > Peer Public R&Di, t−1, then Public R&D Aspirationi, t = a*Public R&Di, t−1
Peer public R&D was the median level of public R&D investment of OECD member states; i is the focal country; t indicates year; and when a was 1.00, there was the best overall model fit. 9
We measured the performance gap in national public R&D investment as national public R&D investment minus the level of aspiration in year t. As we did before, we calculated surplus in public R&D investment and shortfalls in public R&D investment through the analysis of the spline function of this variable. H2b was tested using shortfalls in public R&D investment, and its interaction term with shortfalls in national innovation output was used to examine H3b.
Controls
The first set of control variables is related to country-level economic characteristics. Economic development and foreign direct investment (FDI) may be positively associated with a state’s emphasis on national innovation. Therefore, we included GDP per capita (in constant U.S. dollars), net FDI inflows (divided by the focal state’s GDP), and net FDI outflows (divided by the focal state’s GDP). We took into account the financial status of the focal country by including its financial reserves (i.e., the total value of the focal country’s monetary gold holdings, special drawing rights, reserves of International Monetary Fund (IMF) members held by the IMF, and foreign exchange holdings under the control of monetary authorities divided by the focal country’s GDP) because state governments with more financial resources might be able to spend more on public R&D investment. To control for the demographic structure of the focal state, we entered the proportion of employment in industry (industry employment) and the logarithm of population. On the one hand, firms from the second and tertiary sectors usually invest more in R&D, compared to those in the primary sector. On the other hand, a country with a huge population represents an attractive market for the private and public sectors to invest in R&D for competition. We included the tertiary education enrollment rate (percentage of the population), as well as the number of researchers (per thousand labor force) to take into account the innovation ability of a country (Allard & Williams, 2020). Among these control variables, the data for researchers were acquired from the OECD MSTI, while the data for others were acquired from the World Bank indicators database.
We have also taken into consideration political factors. The significance of national innovation goals and preferences for different policy tools may be influenced by government ideology (Borrás & Edquist, 2013). While it was difficult to directly measure a state government’s ideology for national innovation, we used a proxy, namely, the economic policy orientation of the leading political party in the focal state. This proxy can be in one of the following groups based on the classification of Quality of Government (QoG) OECD dataset (Teorell et al., 2016): (1) communist, socialist, social democratic, or left-wing, (2) conservative, Christian democratic, or right-wing, (3) centrist, and (4) others. Accordingly, we included three dummies, left-wing, right-wing, and centrist in our regression models. In addition, strong political checks and balances tend to increase the difficulty of and the time required for policy changes (Henisz, 2002), and a stable political environment can allow firms to predict the return of R&D more confidently. We thus included the POLCON index of Henisz (2002). A higher value of this index refers to a political structure with stronger checks and balances. Finally, past research has shown that policies are likely to be deliberately modified in election years because national governments that have the goal of winning the election will cater to voters’ preferences (Chan et al., 2020). For example, national governments may launch favorable policies for innovation to win the support of firms and other relevant voters. Therefore, we added election year which is a dummy variable set to be 1 if year t is 1 year before the year of a parliamentary or presidential election and a value of 0 otherwise. The data for election year were from the International Institute for Democracy and Electoral Assistance’s Global Database on Elections and Democracy.
As a reminder, controls and independent variables were measured in year t, whereas the dependent variables were measured in t + 1 and t + 2 (i.e., a 2-year moving average forward). That was done to avoid the problem of reverse causality. To further reduce the chance of reverse causality, we conducted two robustness tests. The first was to enlarge the time lag between the dependent variables and independent variables. Specifically, the independent variables were measured in t−1. The second robustness test was to include a lagged dependent variable in each regression model. Overall, our results for hypothesis testing do not change.
Model
Country-year was the analysis unit in our panel data. Country-fixed effects were included in the analyses to control for undetected heterogeneity among countries and to reduce the concerns of omitted variable bias. We further included year dummy variables to control for macroenvironmental changes. Finally, robust standard errors were applied to solve the problem of possible heteroscedasticity or within-panel serial correlation of idiosyncratic error items. We used STATA 14 with the command xtreg to analyze the data.
Results
The descriptive statistics of all variables and correlation analysis are shown in Table 1. The fixed effects regression results are reported in Table 2, which predicts intellectual property rights enforcement in Models 1 to 3, legal environments for technology in Models 4 to 6, and subsequent public R&D investment in Models 7 to 9.
Descriptive Statistics of All Variables and Correlations.

Note. Correlations with an absolute value larger than .14 are significant at the .05 level (two-tailed).
Results of Fixed-Effects Regressions.

Note. Standard errors are in parentheses.
p < .10. *p < .05. **p < .01 (two-tailed).
H1a suggests that when the shortfalls in national innovation output are greater, the degree to which policy-makers improve policies to promote private R&D investment will be greater. The analyses show that the coefficient of shortfalls in national innovation output is significantly negative at the 0.05 level in Model 2 but not significant in Model 5. Therefore, it appears that policy-makers prefer to enhance the enforcement of intellectual property rights to cope with shortfalls in national innovation output.
H1b states that when the shortfalls in national innovation output are greater, policy-makers will expand public R&D investment. However, we can see that the coefficient of shortfalls in national innovation output is not significant in Model 8, failing to provide support for H1b.
H2a predicts policy-makers’ response to the shortfalls in national private R&D investment; that is, they may try to attract private R&D investment in different ways. However, this hypothesis is not supported. According to the results of Model 2 and Model 5, the coefficient of shortfalls in national private R&D investment is not significant.
H2b predicts policy-makers’ response to the shortfalls in national public R&D investment; that is, they may try to stimulate public R&D investment directly. However, this hypothesis is not supported. According to the results of Model 8, the coefficient of shortfalls in public R&D investment is positive and significant. This result is opposite to our expectations and reveals that policy-makers scale back public R&D investment when the shortfalls in public R&D investment increase.
We next discuss the results regarding the solution choice for shortfalls in national innovation output. H3a receives support in Model 3 about intellectual property rights enforcement, where the coefficient of the interaction term (shortfalls in national innovation output × shortfalls in national private R&D investment) is significant at the 5% level. Figure 1 visually shows the above interaction pattern. 10 As we can see, state governments with larger shortfalls in national private R&D investment would improve intellectual property rights enforcement to a greater extent when the shortfalls in national innovation output are larger. Moreover, simple slope analysis (Cohen et al., 2013) shows that the slope of the main relationship is negative and significant (b = −0.00072, p < .05) when the shortfalls in national private R&D investment are large. Practically, if the number of Triadic patents decreases from the level of aspiration by one standard deviation (SD), intellectual property rights enforcement improves by 0.47. However, when the shortfalls in national private R&D investment are 0, the slope of the main relationship is negative but marginally significant (b = −0.000093, p < .10). Practically, if the number of Triadic patents falls from the level of aspiration by one SD, intellectual property rights enforcement increases by only 0.06.

Interaction effects between shortfalls in national innovotion output and shortfalls in national private R&D investment on intellectual property rights enforcement (Model 3 in Table 2).
H3a also receives support in Model 6 about the legal environments for technological innovation because the coefficient of the interaction term (shortfalls in national innovation output × shortfalls in national private R&D investment) is significant at the 0.05 level. This interaction result is demonstrated in Figure 2, which shows that state governments with larger shortfalls in national private R&D investment would improve the legal environments for technology to a greater extent when the shortfalls in national innovation output are larger. According to simple slope analysis, the slope of the main relationship is negative and significant (b = −0.00074, p < .05) when the shortfalls in national private R&D investment are large. Practically, if the number of Triadic patents drops from the level of aspiration by one SD, legal environments for technology increase by 0.49. However, when the shortfalls in national private R&D investment are 0, the simple slope of the main relationship is not significant (b = −0.000067, n.s.).

Interaction effects between shortfalls in national innovotion output and shortfalls in national private R&D investment on legal environment for technology (Model 6 in Table 2).
H3b receives strong support in Model 9, as the coefficient of the concerning interaction variable (shortfalls in national innovation output × shortfalls in national public R&D investment) is significant at the 0.05 level. Figure 3 visually shows the above interaction pattern. As we can see, state governments with larger shortfalls in national public R&D investment would expand public R&D investment to a greater extent when the shortfalls in national innovation output are larger. National governments with 0 shortfalls in national public R&D investment instead decrease subsequent public R&D. Simple slope analysis shows that the slope of the main relationship is negative and significant (b = −0.00000042, p < .05) when the shortfalls in national public R&D investment are large. Practically, if the number of Triadic patents drops from the level of aspiration by one SD, the intensity of public R&D investment increases by 0.00028. However, when the shortfalls in public R&D investment are 0, the slope of the main relationship is significantly positive (b = 0.00000048, p < .05). Practically, if the number of Triadic patents decreases from the level of aspiration by SD, the intensity of public R&D investment decreases by 0.00032. This result indicates that only when the national public R&D target is not met is expanding public R&D investment used to resolve the problem of insufficient national innovation output.
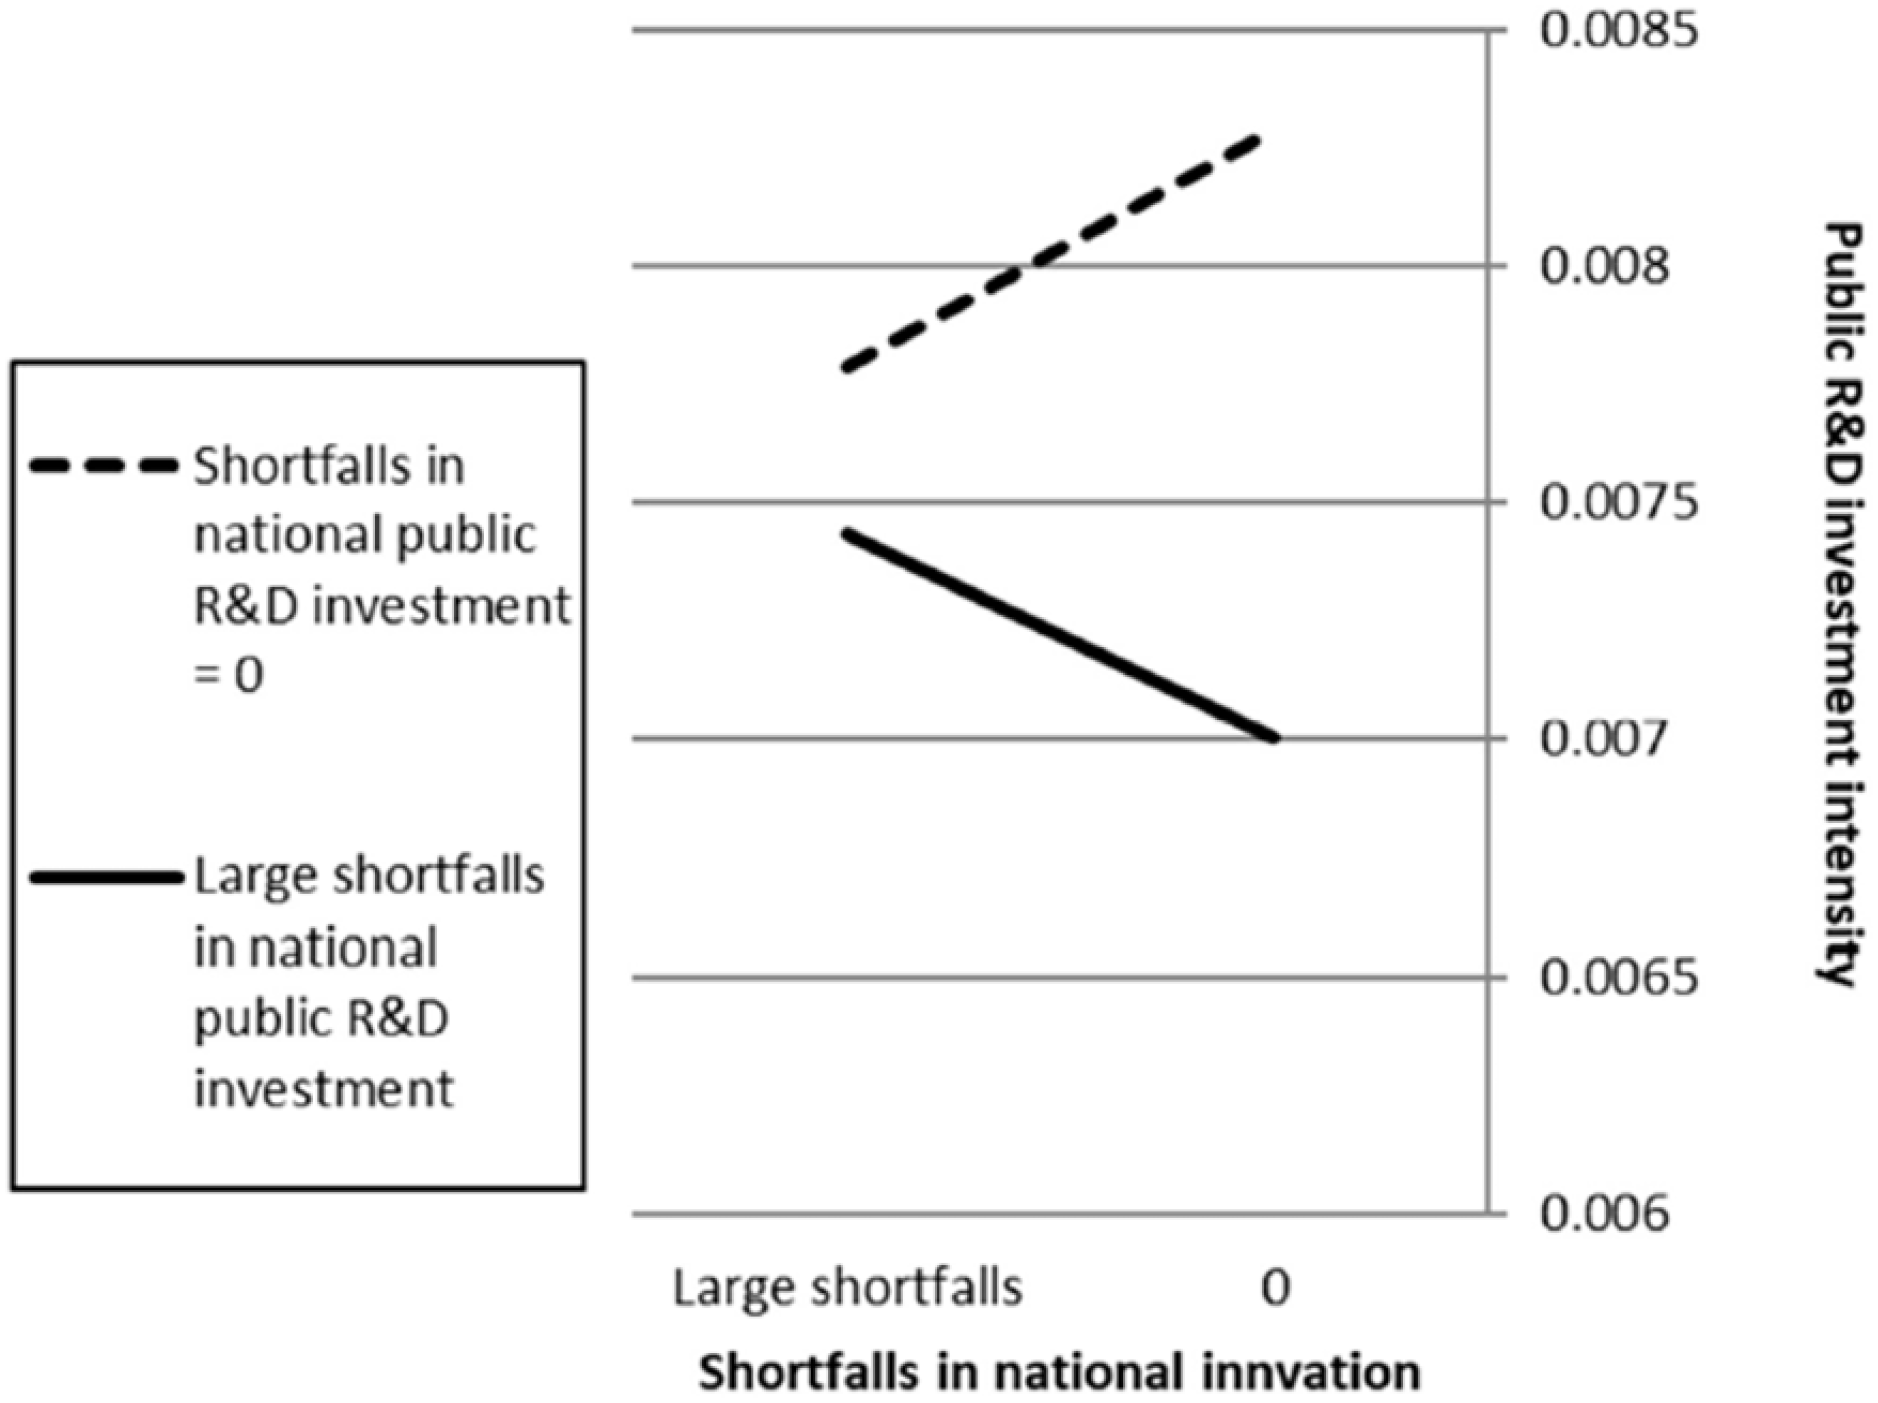
Interaction effects between shortfalls in national innovotion output and shortfalls in national public R&D on subsequent public R&D investment (Model 9 in Table 2).
Discussion
This study reveals the interaction effects between shortfalls in national innovation output and those in national R&D investment on innovation policy changes. Our analyses show that when national innovation output and national private R&D investment are simultaneously below the levels of aspiration, policy-makers attempt to cope with the shortfall problem in national innovation output by improving policies to attract private R&D investment, including improving intellectual property rights enforcement and legal environments for protecting technology. However, policy-makers prefer to expand public R&D investment directly to address the shortfall problem in national innovation output when both national innovation output and national public R&D input are lower than their aspiration levels.
In addition, we find that shortfalls in national private or public R&D investment alone seem to be insufficient to draw the attention of policy-makers and trigger policy changes. This result suggests that these means goals that are essential for the end goal of future national innovation output are not assigned a sufficiently high priority by policy-makers. Instead, policy-makers focus only on the end goal of national innovation output, possibly because it is more directly related to short-term economic or social benefits (Furman et al., 2002; Mytelka & Smith, 2002). As inadequate or persistently low national private and public R&D investment will lead to lower national innovation output in the future (as well as lower economic growth in the long term), our findings are consistent with Jones and Baumgartner (2005) who argue that states’ decisions are made to catch up with reality instead of preventing future problems. Put differently, policy-makers may be short-sighted and put the long-term competitiveness of their country at risk. As private and public investments are necessary to sustain future national innovation, even if the current national innovation output has reached the level of aspiration, policy-makers should also give the means goals of national private or public R&D investment a high priority and respond to their shortfalls.
Theoretically, this study explains innovation policy instruments’ changes from the perspective of performance feedback, thus advancing the literature on national innovation. Previous studies have explored the value of national innovation and the impact of different policies on national innovation (e.g., Borrás & Edquist, 2013; Ernst, 2005; Filippetti & Guy, 2020; Furman & Hayes, 2004; Furman et al., 2002; Mathews, 2001). Nevertheless, research on the factors that make policy-makers change innovation policies is still scarce (Hui, 2016). This study addresses this research gap by proposing a theory that policy changes are responses by policy-makers to the shortfalls in national innovation output and national R&D investment. Future research can explore other important determinants of national innovation policy changes, given the cross- and within-country variation in innovation policies.
This study also has important practical implications. The first implication for policy-makers is that they can predict the policy changes of other states by observing the performance gap in other states’ national innovation output and national R&D investment. Our findings show that other countries may use different policies to address their national innovation output shortfalls, depending on whether their private or public R&D investment is below the aspiration levels. These findings can help policy-makers design countermeasures earlier, which is important to compete successfully in the global innovation race.
Moreover, as mentioned above, we find that policy-makers are short-sighted as they generally do not respond to performance shortfalls in private and public R&D investment until national innovation output falls below the aspirations. However, it often takes a long time for R&D investments to be successfully transformed into innovation output. Thus, it may be too late for a country to increase R&D investments after suffering from national innovation output shortfalls, especially in the middle of the fierce global innovation competition. We urge that policy-makers should be more long-term oriented and place greater emphasis on the means goals of national private and public R&D investments because the shortfalls in these means goals will lead to a decline in the future national innovation output and economic growth.
In addition, our theory may help the private sector predict innovation policy changes so that they can decide better when and where international R&D activities should be launched. These predictions are important because research shows that location choices are critical for the innovation performance of the private sector (Piperopoulos et al., 2018). For example, firms can locate their new R&D facilities in countries with high aspirations for national innovation output but currently suffer from performance shortfalls in order to enjoy favorable policy changes.
Finally, constituents who value national innovation, such as scientists, business enterprises, and economists, can strategically increase policy-makers’ aspiration level to create shortfalls in national innovation output and promote policy changes (Nielsen, 2014). For example, they can attempt to convince or lobby international organizations such as the OECD and European Union to set a coercive level of aspiration for member states. In addition, they may use the shortfalls in national innovation output and R&D investment as leverage to negotiate with the governments for favorable policy changes.
Regarding the study’s limitations, readers need to be cautious when interpreting and applying our findings which are based on OECD countries. OECD countries often maintain innovation goals. Our theory and findings may not apply to non-OECD countries as they may not possess national innovation goals due to insufficiency of capabilities and resources. Furthermore, each country may have many national goals to pursue at the same time. Sometimes, the priority of national innovation goals may be too low to catch decision-makers’ attention. In that case, our theory and findings are also not applicable. Last, quantitative research such as the present study is only able to present evidence of outcomes deducted by the theory, but no evidence of the process. We call for qualitative research such as interviews and detailed examination of government reports to broaden our knowledge about when and why innovation policies change.
Footnotes
Acknowledgements
This paper is further developed based on the dissertation of the second author (Kent Ngan-Cheung Hui) at Michigan State University.
Declaration of Conflicting Interests
The author(s) declared no potential conflicts of interest with respect to the research, authorship, and/or publication of this article.
Funding
The author(s) received no financial support for the research, authorship, and/or publication of this article.