
Abstract
Many countries mandated social distancing measures during the COVID-19 pandemic of 2020 to 2022 that variously included opening hours restrictions on hospitality and retail, economy-wide closures, and additional international border controls. We analyzed whether more restrictive (hereafter, closures) or less restrictive (hereafter, openings) social distancing measures changed the short-term trends in the number of COVID-19 cases, hospitalizations, and ICU patients in Australia, Canada, and the United Kingdom. Our analysis uses a “before-and-after” trend analysis (decremental/incremental and growth/decay trends) to compare the trends of epidemic indicators before and after each closure or opening event. Results show that, in general, and for these three countries: (a) closures resulted in reduced trend growth in adverse COVID-19 public health outcomes and (b) openings resulted in increased trend growth for the three selected measures of public health.
Highlights
Temporal trend analysis, independent of statistical or structural assumptions, was used to evaluate the effects of COVID-19 public health outcomes from closures and their relaxation in Australia, Canada, and the United Kingdom over 2020 to 2021.
Closures, in general, were effective at reducing trend growth of COVID-19 infections in Australia, Canada and the United Kingdom over 2020 to 2021.
Relaxation of closures and easing of international border controls were associated with an increase in trend growth of COVID-19 infections in Australia, Canada, and the United Kingdom over 2020 to 2021.
Introduction
COVID-19, caused by the SARS-CoV-2 virus, was declared a pandemic by the World Health Organization (WHO) in March 2020. As of March 2023, it had caused premature deaths of an estimated 21.1 million people (excess deaths), with a 95% confidence interval of 17.5 and 29.6 million, and generated a series of epidemics all over the world (The Economist, 2023). First in China, and then across the globe, countries have sought to control the growth of COVID-19 infections through multiple measures that include: border controls; testing and tracing of COVID-19 cases and their isolation and quarantine; vaccinations; and various forms of social distancing that range from mandated mask wearing to the temporary closure of non-essential businesses.
A large literature has developed to assess the effectiveness of public health measures in relation to COVID-19; a highly infectious and airborne disease. With a few exceptions (e.g., Bruckhaus et al., 2022; Flaxman et al., 2020; Shiraef et al., 2022), most existing quantitative studies have focused on individual countries. Importantly, existing studies have employed either statistical models with underlying assumptions and structure (e.g., Ge et al., 2022) or used calibrated epidemiological models (e.g., Kompas et al., 2021) to assess the effectiveness on public health outcomes.
A global review of the impacts of public health measures to control COVID-19 concluded in 2022 that “lockdowns” or mandatory social distancing (e.g., restrictions on hospitality and retail, school closures, and even economy-wide lockdowns), that we label closures, especially when timely implemented and with sufficient stringency, were effective at controlling COVID-19 infection rates in 2020 (Sachs et al., 2022). Nevertheless, there is an alternative narrative that closures were either ineffective or had very little effect on COVID-19 fatalities (Bhalla, 2020; Herby et al., 2022).
In this paper, we investigate whether closures or openings changed the short-term trends in COVID-19 cases, hospitalizations, and ICU patients. We compared their trends before and after each closure event to determine whether the closure event accelerated the three epidemic indicators. We also compared the trends before and after each opening event to determine whether the relaxation event accelerated the epidemic indicators or slowed them down if they were already declining. Our analyses were applied to Australia, Canada, and the United Kingdom (UK), where consistent and high-quality public health data were available. Comparisons across these countries, in relation to closures and openings, is supported by their similarity in terms of per capita incomes, quality of their public health services and cultural norms (e.g., mask-wearing).
Our key contribution is to provide, as far as we are aware, the first cross-country quantitative analyses on the impacts of closures and openings on COVID-19 cases, hospitalizations and ICU patients without imposing a model framework or assuming a statistical or distributional structure on the data. With publicly available data, the easy-to implement trend analysis allows our results to be fully replicated and avoid the possible biases arising from assumptions about the statistical or distributional structure. Our trend analysis provides a series of separate, independent and short-term “snapshots” of the effects on before-and-after trend growth for multiple closures and openings. This approach avoids possible bias from longer-term or secular trends, correlations between different closures and openings, and structural changes in population behavior to social distancing that may have occurred over the period 2020 to 2021.
The remainder of the paper is organized as follow. In section 2, we describe our method of trend analysis. In section 3 we present our key results. In section 4, we discuss the implications for future epidemic public health interventions, and in section 5 offer our conclusions.
Methods
Our trend analysis method is illustrated in Figure 1. In each panel of this figure, we include three separate temporal periods: (1) the period before a public health intervention where data are used to evaluate a possible “Business-as-Usual (BAU)” scenario; (2) the period after an intervention, but before it has an impact on public health performance, or a lag in impacts (e.g., see Caristia et al., 2020; Fang et al., 2020; Ghosal et al., 2020; Guzzetta et al., 2021; Molefi et al., 2021; Siedner et al., 2020), what we refer to as a “Yet-to-be-Impact” period; and (3) the period after the intervention that coincides with when there is an impact on public health performance, what we refer to as an “Observed Impact” period.

The possible impacts of public health interventions and trend analysis.
The three panels in Figure 1 illustrate three possible outcomes of an intervention that has an impact on public health performance. Panel (a) shows when an intervention changes the level or mean value of public health performance with a lag. This panel illustrates that the intervention reduced the level or mean value of an undesirable public health outcome, we refer to this situation as “impact on level.” Panel (b) shows when the trend is arithmetic (i.e., linear trend) with a constant daily incremental rate, and the intervention reduces this incremental growth rate, that is, the steepness of the trendline (referred to as impacts on incremental rates or linear trend). Panel (c) shows when the trend exhibits exponential growth, and the intervention reduces this exponential growth rate (Courtemanche et al., 2020; Lau et al., 2020). Panels (b) and (c) are sometimes referred to as “flattening the curve” (Saez et al., 2020) because the incremental rate or growth rate remains positive, albeit at a reduced rate, while a negative growth rate in an undesirable public health outcome is called “bending the curve” (Tian et al., 2020).
We employed intertemporal trend analyses, illustrated in Figure 1, to investigate whether major and mandatory closures and international border restrictions had a direct impact (level, linear growth trend, exponential growth trend) on public health outcomes for Australia, Canada, and the UK. For each country, we separately analyzed three publicly accessible data on: (1) the number of positive reported COVID-19 cases; (2) the number of COVID-19 hospitalizations; and (3) the number of COVID-19 patients in intensive care units (ICUs). These data were among the most commonly reported public health measures used by decision-makers, professionals, and the public to evaluate COVID-19 outbreaks in 2020 to 2021 (Allieta et al., 2022). These data are publicly available are detailed in the Appendix.
Possible public health impacts due to interventions are evaluated by comparing before and after trends for a given mandatory intervention. Three possible trendlines were considered; a level shift, a linear trend change, and an exponential growth trend change, as shown in Figure 1. For each evaluated closure or opening, we compared the trend of post-intervention 7-day actual data with the corresponding pre-intervention 7-day BAU trend. If, after an intervention, the actual trend was below the BAU trend during the entire evaluation period, we described it as a beneficial change that occurred after the mandatory intervention. If, after an opening, the actual trend in the evaluation period increased faster or declined more slowly than the BAU, we described it as a detrimental change. We note that if the number of cases remained small (five or below) during the entire evaluation period, we did not count it as a detrimental change even when it was above the BAU. Similar exceptions all apply to the number of COVID-19 hospitalization and ICU patients.
We controlled for different durations of the lag (“Yet-to-be-Impact”) period. For each closure or opening event, the post-evaluation period could start from 3 to 9 days, inclusively after the intervention, which is the equivalent of the assumed time delay between infection and onset of COVID-19 symptoms (Byrne et al., 2020; Xin et al., 2022). We repeated the analysis for each value of the possible lag periods and reported how often (as a percentage) there was a beneficial change after a closure event, and how often there were detrimental changes after an opening. Our data included the period from February 2020 to March 2022. The ending time coincided with when many of the public health restrictions for COVID-19 were either relaxed or completely removed in the three selected countries. All our data are accessible in the supplementary information.
Results
Australia
Figure 2 summarizes COVID-19 outbreaks in Australia and shows major closures (in black vertical lines) and openings (in purple vertical dashed lines). As shown, the number of COVID-19 cases “took off” near the end of 2021. For better visualization, a zoom-in panel for this period is included, with different vertical scales, from March 2020 to August 2021.
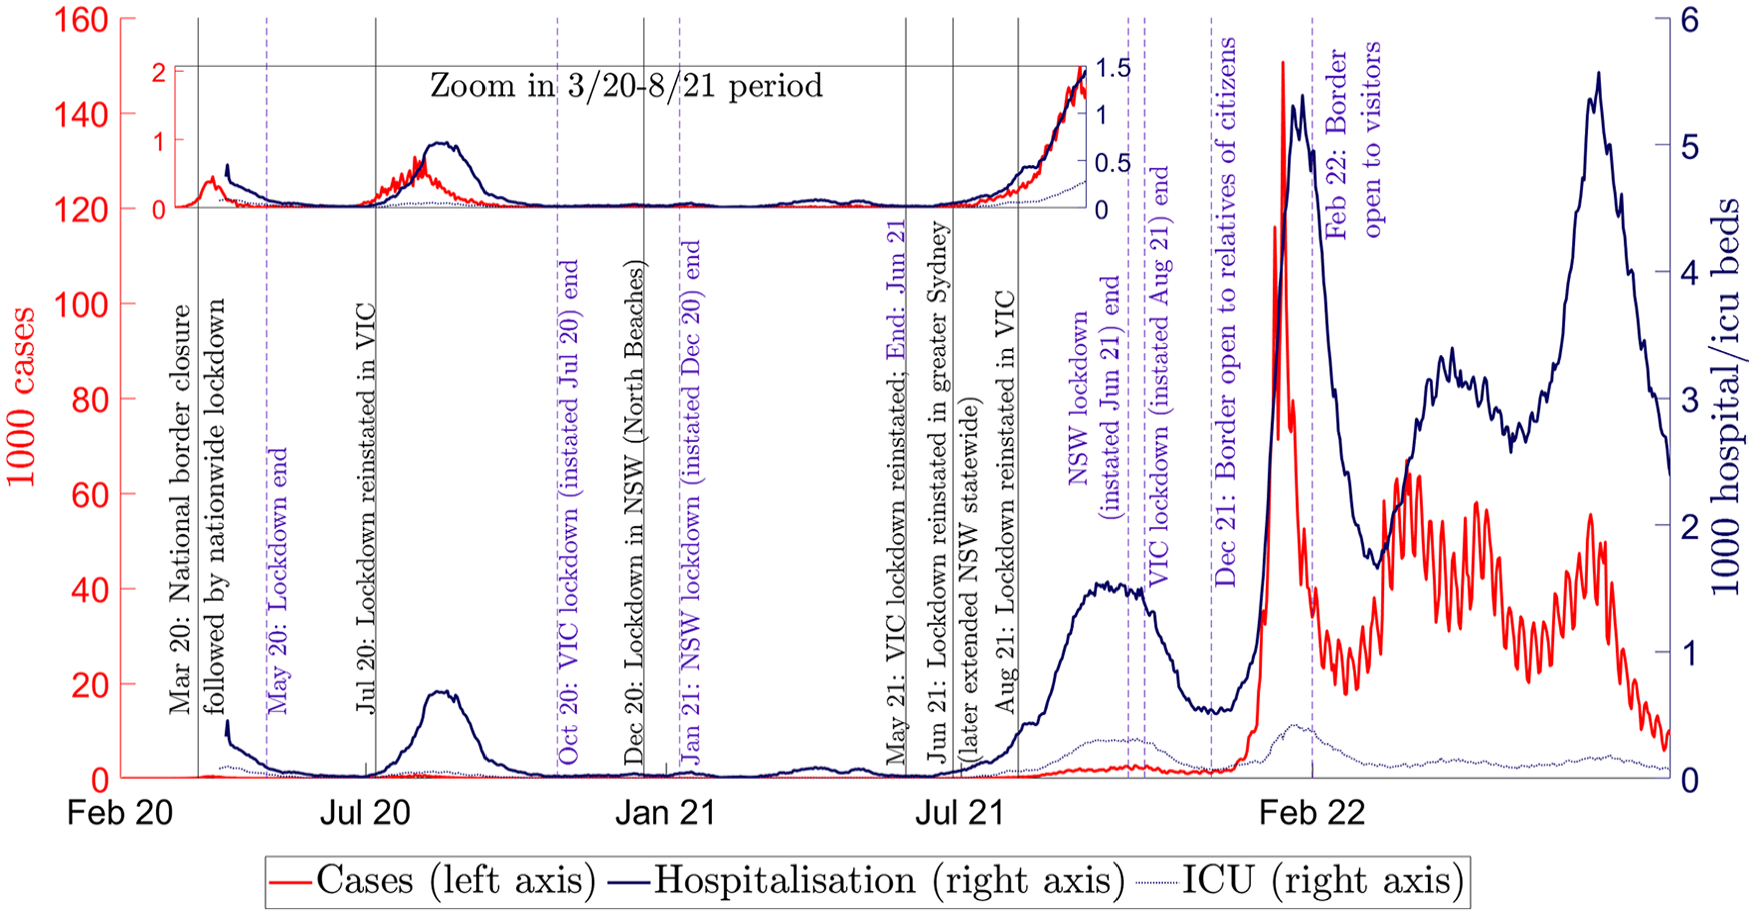
COVID-19 closures and openings in Australia, 2020 to 2022.
COVID-19 restrictions in Australia began with a nationwide closure in March 2020, with subsequent closures implemented by state governments, with the exception of international border restrictions. The (first) national closure was implemented by the federal government, supported by all state and territory governments, as an emergency response to the first outbreak of the disease in Australia. This national closure coincided with the closure of the international border to non-citizens.
After the initial outbreak, federal public health restrictions started to ease from late April to May 2020. When a second COVID-19 outbreak emerged in the state of Victoria in July 2020, a closure was reinstated in Melbourne, the second-largest city in Australia, and quickly upscaled to the entire state. This Victorian closure lasted until October 2020, that is, the second vertical purple line in Figure 2. Subsequently, some short closures were applied by both the New South Wales (NSW) and Victorian governments in response to COVID-19 outbreaks until late June 2021.
The third COVID-19 outbreak in Australia, triggered by the Delta variant, emerged in June 2021 and prompted a return to stringent closures in both states. Beginning in October 2021, when the NSW state vaccination rate reached 70% of 16+ years population, the state government progressively relaxed its public health restrictions. In early December 2021, Australia’s international borders were opened to citizens and their relatives, and shortly thereafter to all international visitors.
Table 1 summarizes the trend analysis for Australia, namely, when there were beneficial changes in epidemic outcomes after closures (in white rows) and when there were detrimental changes after openings (in grey rows). At the national level, Table 1 shows the impact of the international border closure and nation-wide closure measures. After Australia closed its international borders and instituted the first closure in March 2020, the number of cases continued to increase over the short-term, but the increasing trend was flattened in all considered scenarios, that is, lower incremental rate and growth rate of epidemic indicators. When the national closure ended in early May 2020, the epidemic trends increased, at least in the short-term. When the international border was opened to the relatives of citizens in early December 2021, and to all international travellers in February 2022, the growth in COVID-19 increased relative to the pre-opening trends.
Fractions of Considered Scenarios With Beneficial Post-Closure Trend Changes and Detrimental Post-Openings Trend Changes, Australia 2020 to 2021.


Note.
“'Mean,”“'trend,” and “growth” columns correspond to changes in the average, the linear trend, and the rate of change (growth rate) of epidemic indicators (Figure 1(a)–(c), respectively).
Numbers above 50% are in bold. NA values indicate inadequate data, for example, missing data or pre-closure numbers were small (all equal to 5 or below) for reliable trend analysis.
White cells represent the fraction of scenarios with beneficial changes after closures, that is, slower increasing/growing or faster-declining trends. If the number of COVID-19 cases, hospitalizations or ICU patients remained small (i.e., equal to or less than 5) during the entire evaluation period, we did not count it as an unwanted change regardless of their trend coefficients we did not count it as an expected outcome regardless of the trend coefficients.
Grey cells represent the fraction of scenarios with detrimental changes after openings, that is, slower declining or faster increasing/growing trends.
After April 2020, closures in Australia were implemented by state governments. The most important, in terms of duration and stringency, was the Victorian closure that began in June 2020 (Grafton et al., 2023). Our trend analysis indicates this 2020 Victorian closure was highly effective at reducing the trend growth in COVID-19 cases. There were also beneficial trend growth changes associated with the Northern Beaches of Sydney outbreak in December 2020, another outbreak in Victoria in May 2021, and an additional outbreak in Greater Sydney in June 2021.
An exception to the effectiveness of closures was the Victorian closure in August 2021 with an observed beneficial change in trend growth only for hospitalizations and only for some scenarios. We note that this particular closure was associated with multiple anti-lockdown protests that led to the arrest of protesters who chose publicly not to comply with the state’s public health orders (Calla & AAP, 2021).
Table 1 shows that there were detrimental changes following openings except for Victoria in October 2020. At a state level, the openings in New South Wales in January 2021, in Victoria in June 2021, in New South Wales in 2021, and also the international border fully reopening, were all followed by detrimental changes in the trend of the number of COVID-19 cases. After the closure in Victoria ended in October 2021, there were no increases in the number of COVID-19 cases and hospitalizations, but there was an increase in the growth trend for ICU patients.
Canada
Figure 3 summarizes the dynamics of COVID-19 outcomes and major closures in Canada. Canada’s COVID-19 public health restrictions began in mid-March 2020 and expanded as the number of COVID-19 positive cases, hospitalizations, and fatalities rose during the first outbreak. The international border was also closed on March 16, 2020 following a requirement that all incoming passengers must isolate for 14 days on March 13 2020. As of April 1 2020, schools, medium-sized gatherings (larger than 10 people), and non-essential services were temporarily closed across the country.

COVID-19 closures and openings in Canada, 2020 to 2022.
After the peak of the first outbreak, public health restrictions started to ease from May 2021. Restrictions have subsequently been applied at a provincial level rather than consistently applied across Canada. For example, the closure in the Province of Manitoba was reinstated in October 2020 in response to a second major outbreak that lasted for about 2 months. Ontario was also in closure for about 2 months as a response to its second outbreak. During the second outbreak, the most affected province was Quebec. It imposed a curfew lasting for over 4 months between January and May 2021. By July 2021, most public health restrictions were removed, with Ontario being the last province to allow indoor shopping and events. In early December 2021, the international border was opened to all countries provided arrivals had pre-departure PCR tests. Exceptionally, in late December 2021, Quebec reinstated a closure which concluded in March 2022.
Table 2 shows the beneficial trend changes with closures in white rows and detrimental changes after openings in grey rows. At the national level, the table shows a reduction in the exponential growth of the number of COVID-19 cases after the international border was closed in March 2020. The national closure implemented in early April 2020 appeared to flatten the positive growth trend but was not able to reduce the absolute number of COVID-19 cases. After the national closure ended in June 2020, the number of COVID-19 positive cases and hospitalizations continued to decline, but the declining trends became less pronounced. When the international border was fully opened in December 2021, there was an increase in the number of COVID-19 cases, hospitalizations, and ICU patients, compared to when the international border was restricted.
Fractions of Considered Scenarios With Beneficial Post-Closure Trend Changes and Detrimental Post-Openings Trend Changes, Canada 2020 to 2021.


Note.
“'Mean,”“'trend,” and “growth” columns correspond to changes in the average, the linear trend, and the rate of change (growth rate) of epidemic indicators (Figure 1(a)–(c), respectively).
Numbers above 50% are in bold. NA values indicate inadequate data, for example, missing data or pre-closure numbers were small (all equal to 5 or below) for reliable trend analysis.
White cells represent the fraction of scenarios with beneficial changes after closures, that is, slower increasing/growing or faster-declining trends.
Grey cells represent the fraction of scenarios with detrimental changes after openings, that is, slower declining or faster increasing/growing trends. If the number of COVID-19 cases, hospitalizations or ICU patients remained small (i.e., equal to or less than 5) during the entire evaluation period, we did not count it as an unwanted change regardless of their trend coefficients.
At the provincial level, there were beneficial changes after closures implemented by provincial governments and a detrimental change following openings. The exception was Ontario’s closure in December (Christmas holiday), 2020. Similarly, openings resulted in detrimental trends.
United Kingdom (UK)
Figure 4 summarizes the dynamics of COVID-19 outcomes with major closures and openings in the UK. The first UK closure began March 26, 2020. Closure restrictions were gradually eased until they were reapplied in a second closure in November 2020. The second closure lasted around 4 weeks and ended in early December 2020. Shortly thereafter, a second outbreak regained momentum, prompting a third closure in early January 2021. The public health restrictions began to relax from March 2021 after the second outbreak peaked and following the UK vaccination campaign that began December 2020. In August 2021, almost all public restrictions in the UK were removed when the vaccination coverage reached around 60% of the adult population.

COVID-19 closures and openings in the United Kingdom, 2020 to 2022.
Table 3 summarizes key results for the UK in relation to its closures and openings and trend changes. A beneficial trend change was observed following the first closure in the UK (March 2020) and a detrimental trend change after restrictions were relaxed in July and August 2020.
Fractions of Considered Scenarios With Beneficial Post-Closure Trend Changes and Detrimental Post-Openings Trend Changes, United Kingdom 2020 to 2021.


Note.
“'Mean,”“'trend,” and “growth” columns correspond to changes in the average, the linear trend, and the rate of change (growth rate) of epidemic indicators (Figure 1(a)–(c), respectively).
Numbers above 50% are in bold. NA values indicate inadequate data, for example, missing data or pre-closure numbers were small (all equal to 5 or below) for reliable trend analysis.
White cells represent the fraction of scenarios with beneficial changes after closures, that is, slower increasing/growing or faster-declining trends.
Grey cells represent the fraction of scenarios with detrimental changes after openings, that is, slower declining or faster increasing/growing trends. If the number of COVID-19 cases, hospitalizations or ICU patients remained small (i.e., equal to or less than 5) during the entire evaluation period, we did not count it as an unwanted change regardless of their trend coefficients.
The second and third closures in the UK were associated with beneficial trend changes in relation to all three epidemic indicators. There were also detrimental trend changes after these closures ended, as shown in Figure 3 and Table 3.
Discussion
Closures, including business shutdowns and stay-home orders, were implemented to control COVID-19 outbreaks in many countries in the world, at least in the early stages of the pandemic; a period that coincided with either zero or very low vaccination rates (Caristia et al., 2020; Flaxman et al., 2020; Khosravizadeh et al., 2022; Lewis, 2022; Shiraef et al., 2022). Our trend change analysis, using publicly accessible data, shows that closures were effective at reducing trend growth in COVID-19 cases, hospitalizations and ICU patients in Australia, Canada, and the UK over the period 2020 to 2021.
Our findings show that openings are, in general, associated with detrimental trend growth and an increase in COVID-19 cases, hospitalizations and ICU patients. Consequently, the magnitude and timing (Chu et al., 2022) of openings should be undertaken only after carefully considering their full costs and benefits (Gurdasani et al., 2021; Scott et al., 2021; Yuan & Blakemore, 2022).
We found that international border closures in Australia and Canada reduced the growth rate of COVID-19 cases. While international border closures impose substantial economic and social costs (Nicola et al., 2020; Onyeaka et al., 2021; Rathod et al., 2021), they helped to avoid large public health and economy costs (Kompas et al., 2021), especially early in the pandemic when vaccines were not widely available.
Our results support the view that, in general, closures were beneficial in controlling the spread of COVID-19 in 2020 to 2021 (Caristia et al., 2020; Flaxman et al., 2020; Sachs et al., 2022; Shiraef et al., 2022). Our results provide an important counter example to claims that closures were ineffective in two ways. First, we found short-term beneficial trend changes after most closures. Second, whatever the voluntary behavior changes initiated by individuals themselves (Herby et al., 2022), they did not sufficiently replace the observed public health benefits of mandatory closures and detrimental changes from openings.
Our results complement the public health literature which indicates that closures tend to be more effective in the early stages of outbreaks (Caristia et al., 2020; Hyafil & Moriña, 2021; Stokes et al., 2022), and their effectiveness depends on the timing of their introduction (Trivedi & Das, 2021). Nevertheless, our findings do not undermine the benefits of less stringent and complementary measures (Han et al., 2020) to reduce trend growth in COVID-19 cases such as mandatory mask wearing, publicity campaigns to encourage hand washing, and person density limits.
The effectiveness of closure on targeted facilities and spaces, such as at schools or public transport hubs, depends on the adoption and compliance with less stringent intervention measures (Auger et al., 2020; Islam et al., 2020), such as mask wearing. In other words, the optimal timing and stringency of closures and controls to slow COVID-19 infections are context specific and should be tailored to the number of cases, growth rates and expected morbidity and past fatality rates; all of which vary by place and time and also by the effectiveness and the proportion of the population vaccinated for COVID-19 (Askitas et al., 2021; Lin et al., 2021).
We highlight that, unlike previous quantitative studies on the effectiveness of closures, our before-and-after trend analyses are independent of statistical and structural assumptions and do not require epidemiological modeling or assumptions and/or calibration about a set of time-varying parameters. Further, each of the closures we analyzed were treated as separate and independent. Because our trend analysis employed only short-term (14 days or less) data, we also avoided possible biases from changes in behavior and compliance over the data period.
Conclusions
The COVID-19 pandemic that began in early 2020 offers a valuable “natural experiment” about the effectiveness of measures to reduce either the level or trend in key public health measures (reported COVID-19 cases, hospitalizations, and ICU patients). Using data from three countries (Australia, Canada, and the United Kingdom) that share similar levels of per capita income, public health systems and cultural practices in relation to disease control (e.g., mask wearing), we employed trend analysis, independent of statistical and structural assumptions and with publicly accessible data, to assess the effects of closures and openings on COVID-19 public health outcomes.
Our findings indicate that international border closures and closures in the form of social distancing measures to limit face-to-face interactions were, in general, effective at reducing the short-term trend growth in the number of COVID-19 cases, hospitalizations and ICU patients. Similarly, openings or relaxation in social distancing were, in general, associated with an increase in the short-term trend growth of COVID-19 cases, hospitalizations and ICU patients.
Our key contribution is to provide a robust finding, independent of statistical and model assumptions and framing, that mandated closures were effective at controlling the growth in COVID-19 in 2020 to 2021 for the three selected countries. These results are important counter evidence to a narrative that mandatory social distancing measures, including mask wearing, are either ineffective or not required for controlling airborne infectious diseases such as COVID-19. The broader question as to whether a specific closure is justified, given that closures impose an economic cost, goes beyond our current study.
Footnotes
Appendix
Declaration of Conflicting Interests
The author(s) declared no potential conflicts of interest with respect to the research, authorship, and/or publication of this article.
Funding
The author(s) received no financial support for the research, authorship, and/or publication of this article.