
Abstract
Discovering social approaches to individuals with special needs and to what extent the society wants to interact with such people is of importance to fathom out not only the social responses to individuals with special needs but also the social reflections toward inclusive policies. This descriptive study accordingly aimed to investigate the level of social distance toward individuals with special needs and the factors affecting social distance. A total of 659 randomly sampled people from the southeastern region of Turkey participated in the study. Of the participants, 395 (60%) are female, and 264 (40%) are male. Their ages ranged from 16 to 64 years with a mean age of 28.4 years. Data were collected through the Bogardus Social Distance Scale developed to measure the level of social distance among people. Research results indicate that gifted individuals were the most accepted by the participants with regard to getting married and being close kin by marriage. The greatest social distance was expressed toward individuals with intellectual disabilities and autism. Social distance toward individuals with special needs did not differ significantly according to education level, contact frequency, and gender of the participants.
Introduction
Just like individuals without special needs, being accepted by the society is important for improvement of life quality among individuals with special needs. Whether or not individuals with special needs are exposed to exclusion as neighbors, colleagues, and potential wives or husbands etc. is a strong indicator of social acceptance. Social inclusion as the base of social acceptance occurs when people have equal status within the society regardless of their special needs (Devine et al., 2015). Egalitarian beliefs and interactions among group members are essential elements of social acceptance (Chen & Hamilton, 2015). Does social acceptance toward individuals with special needs develop in this direction? As a matter of fact, a number of studies measured the levels of social acceptance among typically developing students toward students with special needs in different educational stages from kindergarten to university in different societies (Bakker & Bosnian, 2003; Bossaert et al., 2015; Favazza & Odom, 1997; Firat & Koyuncu, 2019, 2021; Huskin et al., 2018). It is possible to observe that social distance toward individuals with special needs continues in adulthood as well (Morin et al., 2013; Ouellette-Kuntz et al., 2010). Individuals with typical development are found to maintain social distance toward individuals with special needs regarding marriage, kinship, neighborhood and colleagueship (Hergenrather & Rhodes, 2007; Westbrook et al., 1993).
The reason for lower social acceptance toward individuals with special needs is explained through various factors. Some researchers strikingly found that culture is among the factors affecting social acceptance toward individuals with special needs (de Vries et al., 2020; Gillespie-Lynch et al., 2019; Scior et al., 2013a; Sheridan & Scior, 2013; Someki et al., 2018). Having compared the level of awareness and social distance toward individuals with intellectual disabilities in Kuwait and the United Kingdom, Scior et al. (2013b) found that awareness of intellectual disability as well as causal and intervention beliefs determine the degree of social distance. They highlighted that negative effects are observed more in Arab countries like Kuwait. In some studies, the type of disability also came to the fore with regard to social acceptance (Firat & Koyuncu, 2021; Gordon et al., 2004; Hampton & Xiao, 2007; Huskin et al., 2018; Westbrook et al., 1993). In a study on various communities, Westbrook et al. (1993) found that all communities had similar characteristics regarding the acceptance of individuals with disabilities. Among the disability groups, individuals with chronic illness are exposed to the least social distance, whereas individuals with hearing impairment faced moderate social distance, and those with physical and intellectual disabilities experienced greatest social distance. The German community expressed greatest acceptance of individuals with special needs, followed by the Anglo-Australian, Italian, Chinese, Greek, and Arabic communities.
Age (Morin et al., 2013; Scior, 2011), gender (Girli et al., 2016; Hunt & Hunt, 2000; Kowalska & Winnicka, 2013), level of knowledge about (Firat & Koyuncu, 2021; Logan & Bogart, 2020; Wozencroft et al., 2015) and contact with individuals with special needs are also significant for social acceptance (Barr & Bracchitta, 2015; Kalyva & Agaliotis, 2009; Keith et al., 2015; Kim et al., 2005; Kropp & Wolfe, 2018; MacMillan et al., 2014; Ouellette-Kuntz et al., 2010; Seewooruttun & Scior, 2014). Ouellette-Kuntz et al. (2010) found that older and less educated individuals expressed greater social distance toward individuals with intellectual disabilities. Having a family member with a disability and the mildness of that disability were among the criteria that increase the level of social acceptance. Likewise, in a meta-analysis, Scior (2011) concluded that age, education level and prior contact with an individual with disability predict attitudes, while the effect of gender is inconsistent. Fichten et al. (2005) found that volunteering of adults with children with physical or hearing impairments diminished social distance and contributed to improved attitudes, thoughts, and feelings toward individuals with special needs among individuals with typical development.
An overview of the literature makes us conclude that a variety of prejudices and stigmatizations lead to discriminatory and exclusionary attitudes and behaviors toward individuals with special needs within the society (Werner, 2015). These attitudes prevent individuals with special needs from developing social skills and make them feel ostracized, worthless and unhappy (Antonak & Livneh, 2000). It is of importance, therefore, to discover social approaches toward individuals with special needs and to what extent the society is willing to interact with such individuals. Understanding social reactions to individuals with special needs makes sense in terms of revealing the reflections about inclusion policies in the society as well. Thus, unlike other studies in the field of special education, this paper aims to measure the attitudes of the society toward special needs groups in a variety of areas (marriage, friendship, neighborhood etc.). Revealing to what extent inclusive practices reverberate in the social structure is expected to show whether social inclusion has been successful or not. In Turkey, the country where the present study was conducted, inclusive practices have been implemented for nearly 40 years in classroom settings.
Turkey is located at the junction of East and West and incorporates the social influences of both cultures (Ataca et al., 2005). According to Rakap et al. (2016), Turkish and American pre-service teachers have similar attitudes toward inclusion, and their attitudes are positive. However, both groups of pre-service teachers were more willing to work with children with severe physical disabilities than those with severe cognitive or behavioral problems. In recent years, the number of courses related to special education and inclusion in teacher training has significantly increased in Turkey. This increase may positively affect the attitudes of teachers and teacher candidates toward individuals with special needs (Firat & Koyuncu, 2021). However, to the best of our knowledge, no research has investigated the attitudes of the rest of the society toward individuals with special needs.
When the literature is reviewed, it is seen that a great majority of studies investigated the social acceptance of individuals with intellectual disability. Measuring the social acceptance of other groups with special needs like gifted ones as well as those with visual and hearing impairment is also important in terms of social integration. Thus, the aim of this study is to measure social distance toward individuals with special needs. The sub-aim is to investigate whether social distance toward individuals with special needs differs according to the groups of special needs (giftedness, visual impairment, hearing impairment, intellectual disability, physical disability, learning disability, autism, attention deficit/hyperactivity disorder, chronic illness, and language and speech disorder). Social distance toward individuals with special needs was examined in terms of education level, gender, age, and frequency of contact with individuals with special needs. In this context, the study sought answers to the following questions:
What are the levels of social distance toward different special needs groups?
Does social distance significantly differ between special needs groups?
Does social distance significantly differ according to education level, contact frequency, and gender?
Is there a significant correlation between the participants’ ages and social distance toward each special needs group?
Method
Research Design
This is a descriptive research aiming at measuring and presenting social distance toward individuals with special needs in detail. In this type of research, structured questions are addressed to a particular sample chosen from a target population; their opinions, thoughts, beliefs or attitudes are described, and the results obtained are generalized to the population (Fraenkel & Wallen, 2006). It is a correlational research at the same time, as it aimed to investigate the relationship between the participants’ ages and social distance toward individuals with special needs.
Participants
The study was carried out in the Southeastern Anatolia region of Turkey. Turkey is geopolitically positioned as a bridge between Asia and Europe. In part due to the country’s unitary political system, different regions of Turkey have great similarities in terms of social structure. The present study incorporated a stratified random sampling procedure to select a sample that represents the target population with minimal cost and effort. The insufficient number of participants causes underrepresentation of population and undergeneralisation of results, while the large number of participants would be uneconomical in terms of labor, cost and time. For this purpose, we computed an adequate and appropriate sample using the address-based population registration data of the Turkish Statistical Institute (TÜİK) in 2018. Firstly, we determined the whole size of the population. According to the TÜİK data, 5,772,322 people aged 16 and older live in the Southeast Anatolia region of Turkey. The reason for selecting 16 years and older individuals is the fact that 16 years represent the end of adolescence, and individuals are in conflict with their environment in this period. When adolescence (10–16 years) ends, individuals can establish good relations with their environment (Doğan, 2007).
Adequate sample size for a known population can be calculated at a 95% to 99% confidence interval with a 5% margin of error when the standard deviation is estimated as 0.5 (Buyukozturk et al., 2015). By using TÜİK data, the required sample size was calculated as 384 people at a 95% confidence interval and 665 people at a 99% confidence interval. We managed to reach an approximately adequate sample size by getting 659 people to participate in the research. A stratified sampling was applied when selecting the participants. We made sure that each province would be represented enough in proportion to the whole population of the region. Data were collected from the participants selected randomly from all provinces. Sample size was set up with 659 participants after winnowing out the erroneous or sloppy data. Of the participants, 395 (60%) are female and 264 (40%) are male. Their ages range from 16 to 64, with a mean age of 28.4 years. The participants took part in the research on a voluntary basis.
Data Collection
The Bogardus Social Distance Scale developed to measure social distance among people was used as data collection tool (Bogardus, 1925). The Bogardus scale is used to reveal prejudices, stereotyping and perceptions that could cause discrimination between groups (Maurer, 2013). Scale items usually consist of 5 to 7 degrees of closeness. Six degrees of closeness were specified for each special needs group. The degrees from close to far were as follows: (1) Getting married to, (2) being close kin by marriage, (3) being next-door neighbor (4) being close friend, (5) being co-worker, and (6) avoiding contact. The data collection tool was constructed by using the 6 degrees of closeness for each special needs groups including giftedness, visual impairment, hearing impairment, intellectually disability, autism, learning disability, physical disability, chronic disease, attention deficit, and language and speech disorder as given in Table 2.
Bogardus type scales were found to be highly valid and reliable instruments in research on individuals with special needs (Bogardus, 1932; Huskin et al., 2018; Ouellette-Kuntz et al., 2010; Tringo, 1970). Apart from the literary information about validity and reliability of the Bogardus scale, a pilot study was carried out to examine test-retest reliability and usability of the scale in the present research. For this purpose, a group of participants consisting of university students, teachers, people from different occupations and ages were selected to evaluate test-retest reliability of the scale at the beginning and end of a 3-week time period. As the quantitative data obtained from the pilot study deviated significantly from standard normal distribution according to the Shapiro-Wilk test and histogram graphics, the correlation between two applications was evaluated by Spearman’s rho coefficient. The reliability results are presented in Table 1.
Test-Test Reliability Results for the Scale.

Correlation is significant at the .01 level (two-tailed
Table 1 shows that the correlation coefficient evaluated for each special needs groups is close to 1 and is significant at .01 level. In other words, the scale has a very high test-retest reliability. So as not to encounter any problems in the main study, the researchers observed the participants during the pilot study and tested the clarity and usability of the scale items. Although there were not any problems regarding applicability of the scale items, some participants reported problems with regard to some disability groups and their traits. Therefore, the researchers explained the characteristics of special needs groups when needed during the main study.
The researchers collected data through direct (face-to-face) contact with the participants and provided brief information about the scale and its application before the participants filled out. The researchers read the names of special needs groups in the scale and stated that they could inform the participants about any unknown group if needed. The questions the participants asked were answered promptly. For example, concerning the question about what chronic diseases are, the participants were informed that individuals with such diseases may have difficulty in active participation in school or work due to their need for long-term treatment. Examples of these diseases are diabetes and asthma.
The research was conducted in line with ethical principles after obtaining the required permission from the university where the researchers work. It was also conducted in accordance with the ethical standards set by the updated version of the Declaration of Helsinki. In order to collect reliable data, the participants were encouraged to join in the research voluntarily and to answer the questionnaire openly and sincerely.
Data Analysis
Levels of social acceptance toward individuals with special needs were calculated as percentage (%) for each degree of closeness. Total scores of social acceptance levels for each special needs group were calculated separately. The responses for each situation of closeness were coded as 1 for “I accept” and 0 for “I do not accept.” Then each degree of closeness was weighted from 1 to 6. The answers to the items were multiplied by 6 for “I can get married to,” by 5 for “I can be close kin by marriage,” by 4 for “I can be next-door neighbor,” by 3 for “I can be a friend,” by 2 for “I can be a co-worker,” and by 1 for “I avoid contact.” After weighting each degree of closeness, total scores were obtained for each special needs group. The procedures of weighting and calculating total scores were carried out based on the relevant literature (Bogardus, 1932; Huskin et al., 2018). The greater the social distance value calculated in this way is, the higher the level of social acceptance is. Microsoft Excel 2016 and IBM SPSS Statistics 23 software were used to analyze the data.
The Kolmogorov-Smirnov test and histogram graphs were employed to check whether the score distributions meet the assumption of normality for all analysis methods. In the normality analysis, skewness and kurtosis values exceeded the critical range of (−1, +1), and data were not normally distributed for all variables. Data were not normally distributed for several factor variables (gender, level of education, etc.) as well. The following non-parametric analyses were conducted to resolve the mentioned problems. Friedman test was used to check whether the total levels of social acceptance differed significantly among special needs groups. Wilcoxon test was used to find out which groups differed when significance was detected among groups. Kruskal Wallis H test were used to analyze the changes related to educational level and contact frequency for each group of special needs. Mann-Whitney U test was used to analyze the gender-related changes for each group of special needs. Spearman’s rho correlation coefficient was employed to explore the relationship between the participants’ ages and social distance toward individuals with special needs for each group of special needs.
Results
The Levels of Social Distance Toward Individuals With Special Needs
Percentages (%) of social distance toward different special needs groups are presented in Table 2.
Social Distance Toward Different Special Needs Groups (%).

Note. 1 = Getting married to; 2 = Being close kin by marriage; 3 = Being next-door neighbor; 4 = Being friend; 5 = Being co-worker; 6 = Avoiding contact.
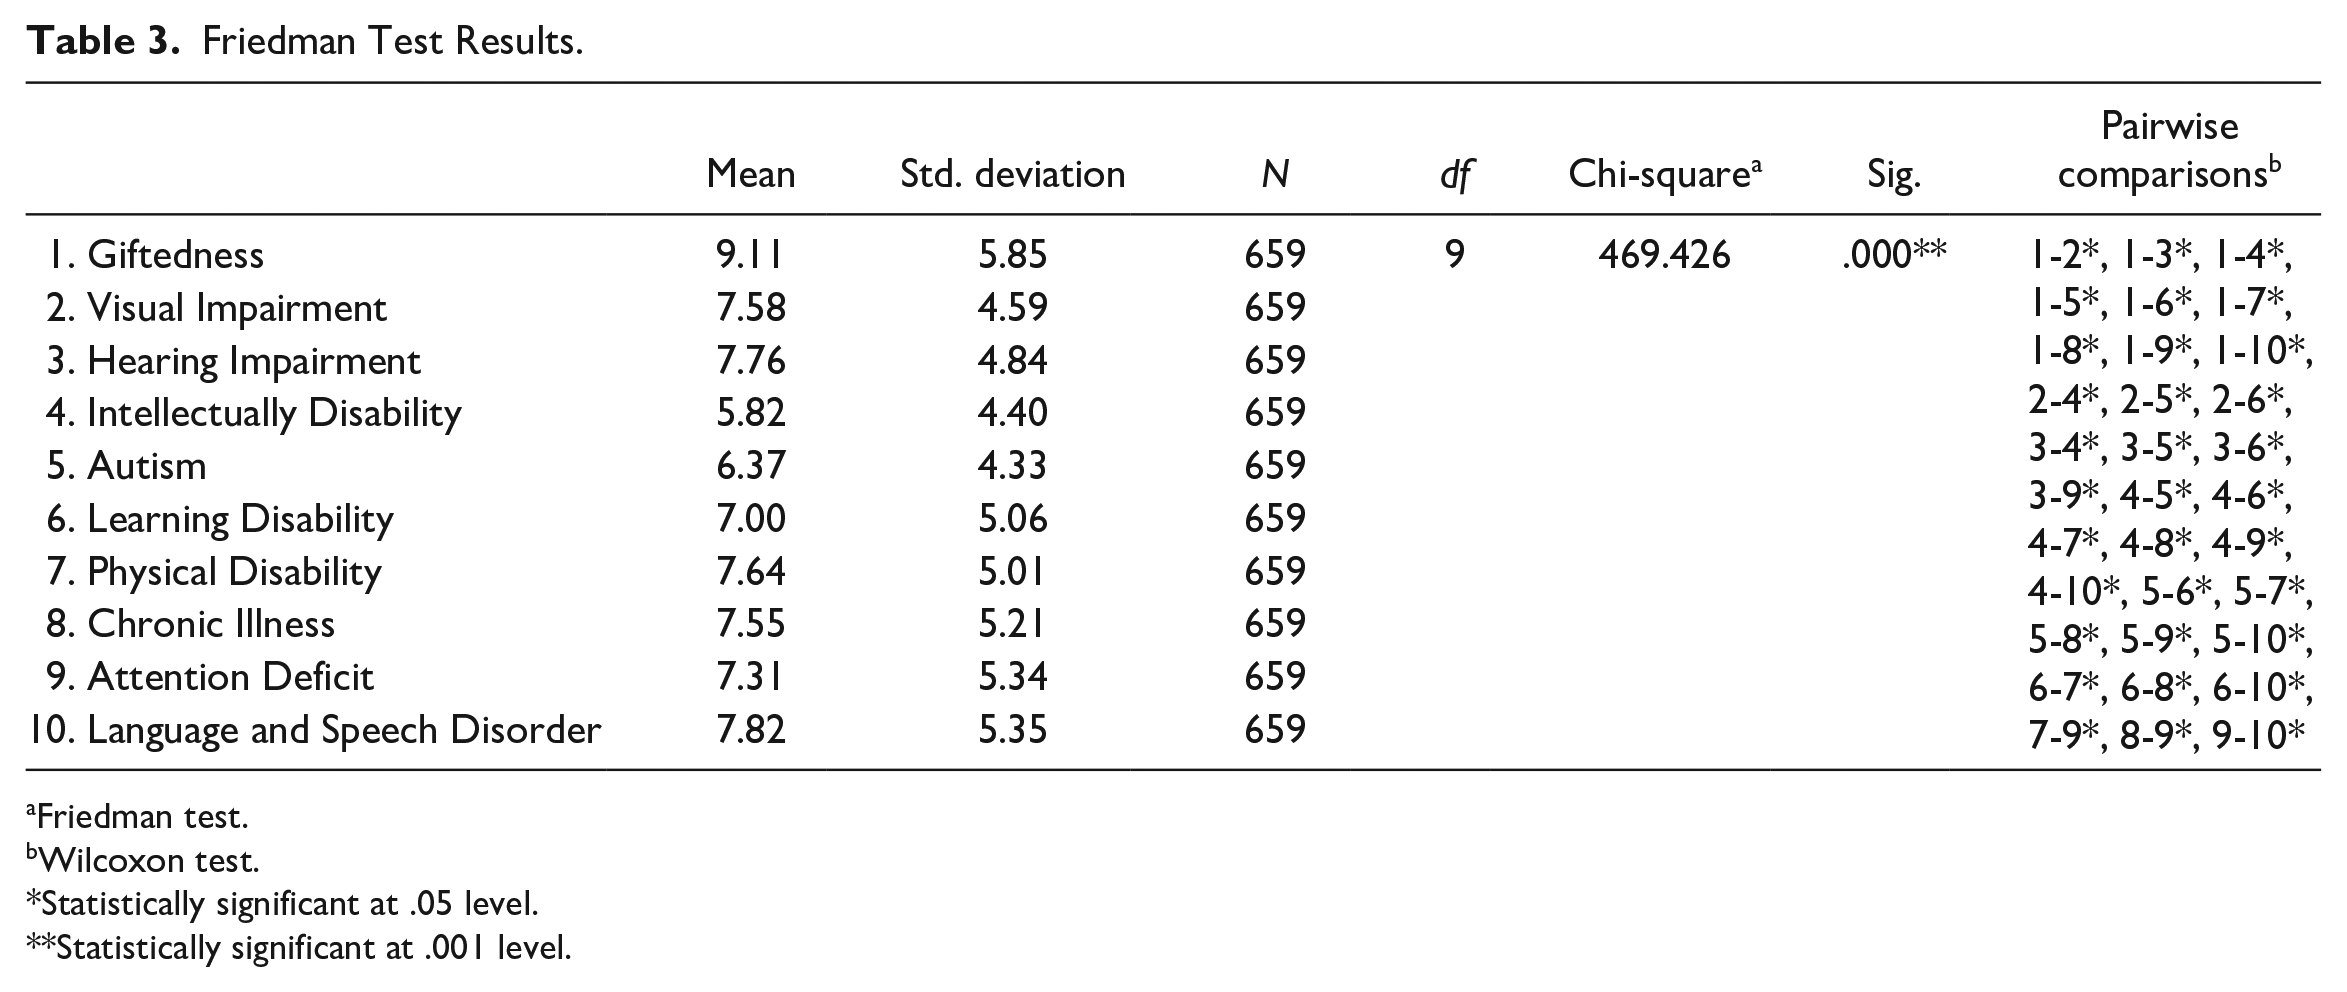
When asked if they would like to get married, Table 2 shows that the participants express a considerable level of social distance toward all special needs groups except for the gifted (47%). The greatest social distance was expressed toward individuals with intellectual disability (2%) and autism (3%), followed by those with language and speech disorders, attention deficit, chronic illness, hearing impairment, visual impairment, physical disability, and learning disability. Regarding close kinship by marriage, the greatest social distance was expressed again toward those with intellectual disability (18%) and autism (19%), whereas the least social distance is displayed toward the gifted (30%). Nearly half and a lesser part of the participants respectively said that they could be next-door neighbors (36%–50%) and co-workers (25%–38%) with one of these special needs groups. The majority of the participants reported that they could be friends (57%–72%) with one of these special needs groups. The greatest social closeness in terms of friendship was expressed toward individuals with visual and hearing impairment. The participants mostly avoided contact with individuals with intellectual disability (20%), autism (12%), and learning disability (10%). The difference between special needs groups was statistically compared via Friedman and Wilcoxon tests, and the results are given in Table 3.
Friedman Test Results.
Friedman test.
Wilcoxon test.
Statistically significant at .05 level.
Statistically significant at .001 level.
Table 3 shows that social acceptance scores for gifted individuals (X̄̄ = 9.11 ± 5.85) were significantly higher than all other groups, while scores for individuals with intellectual disabilities (X̄ = 5.82 ± 4.40) and autism (X̄ = 6.37 ± 4.33) were significantly lower than all other groups. Although social acceptance scores (X̄ = 7.10 ± 5.06) for individuals with learning disabilities were higher than those for individuals with intellectual disabilities and autism, they were significantly lower than scores toward individuals with visual impairment (X̄ = 7.58 ± 4.59), hearing impairment (X̄ = 7.76 ± 4.84), physical disability (X̄ = 7.64 ± 5.01), chronic illness (X̄ = 7.55 ± 5.21) and language and speech disorder (X̄ = 7.82 ± 5.35). The level of social acceptance for individuals with attention deficit (X̄ = 7.31 ± 5.34) was lower than that of gifted individuals and individuals with language and speech disorder, but higher than those with intellectual disability and autism.
Social Distance Toward Individuals With Special Needs According to Different Variables
Some descriptive statistics for education level, contact frequency, and gender variables were calculated as in Table 4 before examining the statistical differentiation of social acceptance levels according to these variables.
Descriptive Statistics Related to Educational Attainment, Communication Frequency and Gender.

Considering the levels of education in Table 4, it is seen that most of the participants have bachelor’s degree (X̄ = 7.29 ± 4.21, n = 474), followed by those with high school (X̄ = 7.32 ± 4.07, n = 119), primary school (X̄ = 8.61 ± 4.72, n = 4), secondary school (X̄ = 8.08 ± 5.13, n = 16) and postgraduate (X̄ = 6.96 ± 4.15, n = 8) degrees. As for how often the participants contact with individuals with special needs, Table 3 shows that a great majority of the participants occasionally (X̄ = 7.39 ± 4.23, n = 429) contact with those individuals. With a relatively lower ratio, they often (X̄ = 7.43 ± 3.98, n = 121) and never (X̄ = 7.40 ± 4.59, n = 109) contact with such individuals. Regarding gender, it is seen that the number of female participants (X̄ = 7.21 ± 4.23, n = 395) is higher than that of males (X̄ = 7.67 ± 4.25, n = 264). The difference in levels of social distance according to education level, contact frequency and gender are presented in Table 5.
Kruskal Wallis H Test and Mann-Whitney U Test Results.

Kruskal H test.
Value is significant at the .05 level (two-tailed).
Table 5 shows that social distance toward individuals with special needs did not differ significantly according to the participants’ education levels (p > .05). The fact that the participants had different education levels did not lead to differentiation in social distance toward individuals with special needs. Social distance toward individuals with special needs did not differ significantly according to contact frequency as well (p > .05). The fact that the participants reported different frequencies of contact with individuals with special needs did not lead to differentiation in social distance toward individuals with special needs. In addition, social distance toward individuals with special needs did not differ significantly according to the participants’ gender, except for individuals with giftedness, visual impairment and intellectual disability (p > .05). Male participants’ acceptance of individuals with giftedness (X̄ = 9.84 ± 6.12), visual impairment (X̄ = 8.06 ± 4.87) and intellectual disability (X̄ = 6.16 ± 4.47) were higher than female participants’ acceptance of individuals with giftedness (X̄ = 8.63 ± 5.62), visual impairment (X̄ = 7.56 ± 4.81) and intellectual disability (X̄ = 5.58 ± 4.34). Concerning the other special needs groups, neither femininity nor masculinity led to differentiation in social distance toward individuals with special needs.
Table 6 shows Spearman’s rho correlation coefficients and statistical significance values for the relationship between the participants’ ages and levels of social distance toward individuals with special needs with regard to each special needs group.
Relationship between Ages and Social Distances of Participants.

Correlation is significant at the .01 level (two-tailed).
As seen in Table 6, there is a positive and slightly significant correlation between the participants’ ages and their social distance toward individuals with special needs (p < .01) except for gifted people (p > .01). Thus, a very low-level relationship was found between the participants’ ages and social distance toward individuals with special needs.
Discussion, Conclusion, and Recommendations
This study aimed to measure social distance toward individuals with special needs and to explore whether it differs according to the variables of gender, age, education level and contact frequency.
The first result is that the participants overall expressed the greatest social distance toward individuals with intellectual disability and autism. About 12% to 20% of the participants avoided contact with individuals with autism and intellectual disability, respectively. They expressed social distance toward such individuals in cases of getting married to, being close kin by marriage, and being co-worker with them. This result is supported by several other studies which evidenced the occurrence of greater social distance toward individuals with intellectual disabilities and autism (Huskin et al., 2018; Ouellette-Kuntz et al., 2010; Westbrook et al., 1993). In the present study, the participants were apparently more distanced from individuals with invisible disabilities (intellectual disability and autism) than individuals with visible disabilities (physical disability, visual impairment, hearing impairment, etc.). It can be said that cognitive deficits or behavioral disorders cause greater social distance. This result may be associated with problematic behaviors, lower academic success and inadequate social skills of individuals with such deficit or disorder. Another reason may be that various social prejudices and the lack of knowledge about individuals with intellectual disabilities and autism lead to stigmatic attitudes and behaviors toward them. The relevant literature points out the possibility of eliminating such negative attitudes through informing the general public, as well as enabling direct and indirect contacts (Seewooruttun & Scior, 2014; Walker & Scior, 2013). For instance, Walker and Scior (2013) achieved improved levels of social acceptance and more favorable attitudes toward individuals with special needs by informing the participants via short films about individuals with intellectual disabilities.
The second and another surprising result is that the participants expressed social distance, albeit with the exception of marriage, toward gifted people. Social distance toward gifted people is observed particularly in cases of being close kin by marriage (30%) and being co-worker (33%) with them, which is contrary to the general expectation that gifted people are socially accepted to a greater extent. Their leadership qualities, competence in social skills, and performance in a general or specific field normally make them popular wherever they are. The reasons for the result in question may be related to the fact that gifted ones show differences from typically developing children in many (cognitive, emotional, social) aspects starting from childhood (Bildiren, 2018; Liu, 2009; Liu et al., 2007). Higher success, motivation, creativity and social capabilities are attributed to gifted students (Endepohls-Ulpe & Ruf, 2006; Garcia-Cepero & McCoach, 2009). Gifted students come to the fore not only with their academic success, but also higher motivation than children with typical development (Bildiren & Bikmaz Bilgen, 2019; Gottfried & Gottfried, 1996) and hard work in their fields of interest (Csikszentmihalyi et al., 1997). Gifted students are found to better organize themselves in social and emotional terms when compared to children with typical development (Neihart et al., 2002). A scientific characteristic of gifted individuals is that their cognitive abilities are higher than those of individuals with average talents (Sternberg, 1990). Cognitive abilities may cause children with typical development to envy and be jealous of gifted children (Striley, 2014). The level of performance that is difficult for non-gifted children to reach will probably show itself in adulthood. Experiences and observations of children with typical development about giftedness may continue in adulthood. Giftedness of a person with whom they will compete in the future may perturb and they may not prefer to work with gifted individuals at the same place, therefore.
Third, all the participants had a considerably distanced attitude toward the idea of being neighbor and co-worker with all the special needs groups, which indicates that they balk at living together with individuals with special needs. Home and work occupy an important place in adult life. The finding that the participants express social distance in these areas signifies the risk of exclusion toward individuals with special needs. Snyder et al. (2010) put forth that employees with disabilities (nearly 30%) are exposed to visible and invisible discrimination and unfairness more than their colleagues without disabilities are. Employers are also found to have been distanced from some special needs groups (Nota et al., 2014; Zissi et al., 2007). Bonaccio et al. (2020) found that many employers harbor ill-founded views about the work-related abilities of people with disabilities, and these negative views are a result of interrelated concerns that permeate the entire employment cycle (recruitment, selection, social integration, performance management). They prevent people with disabilities from participation in work life. In Turkey, for instance, only 22% of people with disabilities are able to participate in labor force, with the percentage decreasing to 12% for women with disabilities (Directorate-General of Services for Family, Work and the Elderly, 2019). These results are linked not only to social prejudices and labeling attitudes, but also unpreparedness of individuals with special needs for career and social life. As Burge et al. (2007) points out, the lack of employment training programs for individuals with intellectual disabilities is a major obstacle to increased work inclusion.
Fourth, social distance toward individuals with special needs did not change according to gender. Despite some similar results (Yazbeck et al., 2004), most researchers found that women have more positive attitudes (Chen et al., 2002; Hergenrather & Rhodes, 2007; Scior et al., 2013b). Having measured the attitudes of university students toward individuals with special needs in the context of marriage, co-workership and friendship, Hergenrather and Rhodes (2007) found that women express more favorable opinions regarding dating with and getting married to individuals with special needs. In the same research, it was found that women rather than men are acceptive and open to the idea of working or dating with individuals with special needs. They reached a similar result with regard to education level, while age was found to have been effective on social acceptance, albeit to a limited extent. Morin et al. (2013) found that younger and more educated ones have more positive attitudes toward individuals with special needs. In a similar vein, Ouellette-Kuntz et al. (2010) found that attitudes of older and less educated ones reflect more social distance.
Unlike in previous studies, contact frequency did not lead to differentiation in levels of social acceptance toward individuals with special needs. A number of studies concluded that greater contact with individuals with special needs contributes to greater social acceptance (Kalyva & Agaliotis, 2009; Keith et al., 2015; Kim et al., 2005; MacMillan et al., 2014). This divergence may be associated with several reasons. First, the present research analyzed the relationship between levels of social distance and total score of contact regarding 10 special needs groups. Which special needs group the participants contacted with may have affected their level of social distance (Barr & Bracchitta, 2008, 2015). As Barr and Bracchitta (2015) points out, greater contact may lead to negative attitudes as behavioral and developmental disabilities might not be readily apparent unlike physical disabilities. In other words, greater contact with particular special needs groups may be associated with more positive or negative attitudes. The second reason may be the quality of contact. Some researchers found that attitudes toward individuals with disabilities are predicted by the quality rather than frequency of contact (Barr & Bracchitta, 2012; Huskin et al., 2018; Keith et al., 2015; McManus et al., 2011). Keith et al. (2015) found that higher quality of contact helped to predict reduced anxiety and lower exclusion attitudes toward individuals with disabilities. For instance, seeing an employee with disability repeatedly getting into trouble at work may reinforce the idea that such people constitute a problem. On the contrary, seeing individuals with special needs in a situation where they are included (along with arrangements that really work) and are able to deal with problems can increase positive attitudes toward them. Furthermore, contact with individuals with special needs as part of unavoidable kinship ties or superficial relationships at work may not be sufficient to develop positive attitudes toward these individuals (Thomas & Rose, 2020). McManus et al. (2011) found that greater quality of contact uniquely predicted more positive attitudes toward people with disabilities, though greater knowledge and quantity of contact were unrelated to attitudes.
Individuals with chronic diseases were also included in the research, taking into consideration that they need special support due to long-term treatment processes. In Turkey, students with chronic diseases (with a medical certificate showing at least 20% disability rating) are defined as “individuals who need special education and support services due to a disease that requires continuous care and treatment” (Ministry of National Education in Turkey, 2010). Besides, the Ministry of Health of Turkey have issued a range of legal regulations for the continuation of employment, education, social support and assistance services for individuals with chronic diseases if they have a disability rate of over 40% (Resmi Gazete, 2019). The findings of this study show that there is still a need to boost the inclusion policies aimed at changing attitudes toward individuals with chronic diseases and to develop an understanding that can help encourage more positive attitudes toward individuals with special needs within the society.
Limitations and Implications
This research has some limitations. First, data were collected from people living in southeastern Turkey. Further research may incorporate a comparative analysis on how people from different regions express social distance toward individuals with special needs. Second, social distance toward individuals with special needs was interpreted through quantitative data obtained via a Bogardus-type scale. Further research may enrich these findings by collecting both quantitative and qualitative data. Third, further research may involve different special needs groups and compare their results with the results of this study. Fourth, few participants stated that they did not know about some special needs groups. Although the participants (who did not know) were provided information about these special needs groups during the interview, this may not have been sufficient to measure the participants’ attitudes. The participants’ level of knowledge about the special needs groups was not predetermined. The results would have been more meaningful if knowledge about and attitudes toward people with disabilities were included as variables in the study. It is difficult to draw comprehensive implications when social distance was related only to demographic factors. Due to the varying nature of exceptionalities, there may be an outright bias particularly toward individuals with invisible disabilities, as they are among the least understood groups. Fifth, the relationship between social acceptance and contact with individuals with special needs was analyzed through the total score for all special needs groups. Researchers can reach more detailed findings if they consider that contact and social acceptance may vary depending on the type of special need (Barr & Bracchitta, 2015). Finally, given that negative attitudes toward individuals with special needs mainly stem from the lack of knowledge about them, informing the society about special needs would be an effective way to eliminate negative attitudes (Hayward et al., 2021). Parents and schools also have their own responsibilities in eliminating social distance toward individuals with special needs within the society. Negative attitudes should be obliterated starting from childhood.
Footnotes
Declaration of Conflicting Interests
The author(s) declared no potential conflicts of interest with respect to the research, authorship, and/or publication of this article.
Funding
The author(s) received no financial support for the research, authorship, and/or publication of this article.