
Abstract
Cost overrun is a global issue plaguing transportation infrastructure projects, and the rail industry in the United Kingdom is not exempted. This industry plays a significant role in stimulating the country’s economic development and growth in the United Kingdom (UK). Understanding the factors contributing to cost overruns in rail projects is viable to sustain its contribution, especially in the COVID-19 epidemic era. This study analyzed and predicted the impact of cost overruns on rail projects in the UK in a COVID-19 pandemic era through a sparse network and system dynamics approach. It leverages a review of existing literature and perceptions of 80 construction professionals purposively to establish the factors affecting cost overruns affecting the UK rail construction sector. Findings reveal a web of causations that highlights labor productivity, delay in the supply of construction materials and equipment, and access to the site as fundamental predictors of cost overruns during a COVID-19 pandemic era. The resulting findings are beneficial to assist project managers with the needed awareness to strategically plan and mitigate the potential rise in cost overruns of rail projects in the UK during the pandemic.
Introduction
Cost overruns in rail projects continue to be large. The implementation of rail projects, considered large infrastructure projects as costly and continues to experience cost overruns (Narayanan et al., 2019). For example, Love et al. (2017) cited the most recent Edinburgh tram system in the United Kingdom (UK), which was completed over 100% over budget. In the United States (US), several rail projects such as US$1.8 billion central link light-rail project in Seattle, Phoenix’s US$1.07 billion East Valley light-rail project, San Francisco’s US$1.2 billion airport heavy-rail project and Los Angeles’ US$3 billion heavy-rail red line project were completed 38%, 31%, 30%, and 47% over budget, respectively. Likewise, in the Netherlands, an average rail project implemented is completed 10.6% over budget (Cantarelli et al., 2012). Flyvbjberg et al. (2004) observed that cost overrun is a pervasive phenomenon peculiar to infrastructure projects, and it cut across different project types, geographical location, and historical period. This is in line with Cantarelli et al. (2012) assertion that cost overrun remains an ongoing problem in the last seven decades. Bahra (2019) concluded that cost overruns in major railway projects remain a major concern not just in the UK but globally. Rail projects are megaprojects consuming large capital outlay, and just 1% cost overrun in such projects can be considered detrimental to budgets and profits. For instance, a rail project estimated at £10 billion with just 1% overrun would amount to £100 million. A 10% cost overrun will be an additional £1 billion. Love et al. (2017) discussed the probabilities of cost overrun with the range of 1% to 30%. However, they did not address the direct impact of the incremental changes in cost on other relevant variables such as payment delays, delivery delays; planning; weather conditions, skilled manpower, implementation, and estimating errors from a non-linear perspective. Non-linearity of the benchmark and causations of cost overrun is an unexplored area in rail cost overrun.
Similarly, other authors, such as Pagoni and Patroklos (2019), Rothengatter (2019), Xu et al. (2012), and Flyvbjergy et al. (2004) have not considered the dynamic interaction between the causations of cost overrun in rail projects. The analyses in this study intend to bridge this research gap. Given this background, this investigation will analyze cost overruns in rail projects in the UK in a COVID-19 pandemic through a system dynamics approach. Furthermore, there is a need to study the impact of the existing causation of rail cost overrun during epidemics such as COVID-19. This study intends to understand the non-linear dynamic relationship between focal causations of cost overrun during the COVID-19 pandemic. This study will also contribute to further understanding the impact of cost overrun causations on rail projects during a pandemic scenario.
Cost Overrun in Rail Construction
Aziz et al. (2012) and Obi et al. (2017) argued that appropriate and effective project cost management is essential in avoiding project overrun. However, available evidence continues to suggest that cost overruns are a persistent feature of rail projects (Love et al., 2016). Scholars have identified different factors resulting in cost overrun in rail projects in the UK. For example, changes to a rail project’s scope due to uncertainty and unpredictability during project construction or design are a major technical driver of cost overruns. PlanGrid (2019) argued that even when it is perceived that project resources and time have been allocated efficiently, it is unlikely that project tasks can be conveyed with no variations during the construction stage.
Likewise, payment delays by the clients may prompt an increase in the cost of projects as contractors increase their overhead costs to cover such risk (Aljohani, Ahiaga-Dagbui & Moore, 2017). Postponed or late payment to contractors for ongoing and finished works is an exceptionally normal complaint of contractual workers about projects client. This seems to happen more regularly in government-financed rail projects because of an ordinarily reasonable payment procedure. The inability to pay contractors on time for ongoing and finished works will make it hard to meet the project goals and objectives.
Furthermore, Aljohani et al. (2017) and Ahiaga-Dagbui et al. (2017) observed that the industry lacks the required skills and expertise in managing such infrastructure projects. Due to uncertainty, such infrastructure projects often become increasingly complicated, thus putting pressure on the project schedule (i.e., duration). The absence of appropriate and required skills and expertise that could respond promptly and appropriately to such uncertainties will increase the expense of actualizing a project. Lack of appropriate and required skills and expertise is thus perceived as one of the primary drivers of cost overrun.
Inaccurate project cost estimation is also a major cause of cost overrun in rail projects. Cost estimating involves gathering, recovering, and controlling both cost and non-cost information for project purposes (Ramabhadran, 2018). However, due to incomplete data gathered and poor forecasting models used, the accuracy of project cost estimates are often reduced. This is consistent with Brunes and Lind (2014) and Subramani et al. (2014) argument that cost overrun in a project could emerge from project resources becoming costlier than assessed. Aljohani et al. (2017) and Amadi and Omotayo (2017) added that the high level of uncertainty involved in this type of infrastructure project potentially create flaws in the project cost estimate.
In addition, poor material management and logistics remain a significant influence of cost overrun in rail projects. Adequate management of construction materials is important in the execution phase of any infrastructure project (Love et al., 2016; Rode et al., 2020; Soudbakhsh et al., 2017). Hence, poor material administration could result in the danger of obtaining expensive construction materials to avoid delay, thus resulting in project cost overrun. For complex and enormous infrastructure projects such as rail projects, exceptional materials are often required, and the danger of bringing in the delay is raised as the rail industry relies upon the worldwide market to give such materials.
PlanGrid (2019) stated further that project design errors could lead to the approval of faulty or incomplete designs, ultimately leading to poor cost estimates. A flawed or poor design is therefore referred to as a defective plan and has some trait of mistakes in it. In this light, Cunningham (2017) and Flyvbjergy et al. (2004) asserted that it is likely impossible to have a structure in place to allow construction activities to be carried out exactly according to the principal unique drawings. This is because every project implemented commence with vague or inadequate stakeholder requirements.
The nature of a construction site is also perceived as a significant cause, which is mostly ignored, but often results in cost overrun. Flyvbjergy et al. (2004) argued that even when construction sites are inspected by skilled professionals such as the architects and land surveyors, uncertainties still wait for the project team. The author emphasized that lacking soil data to be a major challenge here. This is because clients are often indisposed in investing additional funds for site examination. Hence, unforeseen ground conditions often lead to deferrals, variations, and claims upon the commencement of the actual construction activities. It is also argued that the biggest component of technical and financial hazard lies in the ground.
Flyvbjergy et al. (2004) stated further that ineffective strategic planning and project execution, which involves poor or inadequate comprehension of the construction procedure on the client or project management team or both, also prompt cost overrun. For example, when a project client does not have a good picture of what they need or require, it will prompt project team members to start making assumptions as to what will satisfy or meet the needs or requirements of such client.
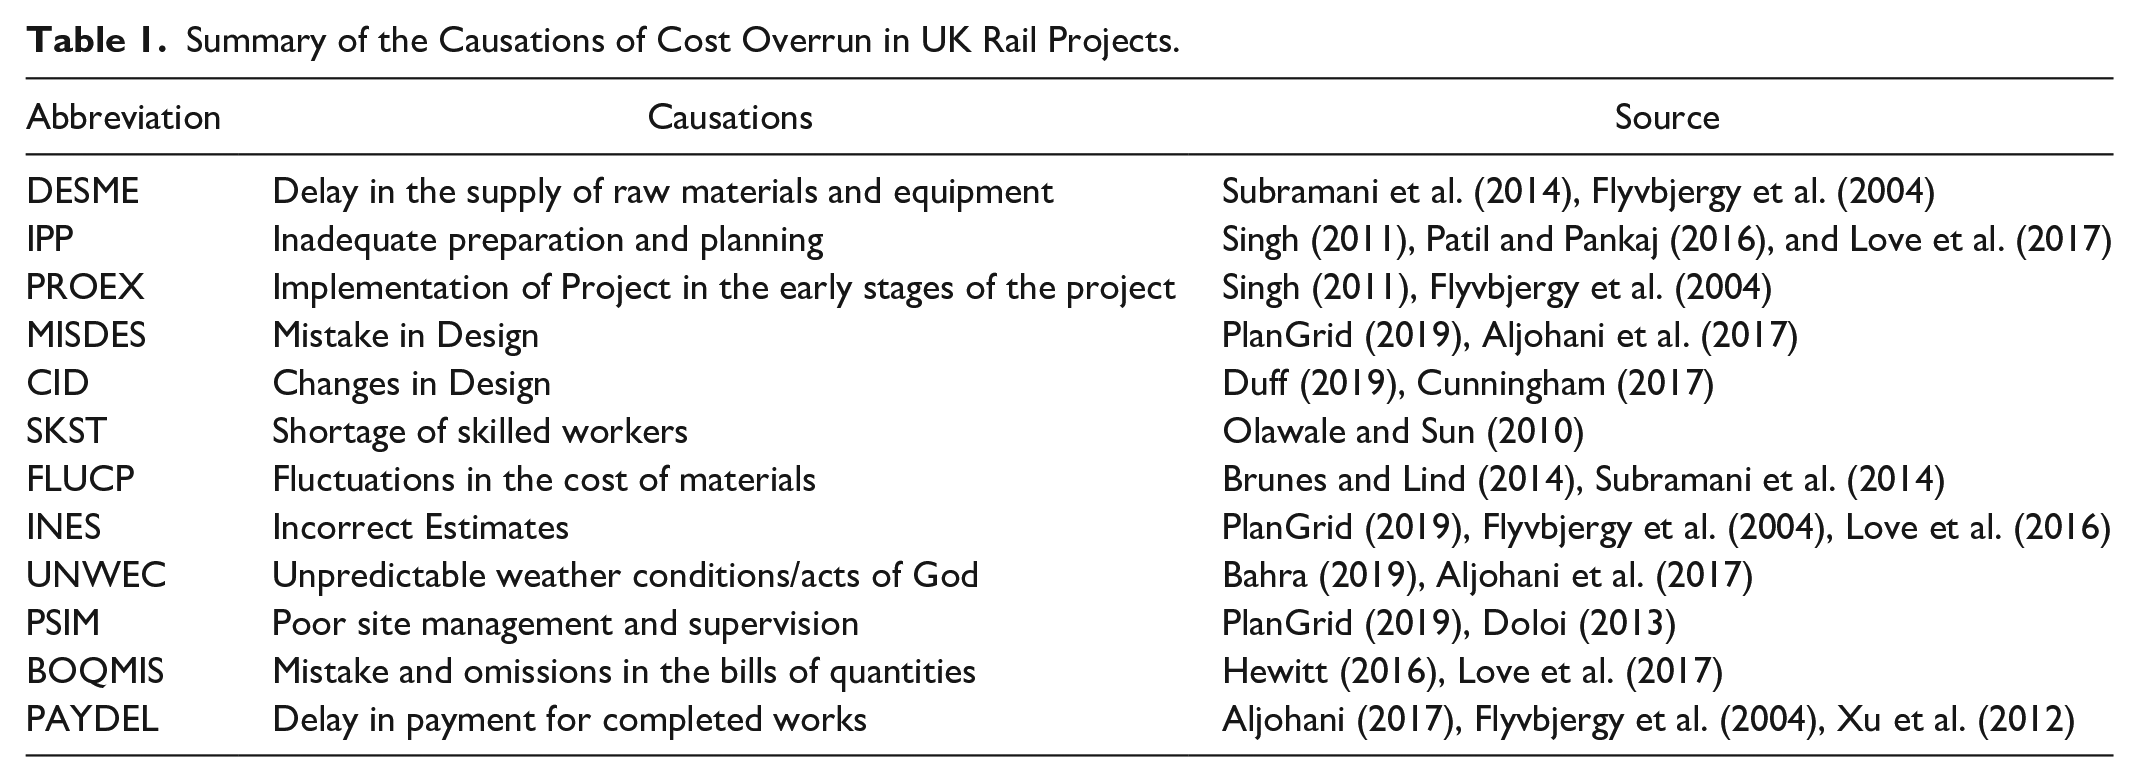
The possible cost overrun causation is further summarized into 12 factors, as shown in Table 1. Understanding the causes of cost overruns is central to developing effective remedies. Love et al. (2017) recognizes that political, economic, mental, and administrative factors may prompt the age of pathogens emerging in projects. Hence, the authors pushed for a “balanced approach” that spotlights how to process, and technological developments can be utilized to improve the cost presentation of infrastructure projects. In general, aiming to comprehend “why” and “how” projects go over budget can help give a better insight and be utilized to dependably foresee cost overruns. Given this background, this study aims to understand and evaluate the causations of cost overrun in UK rail projects through a system dynamics approach.
Summary of the Causations of Cost Overrun in UK Rail Projects.
Research Scope
Considering the plethora of cost overrun causation in the construction industry, unfractured rail delivery in the UK is unique. Table 1 has taken the leading causations of cost overrun in rail construction from the different referenced sources for this analysis. This narrow scope of causations of cost overrun in rail infrastructure provides a focal point of network and system dynamics in delivering rail projects during COVID-19 in the UK.
Methodology
Love et al. (2016) identified disparities in methodological approaches in cost overrun research. These disparities bother around sampling techniques and quantitative and qualitative cost overrun data evaluation. Flyvbjerg et al. (2018) clarified the problem identified by Love et al. (2016) opined that cost overruns must be viewed for a specific project type, and the right sample population must be adopted. The major challenge of sampling techniques in cost overrun causation research is that there is more focus on the project than the construction stakeholders making the decisions within the project. This study focused on the civil engineers (CE), commercial managers (CM), and quantity surveyors (QS), who are the main decision makers in rail construction projects. Notwithstanding, the scope of the data collected is mainly rail construction. Data from 80 construction professionals who have a minimum of 4 to 25 years of experience in rail construction experience were purposively extracted from the UK rail construction sector. The 25 years was not the maximum benchmark for the participant’s profile in this study.
Moreover, upon extraction of the data, the highest years of experience from the respondents informed this figure. The purposive sample technique took users a cross sectional time frame and isolated the professionals involved in rail construction projects rather than the larger sample frame across the UK. The questions asked in this analysis covered the cost overrun benchmarks of >5%, >10%, and >20% as viewed from a Likert scale standpoint of the factors identified in Table 1. A Likert scale assumes that an attitude’s strength/intensity is linear, that is, strongly disagree on a spectrum, assuming that attitudes can be measured (Pallant, 2020). Thus, the questionnaire used the ratings 1 to 5 as a tool in asking the respondents to compare different items on the Likert Scale. (1) is Not important; (2) Least important; (3) moderately important; (4) important; (5) Most important. Other questions asked in the questionnaire addressed benchmarks and years of experience.
The first step in analyzing the data involved reliability analysis for suitability. The descriptive statistics revealed the distribution of the data for further analysis. A sparse network was generated across the lines of the cost overrun benchmarks. The output of the sparse network analysis provided weighting of the causations. The weightings were used in developing the system dynamics model. The final phase of this study looked at the impact of the COVID-19 epidemic on the causalities of cost overrun in UK rail infrastructure development.
Findings
This findings section covers reliability, descriptive, network, and system dynamics analysis for the causations of cost overrun in UK rail construction.
Reliability Analysis
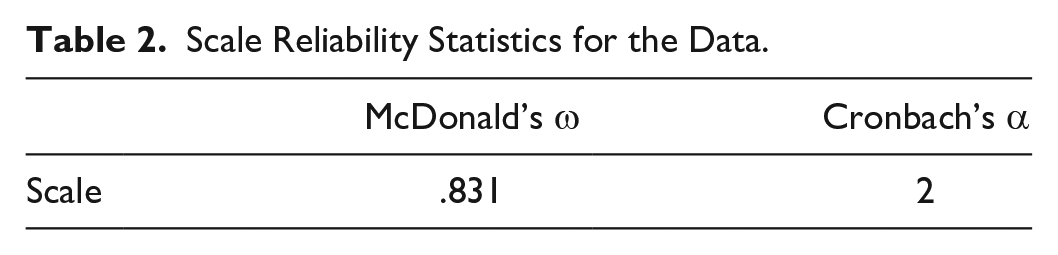
In assessing the reliability of the data collected, the scale reliability measured the McDonald’s ω and Cronbach’s α. The nearer the values to 1, the stronger the reliability of the data (Zinbarg et al., 2005).
From Table 2, the McDonald’s ω and Cronbach’s α values of .831 and .817 represent strong reliability.
Scale Reliability Statistics for the Data.
Preliminary Overview of Data
The descriptive statistics were prepared to provide a clearer overview of the sample size distributions across the respondents and the factors. As stated earlier in the methodology section, years of experience is very important in selecting the respondents. As indicated in Table 4, five CEs part of this study and their mean years of experience is 15 years. The 25 CMs and 50 QSs have 20 and 13.1 years, respectively. The distribution of the respondents reflects design (CE), rail construction cost management (QS), and rail construction management (CM).
The perception of the benchmark placed on rail cost overrun is different for each construction stakeholder. In Table 3, CEs noted a mean value of >5%, and CMs noted that cost overrun should be from >8% and QSs have a mean value of 13.5%, but with a maximum value of 20%.
Descriptive Statistics Showing Years of Experience and Benchmark.

The factors in Tables 4 to 6 differ amongst the three focal stakeholders in this analysis, considering the Likert scale of importance.
Descriptive Statistics Showing DEMSE, SKST, BOQMIS, and MISDES.

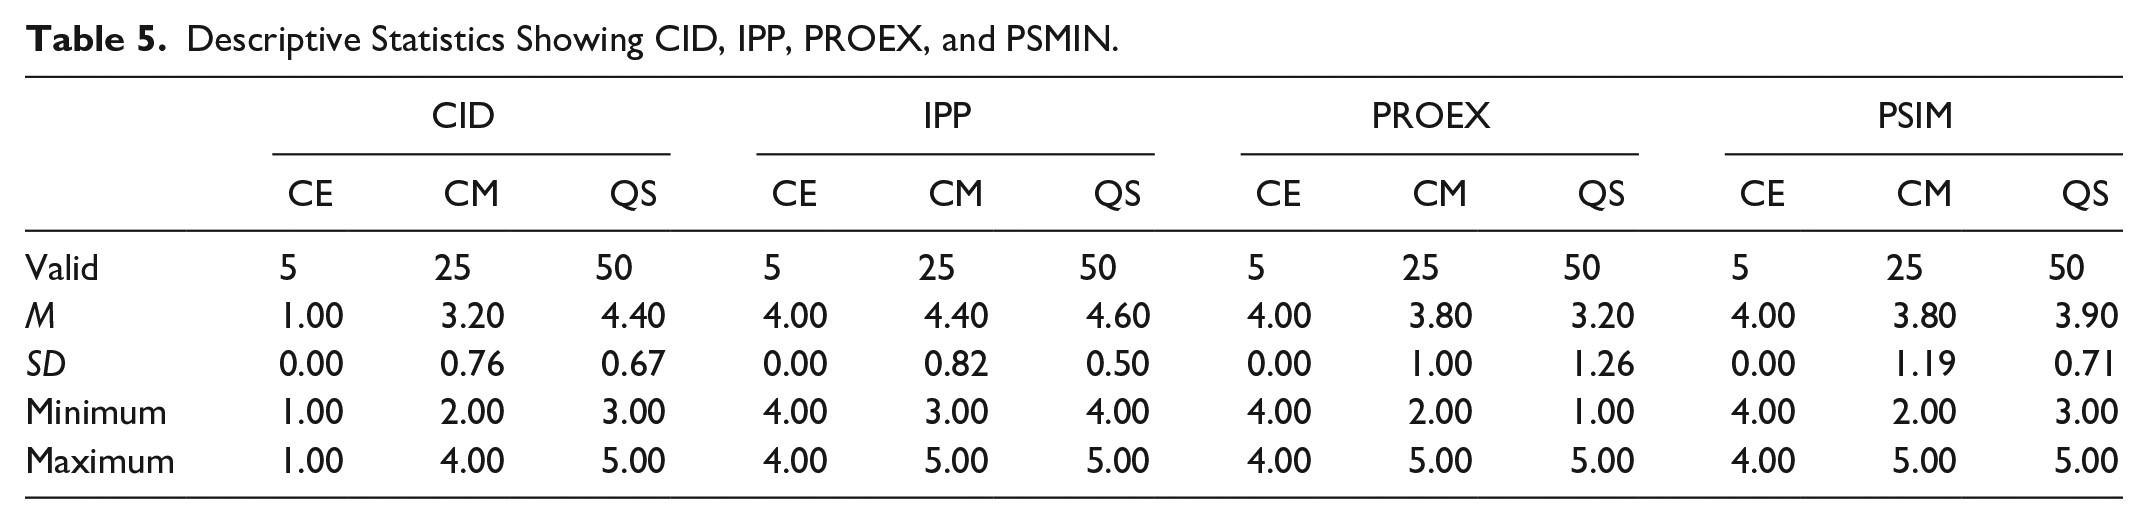
Descriptive Statistics Showing CID, IPP, PROEX, and PSMIN.
Descriptive Statistics Showing the INES, UNWEC, PAYDEL, and FLUCP.

Delay in the supply of materials and equipment (DESME) have averagely low importance to the respondents, with the QS having a mean of 3.1, which implied neutral. Shortage of skilled manpower (SKST) is perceived as important to CE and QS (4.0 and 3.9, respectively), but the CM is neutral at 2.4. Mistakes in BOQ (BOQMIS) is approximately important from the viewpoint of the QS, but CE and CM consider it to be a least important factor. The assertion mentioned above can be said for mistakes in design (MISDES). The QS also considers MISDES an important (4.0) causality, but the CE and CM still consider it the least important.
Additionally, changes in design (CID) are only important to the QS (4.4), and the CE’s least importance is accorded to CID. Inadequate preparation and planning (IPP) are considered an important causality to all the respondents and, more importantly, to the QS (4.6 approximately 5.0). Implementation of Project in the early stages (POREX), which is about execution, is also important to the QS and CM, but the most important causality of cost overrun in rail projects to the CE. Poor site management and supervision are considered an important causality to all the respondents (averagely 4.0). Inadequate estimation (INES) is considered important to the QS but least important to the CE. Unpredictable weather conditions (UNWEC) is viewed as not important to the CE but moderately important to the QS (3.2). Payment delays (PAYDEL) as a causality of cost overrun is not important to the CE and CM but least important to the QS. Fluctuations in prices of construction materials (FLUCP) is important to the QS as causation of cost overrun in UK rail infrastructure. FLUCP is not important to the CE and CM.
Sparse Network Analysis
The sparse network analysis was conducted to quantitatively analyze the strength of the relationships between the causations of rail cost overrun identified in Table 1. Nykamp (2020) opined that a sparse network is a collection of nodes or vertices connected with links otherwise known as edges. Furthermore, the blue lines indicate positive connections, and the red lines are the negatives. Table 7 presents the summary of the sparse network for the benchmarks of cost overrun. The values greater than 5%, 10%, and 20% are the perspective of cost overruns in UK rail construction. A total of 12 nodes represent the causations and possible 66 out of 60 links within each network. The sparsity of 0.00 connotes a sparse network. A sparse network is the opposite of a dense network, and it is a representation of few links compared to the possible number of links in a dense network. Furthermore, sparse networks also signified an intelligent network.
Summary of Sparse Network.

The first sparse network plot of >5% cost overrun in Figure 1 indicates the strongest connections of 1.0 between unpredictable weather conditions (UNWEC) and delay in the supply of materials and equipment (DESME); UNWEC and fluctuations in prices (FLCUP); and DESME and FLCUP. Hence, UNWEC, DESME, and FLCUP all strongly influence cost overruns in UK rail construction. Changes in design (CID) also has a strong connection with inadequate preparation and project planning (IPP; 0.907); project execution at the early stages (POREX; 0.821); incorrect estimates (INES; 0.864); unpredictable weather conditions (UNWEC; 0.981); delay in the supply of materials and equipment (DESME; 0.981); and fluctuations of prices (FLCUP; 0.981). Changes in design effect and are also affected by the abovementioned factors. For instance, changes in the design of a rail track will drastically affect the estimates, supply of materials to the site, and project execution. Fluctuations in the prices of rail construction materials from the suppliers will also influence some of the changes in design. The values stated above are replicated across the matrix. Consequently, other causalities outside the network of CID will be subsequently discussed.

Network plot for >5% cost overrun causality model.
The correlated matrix further shows a stronger relationship between the delays in the supply of rail materials and equipment for construction (DESME) and inadequate preparation and project planning (IPP) and 0.9360. In reality, cost overrun is likely to occur in rail projects when delays result from inadequate preparation and planning. The more delays accumulated during construction projects, the higher the likelihood of cost overrun emerging. Mistakes in the BOQ (BOQMIS) result from inadequate preparation and planning (IPP), as reflected in the value of 0.901. The effect of fluctuations in the prices (FLCUP) of rail construction materials such as ballast, slippers, and equipment will be more significant when inadequate preparation and planning are in place. The correlated matrix and the network plot provided a value of 0.9350 to support this evidence (Table 8).
Correlated Weighted Matrix for >5% Cost Overrun.

Poor execution at the early states (POREX) is also strongly linked with mistakes in design (MESDES) with a value of 0.915. Shortage of skilled manpower (SKST) correlates with mistakes in design (MESDES). The value of 0.818 connotes that unavailability or unskilled manpower on site may lead to misinterpretation of the design for execution. Furthermore, delays in the supply of rail construction materials and equipment (DESME) strong ties with MESDES. This may arise from poor project planning and execution.
Under the perspective of cost overruns greater than 5%, BOQMIS; CID; IPP; POREX; DESME; FLCUP; and MESDES all have correlated matrix average values above 0.6. This denotes a stronger impact on the causalities of cost overrun in rail infrastructure development in the UK. The negative values in Table 9 and red lines in Figure 1 are the weakest connections for rail projects with cost overruns greater than 5% but less than 10%.
Correlated Weighted Matrix for >10% Cost Overrun.

Rail construction projects with more than 10% cost overruns in the UK will have another unique set of causality interactions. Table 9 and Figure 2 presents a network of less positive interconnections between the causalities of cost overrun. Changes in design (CID) have a weaker correlation matrix average of 0.231 compared with >5% cost overrun value. Payment delays (PAYDEL) is more significant in the >10% network and has stronger connections delay in the supply of materials and equipment (DESME) and fluctuations in prices (FLCUP) with 0.7971 and 0.682, respectively. In the network plot for >10%, the shortage of skills (SKST) for rail construction is also very dominant. SKST influences payment delays (PAYDEL, 0.638); mistakes in the bill of quantities (BOQMIS, 0.776); and mistakes in design (MISDES, 0.872). Shortage of skills required to prepare nearly faultless bills of quantities and designs is one of the problems leading to the delays in execution of rail projects and inevitably cost overruns. DESME is also associated with BOQMIS, with a value of 0.882. From a realistic perspective, if there are mistakes in the bills of quantities, there will be delays in the supply chain. Under the >10% network, PAYDEL; BOQMIS; DESME; FLCUP; and SKST are the most influential causations of cost overruns in UK rail projects.

Network plot for >10% cost overrun causality model.
About 20% cost overrun and greater values present more peculiarities in addressing cost overruns in UK rail projects. The plausible increment in cost overrun will further reveal another set of pronounced causalities. Table 11 and Figure 3 show more negative connections between the causalities. Inaccurate estimates (INES) and shortage of skilled workers in UK rail construction have the strongest relationship in the matrix, as indicated with a value of 1.0. This signifies that the inadequacy of estimates results from a shortage of skilled workers to prepare accurate bills of quantities. Other strong influential causations of cost overrun are inadequate preparation and planning (IPP) and poor site management (PSIM), valued at 0.939; inadequate estimation (INES) and IPP (0.817); and IPP and DESME (0.939). PSIM is also strongly connected with project executions (POREX; 0.939). Mistakes in design (MISDES) and PSIM have a correlation value of 0.769. Changes in design (CID) and fluctuations in prices (FLUCP) have a correlation value of 0.910. Shortage of skilled workers (SKST) strongly influences IPP and POREX with dual values of 0.817. SKTS also affects DESME with a value of 0.783 (Table 10).

Network plot for >20% cost overrun causality model.
Correlated Weighted Matrix for >20% Cost Overrun.

Within the >20% sparse network, the inaccurate estimates (INES), delay in delivery of materials and equipment to the site (DESME), and poor site management (PSIM) is significant causations of cost overrun with weighted averages of 0.322, 0.424, and 0.424 respectively. However, the most significant causation in the network is poor execution at the early stages (POREX) and inadequate preparation and planning (IPP). This duo both a mean correlation of 0.459. A comparison of the >5%, >10%, and >20% network diagrams and correlated matrix tables reveals that the higher the cost overrun percentages, the more negative connections (red lines) exist within the system. Hence, there are lesser interactions between the causations of cost overrun as the cost overrun increases.
In general, Table 11 provides a mean ranking of the correlation coefficients identified delay in the supply of rail construction materials and equipment as the most important, with a mean value of 0.5035. This is seconded by inadequate preparation and planning (0.4298). Poor execution at the early stages of rail projects can lead to a major challenge in delivering is third on the list with a value of 0.4034. Mistakes and changes in design are ranked as fourth of fifth with average values of 0.4009 and 0.4007, respectively. From the bottom of Table 12, payment delays are ranked 12th (0.1008).
Average Weightings Across the Network Diagrams.

Parameters, Values, and Equations for the Stock-Flow Diagram.

These averages are taken across the three networks plots and thus reflect a trajectory of causations of cost overruns in UK rail development. The application of mean rakings is very basic and does not reflect the overall influence of each causation on rail construction. Hence, there is a need to provide a deeper analysis into how the identified causations work together as a system to produce cost overruns. Every construction project is a system on its own. Combining these projects as clusters creates a larger system in the form of the construction industry. Consequently, it is imperative to address the evaluation of the causations of cost overrun in rail projects from a more realistic perspective.
As applied by Rothengatter (2019) and Xu et al. (2012) are system dynamics. Although system dynamics has not been applied to investigate the impact of cost overrun causations on each other and the project, this analytical approach fills a major unexplored by notable studies conducted by Eden et al. (2005), Flyvbjerg et al. (2018), Love et al. (2017), Reichelt and Lyneis (1999), and Rothengatter (2019). The weighted mean values in Table 12 will be used as parameters for the stock-flow diagram.
System Dynamics: Causal Loop Diagram and a Stock-Flow Diagram for the Causation of Cost Overrun in UK Rail Projects
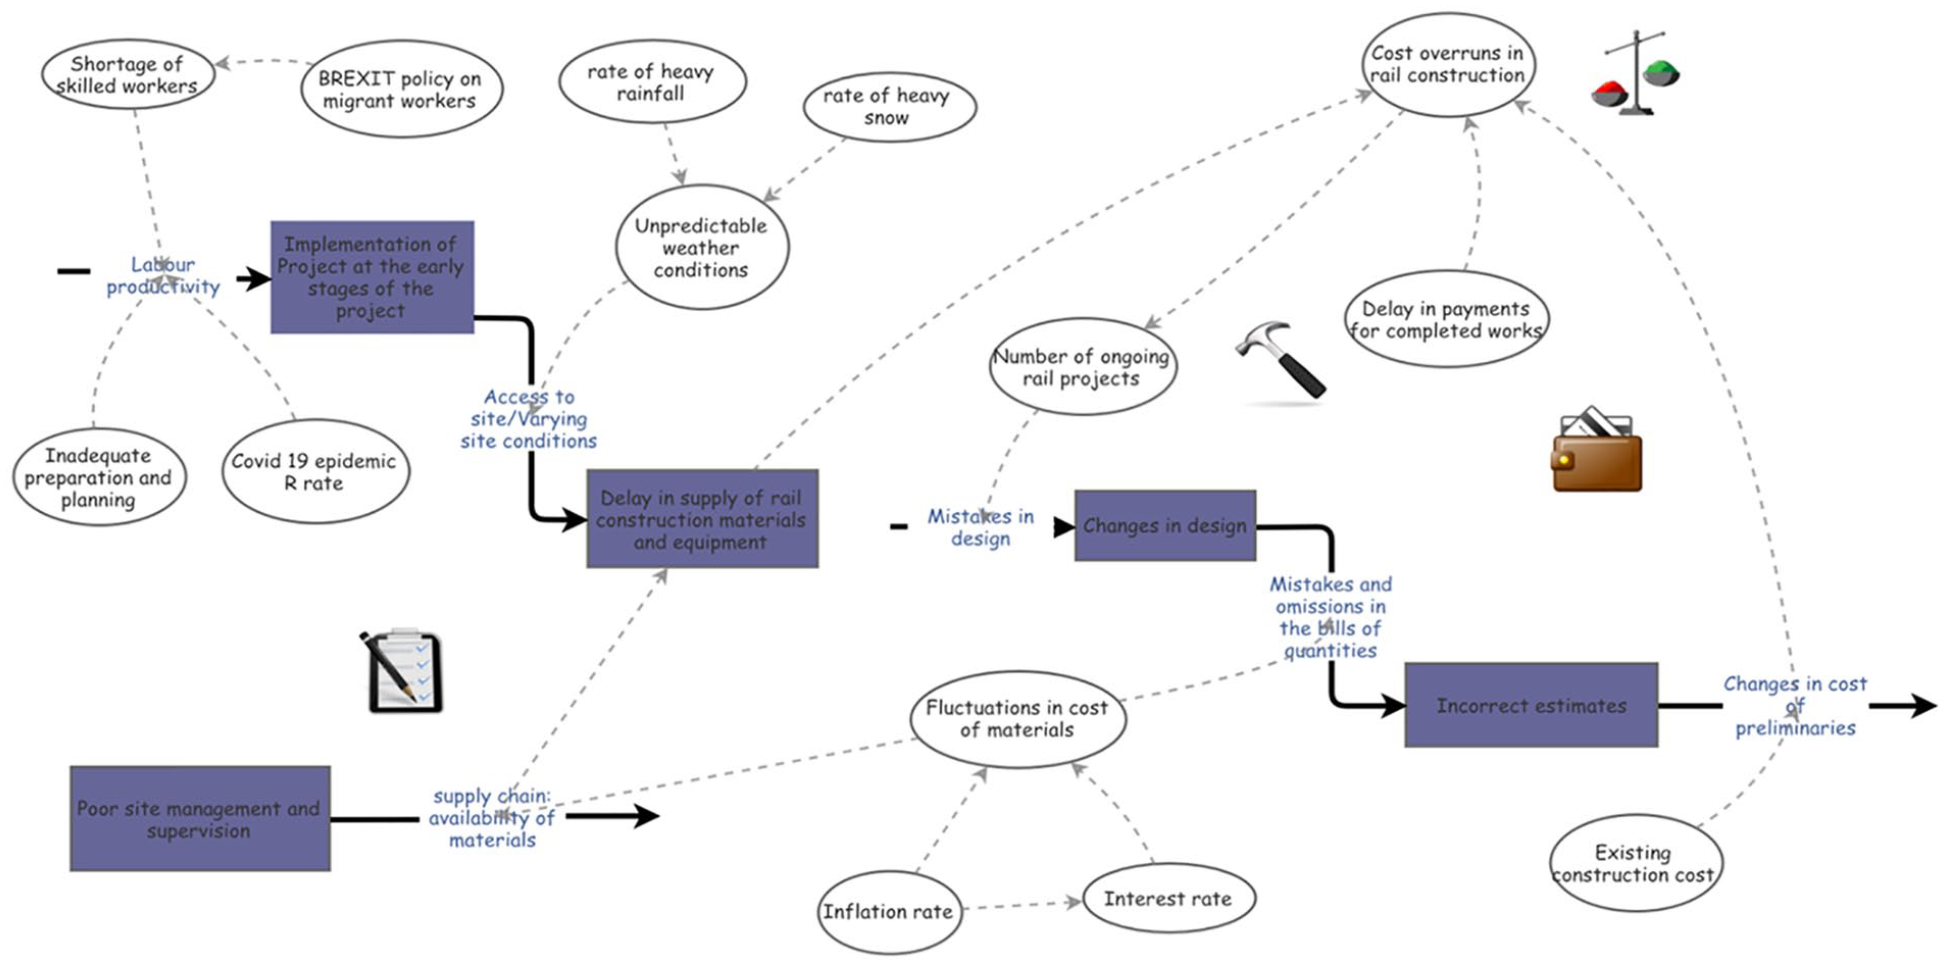
The systems thinking causal loop diagram is usually used to express the causal relationship between two or more variables that may not be identified with quantitative or qualitative analysis (Omotayo et al., 2019; Uchehara et al., 2022). Prior to developing the stock-flow diagram showing the quantitative interactions between the variables in Table 11, the causal loop diagram in Figure 4 was produced.

Causal loop diagram showing the relationships between the causations of rail cost overrun.
In Figure 4, the COVID-19 epidemic variable negatively impacts labor productivity, supply chain, access to the site, delays in the supply of rail construction materials and existing construction. The Reinforcing loop R1 and R3 respectively show the interactions between unpredictable weather conditions, access to construction sites, shortage of skilled workers, project implementation, labor productivity and poor site management, payment delays, incorrect estimates, and mistakes in design.
The balancing loops B1 to B4 expressed the causalities of how access to rail construction sites delays delivery of rail construction materials and equipment, changes in initial costs affects productivity and site management, and the construction process. Furthermore, B4 reflects how cost overrun in rail projects reduced the number of rail projects that may be executed effectively. The system dynamics of Figure 5 aid the validation of the causal loop diagram in Figure 4. The Insight maker online tool was used to model the causal loop and stock-flow diagram in Figures 4 and 5. Insight Maker (2021) was chosen over VENSIM PLE because it is easily accessible and provides high definition charts.
Stock-flow diagram for the causation of rail cost overruns in the UK.
Jay Forrester created system dynamics in the 1950s as a modeling methodology for decision-makers (Boateng et al., 2016). System dynamics helps decision-makers analyze complex social issues. Boateng et al. (2016) further described the system dynamics stock-flow diagram as:

Where ∫[flowstotalt0(s) is a function of the total flow in the system.
The stock-flow diagram illustrates how a system may increase or decrease when a rate of variables sways the stock. For instance, in Figure 5, mistakes in design will affect the level of changes in the design. Labor productivity will affect the implementation of a rail project at early stages. The output of a stock-flow diagram is the simulation of events over a period of time. In this analysis, equations were designed in Table 12 for the simulation.
In addition to the data in Table 12, current cost overrun influencing data such as the UK inflation rate; current interest rate as the 26th of June 2020; and annual rainfall and snow data were taken from the UK statistics website (Bank of England, 2020; Current results, 2020). The inflation and interest rates will affect possible price fluctuations (FLCUP). The annual UK rainfall (23.5) and snow rates (15.6) will influence unpredictable weather conditions (UNWEC). Furthermore, the UK BREXIT policies will affect the availability of skilled workers in the UK through the current immigration policies. The tenure of the British Prime Minister is 5 years. This figure can affect the BREXIT immigration policies on migrant construction workers. The current COVID-19 infection rate (R rate) when writing this article is between .7 and .9 (Crown, 2020). This value represents a −2% to −4% change in the COVID-19 rate of infection as it affects labor productivity and construction project delivery. The number of new rail construction ongoing projects in the UK is worth about £52 billion as of 2019 (Institute for Government, 2020). The number and value of major rail projects will impact the design and overall cost overrun of a project.
The equations in Table 12 were designed to simulate multiplying factors over an assumed period of 60 months (5 years) during a COVID-19 era. The first simulation addressed rail cost overruns in the UK with a 0 COVID-19 infection rate, and the validation final validation phase conducted a reality check on the current COVID-19 R rate of .7 to .9. A comparison of the pre-COVID-19 and COVID-19 rail cost overrun era were discussed in the subsequent section.
The stock-flow diagram in Figure 4 was designed following the sparse network diagram. This process has boycotted the causal loop diagram because of tripartite network diagrams (Figures 1–3). Furthermore, additional cost overrun variables that should have been taken from the causal loop diagram were identified while developing the stock-flow diagrams. Some of these are labor productivity, BREXIT policy on immigration; changes in initial costs; existing construction cost, supply chain. Most of the stock of variables taken from Table 12 are implementation of rail project at the early stages; poor site management and supervision; delay in the supply of rail construction materials; changes in design and incorrect estimates. Auxiliary variables interact as a driver within. The process of selecting a variable as stock, flow, or auxiliary depends on their interaction as a dependent or independent variable. As an illustration, the shortage of skilled workers as affected by the BREXIT policy will influence the rate of labor productivity on site. The labor productivity will regulate the stock of implementation value on site.
The final output of the stock-flow diagram is the level of cost overrun when considering the number of major rail projects, delay in the supply of rail materials and equipment, delay in payment, and changes in the cost of preliminaries.
Cost overrun for 60 months shows a starting factor of 15.96 in the y axis in Figure 6. This factor implies the cost overrun percentage at the very early state considering a minimum value of 15.9 and a maximum of 17.2%. Moreover, it is expected that the prevailing combination of delays in the supply of rail materials and equipment, payment delays, and changes in the cost of preliminaries will create a 15.96% cost overrun within the first month of construction. Within 9 months of a UK rail project, it is expected that the project will have a 17.05% cost overrun. Hence, a project value of £52 billion may have an overrun of £8.87 billion. The cost is very high, leading to further complexities in delivering rail projects in the UK. The percentage falls drastically after 10 months of construction.

Time series showing cost overrun indices for rail projects in the UK.
Figure 7 shows a comparison of cost overrun and delay in the supply of materials and equipment for rail construction shows a rising factor of from 0.576 to 0.635. These values act as incremental indices in rail construction logistics and delivery.

Cost overrun and delay in the supply of materials and equipment.
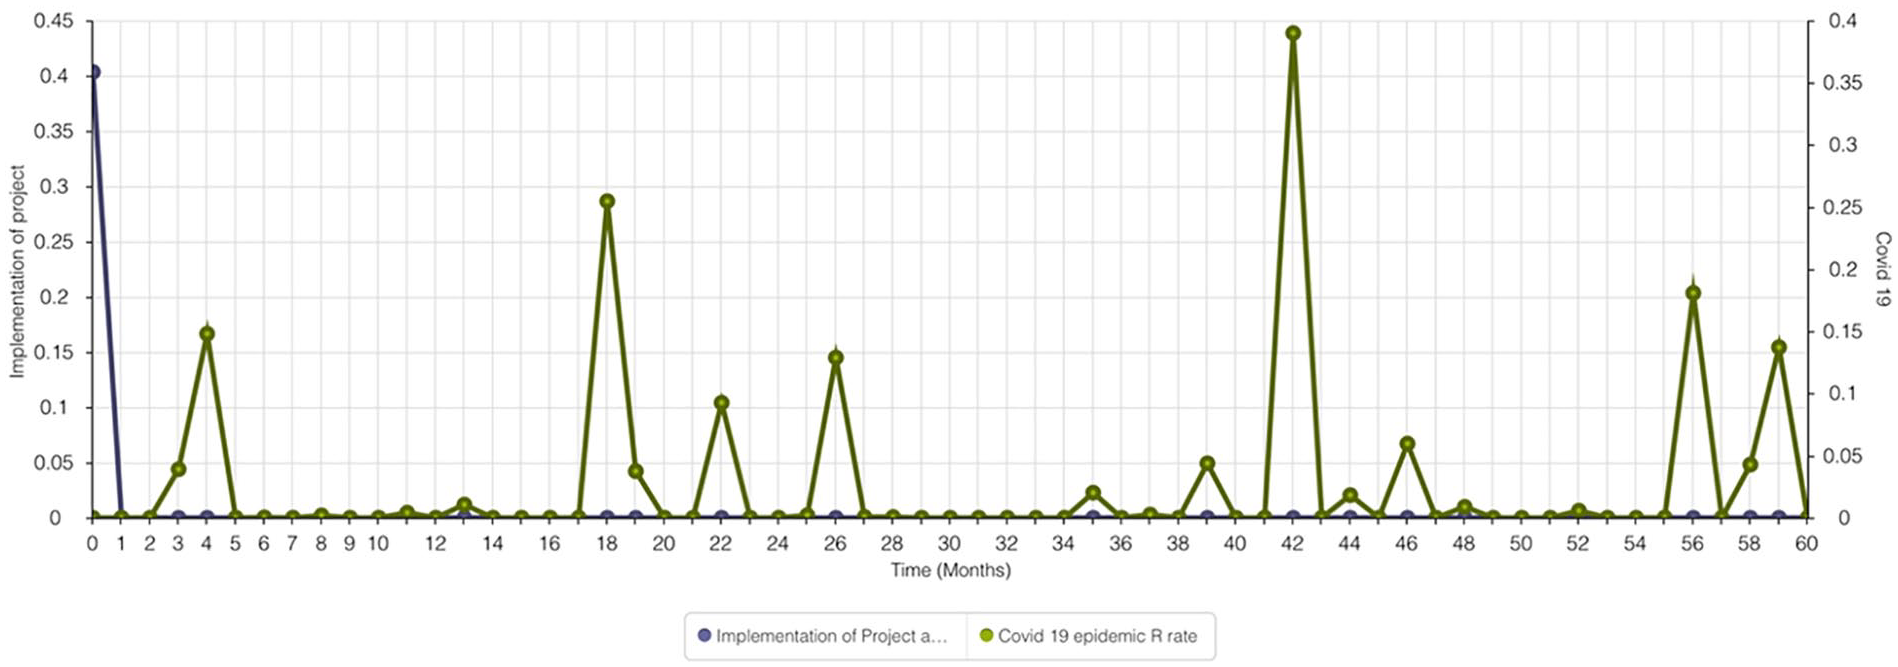
As indicated in Figure 8, the cost overrun of a project is also affected by the level of implementation at the early stages. There are higher implementation indices of 0.404, and it drastically falls within 60 months. This fall indicates an absolute implementation of the project. However, there may be challenges that end with a factor of 0.345. Thus, indicating that there will be specific rail implementation challenges throughout the life cycle of a rail project in the UK. The shortage of skilled workers and productivity influence the ease of implementing a rail project in the UK.

Cost overrun and implementation of rail projects at the early stages.
The changes in the cost of preliminaries such as security cost; temporary offices; safety and environmental control; subcontractor’s cost, insurance; mechanical plant and site establishment, just to mention a few, tends to decrease throughout the phases of a rail construction project. Figure 9 reflects a complete decrease at 20 months of construction. At the inception phase of execution, there is a multiplying factor of 0.075 in changes to the existing cost of preliminaries. For example, if the preliminaries cost is £10 billion, the changes will be £10b × 0.075 = £0.75b. The large change in the cost of preliminaries can emanate from incorrect estimates, mistakes, and omissions in the BOQ; changes and mistakes in the civil engineer’s design.

Cost overrun and changes in the cost of preliminaries.
Figure 9 presents access to a site, and the site conditions can also affect the delivery of materials and equipment to the site. Throughout the cost overrun, the challenge of getting access to the rail construction site decreases to almost 0. The indices are very minimal due to planning and implementation activities.
Incorrect estimates in Figure 10 also fall drastically for the cost overrun, just as changes in the cost of preliminaries and access to the construction site falls sharply. The maximum indices of 0.32 slumps to 0 within 20 months. The indices are also a multiplying factor of incorrectness in the contractor’s estimates 0.32 may seem small but is large when considering the construction (Figure 11).

Cost overrun and incorrect estimates in UK rail projects.

Cost overrun and mistakes in design in UK rail projects.
As indicated in Figure 10, mistakes in civil engineering rail designs fall sharper within 9 months. The maximum indices of 0.00131 can be a multiplying factor against the value of 0.6017 (as taken from Table 12). Hence the correlated factor from sparse network analysis decreases for the project.
Considering the prevailing circumstances of COVID-19, the rail cost overrun simulation may behave differently when the R rate is included in the stock-flow diagram. The validation using COVID-19 infection rate also provides a simulation of possible future challenges construction projects may experience in the instance of another epidemic.
Model Validation Using COVID-19 Epidemic Reality Check
Uniform random distribution of .7 to .9 R rate of infection for 5 years is taken at 12 months internal, considering the current R rate of .7 to .9. An assumption in this validation discounts the effect of an effective vaccine.
Figure 12 provides a COVID-19 projection for 60 months. The values in the y-axis provide a multiplying index and the existing indices of 0.7 minimum and 0.9 maximum. The first month (0) of COVID-19 starts from January 2020 and rises from March 2020 in the UK. There is a peak between April and June 2020 and a drastic fall in July 2020. Between December 2020 and January 2021, there is another rise in infection. Over the next 5 years, the infection disappears reappears erratically. The notable sharp increment is between the 40th and 43rd months (June 2023 and August 2023). The impact of COVID-19 on labor productivity in Figure 12 reflects an inverse chart (Figure 13).

COVID 19 epidemic projections.

COVID 19 and labor productivity.
The inverse chart in Figure 12 shows that if COVID-19 rises, labor productivity will fall. From Month 0 in Figure 12, the existence of COVID-19 may not fully lead to social distancing measures on construction sites but a drastic decrease in the morale of the workers on site. Labor productivity value of 2.21 falls to 1.21 within the first month of COVID 19. This value does not rise back to 2.2 but slightly to 1.2 for 60 months. Hence, COVID-19 may completely reduce labor productivity even when rail construction workers can engage in construction activities. Therefore, the simulation in Figure 12 provides a social implication based on the assumption that rail construction activities will keep taking place during COVID-19 (Figure 14).

COVID-19 and access to site/varying site conditions.
During COVID-19, there is a challenge in the access construction site, as presented in Figure 15. The problem of accessing the site incrementally rises to 10,000 compared to the chart in Figure 9, where the graph slopes downwards. The multiplying factor may result from social travel restrictions and government delays in funding rail projects.

COVID 19 and delay in supply of rail construction materials and equipment.
Just as access to rail construction sites becomes difficult during COVID-19, there is also a major delay in the supply and equipment. This delay has an incremental multiplying factor which rises to 69. Thus, restrictions in importation and travel will create more difficulties in accessing rail construction sites. Comparison to Figure 6 shows that COVID-19 creates a major impediment in delivering rail construction materials and equipment to specific sites across the UK.
The early implementation of rail construction projects during COVID-19 is almost impossible in the early phases (month 0–1, as shown in Figure 16). The complement fall in implementing rail construction projects compared to Figure 7 is almost a complete opposite.

COVI 19 and implementation of rail projects at early stages.
Incorrect estimates also fall sharply, which is no different from a pre-COVID 19 era. Figure 17 is the same as Figure 18, where the incorrect estimates are reduced within 20 months.
COVID 19 and incorrect estimates.

Cost overrun and access to site/varying site conditions.
Overall, cost overrun during COVID-19 increases massively COVID-19. Figure 19 below shows that rail cost overruns rise to almost 70% throughout a 5-year construction project. This incremental value shows an uncontrollable path that may lead to a disaster. In a scenario where all the major rail projects are halted, there will be an increase in cost overrun because of additional overhead cost, labor shortage and productivity, delays in the supply chain and payment issues such as additional overhead and funding. Although this simulation may not have included a vaccine within 18 months, if there is a vaccine, it will take an additional 24 to 36 months to get all rail construction workers vaccinated.

COVID19 and cost overruns.
The findings of the systems dynamic simulations are not entirely absolute. Notwithstanding, they provide case scenario information that has implications for the UK’s design, costing, logistics, funding, management, and delivery of rail projects. The implications are explained in the next section.
Discussion: Implications of Findings
A non-linear analysis of the causations of cost overrun in rail infrastructure delivery during the COVID-19 epidemic has been analyzed in this study. Delay in the supply of rail construction materials and equipment, inadequate preparation and planning, and project implementation at the early stages as the key causations of cost overrun in UK rail projects. Combining these trio creates immense challenges for the delivery of rail infrastructure projects in the UK and possible cost overrun. Ogunnusi et al. (2021) identified delays in payment, construction supply chain difficulties, and low turnover in businesses as some of the global challenges of COVID-19 on the construction industry. In rail construction activities, these challenges are more prevalent on the productivity of skilled workers on and offsite. In a systems dynamic scenario, COVID-19 with a uniform distribution of 0.7 to 0.9 provided a deeper understanding of how cost overrun causations behave. Labor productivity reduces by 46% within the first month of the epidemic. Delay in the supply of construction materials and equipment and access to the site increase linearly throughout the construction process. In reality, construction activities in the UK still go on despite the R rate of COVID-19. The impact on rail cost overrun and other associated causations of overrun has been measured in terms of indices. The normal causations of cost overrun are within the range of decimal values. During the COVID-19 epidemic, every month has an increment of 10%. It may not be possible to completely halt construction activities during the COVID-19 epidemic. Therefore, there is a need to look at alternative ways of motivating on-site labor for effective implementation of the design. Access to constructive sites and other forms of material and equipment delay must be prioritized during an epidemic situation. Intense schedule monitoring and control of rail projects during COVID-19 is vital. Pamidimukkala and Kermanshachi (2021) and Araya (2021) studies on the impact of COVID-19 on the productivity of construction workers support the findings of this study by further buttressing the influence of construction health and safety and technology on construction productivity. Hence, the implication of COVID-19 on rail construction cost overruns is predicated on construction workforce productivity, which invariably affects the execution of design and cost management practices. In managing the impact of COVID-19 on rail construction delivery, existing causations of cost overrun in the rail sector must be monitored for possible emergence on existing construction projects. By monitoring previously identified construction cost overruns in the UK rail section, the impact of COVID-19 can be effectively managed. Consequently, the myriad of the causations of cost overrun in the rail sector.
The implications of the findings of this study on existing rail projects across the UK is that the technicalities of design and construction cost management must be addressed through a social perspective. The management of the construction companies must seek to halt every construction activity pending the time when the COVID-19 R rate is 0.1 or 0. In the absence of COVID-19, logistics issues must be planned effectively, and access to construction sites must be addressed as a priority during the planning phases. Labor productivity in rail construction projects can be limited with poor site management, correction of mistakes made in the design, and rework errors in bills of quantities. Furthermore, the COVID-19 epidemic impacts labor productivity in a multiplicity of ways that may be phycological.
Concluding: Limitations of the Study and Future Direction
This paper aimed to understand the interactions of the causations of cost overrun in rail projects during the COVID-19 pandemic. The causations of cost overrun cannot be addressed with a cause and effect approach and, therefore, must be viewed from a network and social simulations. Sparse network plots and system dynamics analytical tools did not point out just one or two causations, but a web of causations must increase depending on the UK’s social phenomenon surrounding rail project delivery. This investigation has contributed to the knowledge gap of how construction activities may perform during the COVID-19 pandemic for 5 years. Further studies must address a larger number of causations and associated mitigating measures from the system dynamics perspective for effective practicality and implementation.
This study was conducted with limited access to rail construction professions, and thus, 80 responses were received. A medium to larger-scale data sample may yield alternative results in stock-flow diagrams’ sparse analysis. Consequently, the outcomes of the results are not finite but a simulation of how COVID-19 in the absence of a vaccinated construction workforce influences cost overrun causations in the UK. This analysis has also considered a small range of causations of cost overrun in the rail sector as part of the analysis. Further analysis of more cost overrun causations in UK rail construction will produce new analyses and dynamics.
Footnotes
Declaration of Conflicting Interests
The author(s) declared no potential conflicts of interest with respect to the research, authorship, and/or publication of this article.
Funding
The author(s) disclosed receipt of the following financial support for the research, authorship, and/or publication of this article: This research is self-funded by the authors