
Abstract
Investors are influenced emotionally when making financial investment decisions. Investing paradigms largely ignore emotions, a phenomenon explored in this study. This study used a survey to examine the relationship between emotional Finance (anxiety, happiness, and optimism), investor protection, and market knowledge and investment performance. Investors in real estate and stocks have provided us with data. We found that market knowledge plays a significant role in ensuring superior investment performance. Anxiety, happiness, and optimism are strong indicators of a higher-order construct of emotional Finance. The findings also showed that emotional Finance is positively associated with investment performance. At the same time, investor protection has been found to have no association with investment performance. Others may investigate additional components of emotions and financial decisions.
Keywords
Introduction
The conventional world of Finance assumes that intellectual prejudice has no role in the decision-making processes of individuals. People sometimes act like normal human beings rather than rational beings to maximize their decisions’ utility. Emotional intelligence refers to a person’s capability to perceive the judgments and emotions of others, as well as their ability to distinguish between such emotions to conduct their thoughts and actions. Some people have an elevated level of emotional intelligence, while others have a low one. Consequently, individuals with higher levels of emotional intelligence are better able to control their own emotions and respect the emotions of others (Kasemsap, 2018). The term “unconscious” refers to mental processes that are not readily apparent to the individual but have an immediate impact on cognitive function. This concept pertains to how individuals are driven by ideas, conflicts, and urges outside their conscious awareness (Auchincloss, 2016).
Investors often face a range of potential influences when deciding where to put their money. This study examined three such factors. Emotional Finance (EF) is the first concept that emotions can greatly affect financial decisions. The second factor, market knowledge (MK), is the understanding and awareness of market dynamics, trends, and key players. The third factor, investor protection (IP), refers to the policies and regulations that protect investors from fraudulent practices. Emotional Finance is a new field of economic thinking which makes emotions a driving force for investment decision-making and, consequently, investment performance. Traditional Finance explains explanations for all economic phenomena, specifically market anomalies, and imperfections, through rigorous data-based decisions. Emotions, feelings, fantasies, and fears play key roles in driving human efforts toward investment. Emotional Finance is the interplay of investors’ own decision emotions, such as anxiety, consciousness, happiness, and excitement in a person’s financial decision-making. Emotional Finance distinguishes between “rational” or idealized measures of risk and the “real” risks, which pertain to the inherent fears of the investors (R. Taffler, 2018). It involves the psychoanalysis of the human mind for investments (R. J. Taffler & Tuckett, 2010). Emotional Finance is when people make decisions about investment in uncertain situations through emotions (A. Dumanli & Aren, 2019). Unconscious feelings guide financial decision-making (Aren & Hamamcı, 2019). Emotional finance theory postulates that people are driven by feelings and fantasies while making investment decisions (A. N. Dumanli & Aren, 2021).
According to the theory of planned behavior, people act rationally based on their attitudes, arbitrary norms, and perceived behavioral control. According to the Planned Behavior Theory, intentions lead to actions. Thoughts do not always lead to action. Many factors influence the strength of the relationship between intention and action. These variables form the background of the decision-making process but are not always actively or consciously considered. The Planned Behavior Theory (TPB) was developed in 1980 to predict people’s behavior at a certain time and place. The paradigm of planned action theory is supported by human emotions related to economic decisions. People prioritize their actions over other considerations. TPB is the cornerstone of our research.
Several diverse themes regarding stock investment, such as hunger, fear, emotions, and preferences, influence investors. They used this to measure favorable findings, but the outcomes remain unknown. Traditional Finance operates on the premise that investors make logical decisions based on rigorous data and analysis. In contrast, Emotional Finance (EF) acknowledges the profound influence of an individual’s emotions on decision-making processes, highlighting that investors’ decisions can be significantly swayed by their emotional state. The study’s findings emphasized the need to investigate emotions’ role in financial decision-making. Analogously, there has been an emphasis on protecting investors in less efficient and highly volatile markets in recent years. In both the stock and real estate markets, emerging nations need help disseminating reliable information to prospective investors. The major purpose of the study was to examine the factors that influence the performance of investments in Pakistan’s real estate and stock markets.
This study will profoundly affect the academic community, investors, and policymakers of real estate and the stock market. Financial research has never considered the impact of emotions on investment decisions, but our findings indicate a substantial interaction between these factors. This study offers significant new insights into emotions’ role in making financial decisions. If this understanding is incorporated into educational curriculum and research methodologies, future investors will know how emotional factors may influence their investment success. These insights apply to investors of all experience levels, from novice to seasoned. Understanding the influence of emotions on one’s decision-making process could aid novice investors in making more informed decisions. Even experienced investors, who may believe they are less susceptible to emotional influences, can use this knowledge to more accurately predict the future performance of their investments by considering their subconscious emotions into account. This is because the concept acknowledges that emotional influences are frequently subconscious.
In contrast, policymakers can account for the role of emotional decision-making when crafting investor protection and market legislation. Emotional considerations could be implemented into a more comprehensive approach to protection, thereby protecting investors more effectively and fostering a more stable market environment. In conclusion, the findings of this study can be used as a guide to enhance both comprehension and decision-making processes by highlighting the effect emotional factors have on the performance of investments. We believe that by bridging this knowledge gap, we will be able to empower a new generation of emotionally sensitive investors and nurture more resilient markets.
Literature Review
EF investigates the effect intuitive practices have on shareholder dynamics and competitive dynamics. In traditional Finance, an efficient financial system requires a shareholder to act rationally to own a company’s stock which may lead to gains and losses. It creates an emotional connection between a shareholder and the company, thus leading to the creation of feelings of joy, fear, or anxiety. These emotional effects spread to his/her other investments as well. The company’s potential value, largely unknown to venture capitalists, retail investors, mutual fund managers, etc, gains greater significance. There is an expectation and hope that the stock price will increase, which is exhilarating. However, it may quickly cause a shareholder to become unsatisfied, which is undesirable and instills fear in the individual (D. Tuckett & Taffler, 2012).
Emotional Finance and Investment Performance
Emotional Finance, including anxiety, happiness, and optimism, is associated with investment performance. Making decisions by considering emotions has been discussed in literature by various researchers. Kuhnen and Knutson (2011) found that positive emotions like optimism provide confidence to the investors to make a better financial decision, and negative emotion leads to weak financial decision-making. While Sashikala and Chitramani (2017) found a significant roleplay of the emotions such as happiness, excitement, or anxiety in financial decision-making, leading to better or worse performance of investments. A study on the connection between emotional quotient and investment performance found that people with emotional quotient make better financial decisions while investing. They are risk takers and earn more than those low on quotient (Iqbal & Bilal, 2021; VanderPal, 2021) distinguished the difference between small and big investors and their investment performance. They found that small investors exhibit more emotions while investing. They make more subconscious decisions influenced by their emotions and thus lead to the uncertain financial performance of their investment. A study found a link between the experience of regret and investment performance (Novianggie & Asandimitra, 2019). Enthusiasm among investors sometimes leads them to make better financial choices among the different financial products available (Raheja & Dhiman, 2020). Similarly, a study on the impact of photographic content in the financial report found that photographs enriched with content attract investors and create feelings among investors to invest in that company. It also builds the company’s impression in the investors’ eyes (Dilla et al., 2013). On the other hand, scholars have highlighted the impact of well-defined emotional responses, such as fear and selfishness, which may lead to favorable and unfavorable performance of decisions (Lerner et al., 2015). The literature concludes that emotion plays a role in the investor’s mind while making investment decisions. Moreover, emotion may significantly decide the outcomes of the investment venture in real estate, the stock market, or mutual funds. The role of EF in investment performance has yet to be fully authenticated, although slight evidence suggests the interlink between the variables.
Investor Protection and Investment Performance
Investor protection has been a great concern for policymakers, especially in developing countries where laws are not implemented in true letter and spirit. The various legal systems and organizations establish and apply investor protection laws in several unique ways. The investor protection act was enacted to protect shareholders, given agency problems against company leaders who exploit company financial resources for their financial gains (Djankov et al., 2008). The literature review has highlighted several studies on investment protection and investment efficiency. Giannetti and Koskinen (2004) found that less investor protection in developing countries induces investors to hold foreign equities. Investor protection is associated with investment performance in your home country. A study conducted on investor protection and investment liquidity found that more protection provided to the investor would lead to more investment liquidity because investors would be continually dealings in the securities (Huang et al., 2020). From the viewpoint of stock purchase decisions, a study found that weak investor protection would decrease the investment value for local and foreign investors (Giannetti & Koskinen, 2010). Better protection of the investors reduces the stock crash risk to a minimum. Thus, IP positively influences investment performance (Zhang et al., 2017). The investment performance in some Chinese companies has been positive when more protection is offered to investors (Cai, 2014). Investor protection has been positively associated with all the indicators of investment success, from share price appreciation to dividend payouts (Ghosh & He, 2015; McLean et al., 2012). Conclusively there might be an association between investor protection and investment performance in our study.
Market Knowledge and Investment Performance
The broadcast of correct market data and information contributes to the enhancement of investment opportunities and the overall performance of enterprises. Market knowledge is an extension of economic literature that expands upon the original idea of rationality. It involves structured information about the customers, competitors, and market environment (De Luca & Atuahene-Gima, 2007). The market knowledge of a resource user can decrease the uncertainty related to the market value of resources (Gugissa et al., 2021). MK fosters certain market-level behaviors and enhances people’s degrees of awareness. Understanding the market is advantageous for minimizing potential hazards. According to Vörösmarty et al. (2018), if an investor fully understands the market, it will be easier to evaluate the risks associated with his or her company. The combination of awareness, knowledge, skills, attitudes, and behaviors required to make sound financial decisions and ultimately attain personal financial well-being (Shim et al., 2010). Using market information, investors may determine which investing actions are reliable and which are risky, according to the study’s conclusions. In addition to relevant market experience, trust, cooperation, and strength are essential to assessing if risk-takers should be allowed (Fini et al., 2019). The survey results reveal that MK and information substantially impact investment performance in the financial markets (Liang & Liu, 2018). Meanwhile, firms utilizing Market Knowledge (MK) can excel, even in international markets (Hohenthal et al., 2014). Market knowledge is essential for a complete understanding of the investment decision-making process, as it helps investors make more informed decisions and potentially avoid risk (Iqbal & Bilal, 2021).
In a similar line, the findings of this study (Jones & Martinez, 2017) indicate that the INP portfolios are entirely dependent on expected returns and cash flows. A separate study (Zaremba, 2016) describes the mechanism that governs how accurately investors can evaluate their success. According to the findings of Dyck and Pomorski (2016), the possibility of a large return on an investment is the primary motivator for investing in a particular business. Most of the company’s shareholders are focused on the company’s short-term profitability. Utilizing the investor protection strategy is vital for maximizing the return on investment and translating trading into profitable, productive activities. The significance of IP in protecting voting rights cannot be emphasized.
Market Knowledge (MK) and Emotional Finance (EF) can coexist with investors and influence their decision-making. Financial intelligence includes market knowledge, which includes trends, investment instruments, economic indicators, and other elements that affect investment decisions (Kahneman & Riepe, 1998). Investors use their market knowledge and understanding to make smart investment selections during the cognitive phase. Emotional Finance examines how emotions affect financial decisions. It shows that investors’ decisions can be influenced by their emotions, such as fear, greed, optimism, or regret (Loewenstein et al., 2001). Emotions can sometimes overrule reasoning and lead to judgments, not in the investor’s best interests. Emotions may only sometimes hurt financial decision-making. In uncertain situations with incomplete knowledge, intuition, and emotions can help investors make good decisions (Loewenstein et al., 2001). Overall, investors use both Market Knowledge and Emotional Finance. Both usually apply. Emotional Finance acknowledges that emotions affect decision-making, while MK provides the logical foundation. Behavioral Finance (Shefrin, 2002) encompasses this emotional-logical process. Figure 1 below shows the theoretical framework of the study.

Proposed model.
Theoretical Framework
Hypotheses
H1. Higher levels of Emotional Finance (Anxiety, Happiness, and Optimism) are positively associated with enhanced investment performance.
H2. Greater Market Knowledge is positively associated with improved investment performance.
H3. Stronger Investor Protection mechanisms are positively associated with better investment performance.
Methods
We employed the study of causal inquiry. The experiment was done in a setting that was not artificial in any way. The scales used in this investigation were developed from prior research. We disseminated the surveys to investors in real estate and the stock market. In Pakistan, there is only one stock exchange, the Pakistan stock exchange. Originally, it comprised the stock exchanges of Karachi, Lahore, and Islamabad. Coverage includes both the KSE 100 and KMI 30 indices. The Pakistan stock exchange company is a marketplace for trading bonds and stocks. With a total market value of 52 billion dollars, there are currently 0.25 million active investors. The real estate sector in Pakistan attracts millions of investors, making it one of the country’s most important industries. It is expanding in size, and both markets contain active players.
In designing the measurement of constructs, the questionnaires for emotional Finance, investor protection, market knowledge, and investment performance constructs were adapted from past research. The scale for emotional Finance was adapted from previously established literature (Aren & Hamamcı, 2019; A. Dumanli & Aren, 2019; D. Tuckett, 2009; D. Tuckett et al., 2014; D. Tuckett & Taffler, 2008; A. Tuckett et al., 2015). The scales of investor protection were adopted given the studies (Bebchuk & Neeman, 2010). The scale of market knowledge was adapted from previous studies (De Luca & Atuahene-Gima, 2007; Reed & DeFillippi, 1990; Szulanski, 1996; Zahra et al., 2000). At the same time, we used the scale of investment performance (Bain, 1996; Ferson, 2010; Le Sourd, 2007). We examined the reliability and validity of the scale using a pilot study. The emotional finance construct is a higher-order concept since it comprises three variables: investor optimism, anxiety, and happiness. All the dimensions were formative, making up the construct of emotional Finance. In our study, the construct of Emotional Finance and its associated dimensions have been theoretically derived rather than determined purely statistically. We draw on prior research and established theoretical foundations to identify the constituent dimensions of Emotional Finance. The choice of these dimensions as formative indicators of Emotional Finance is underpinned by the understanding that these dimensions collectively shape the construct of Emotional Finance rather than being reflections of it. Previous studies have proposed that emotions significantly impact financial decisions (Lerner et al., 2015). Each dimension we considered—such as anxiety, happiness, and optimism—contributes to the overall emotional state of an investor and thus impacts their financial decision-making process. Each of these dimensions, therefore, forms part of the construct of Emotional Finance. While we recognize that the use of formative constructs could be viewed as a limitation due to potential variations across different datasets, the theoretical underpinning of our approach lends credence to our methodology.
Higher-order constructs (HCM), also known as hierarchical component models within the context of PLS-SEM, enable construct modeling across multiple dimensions. These include more abstract elements, referred to as higher-order components, and their more specific subdimensions, the lower-order components. This approach allows for examining a general construct at a higher level of abstraction while simultaneously considering its concrete subcomponents. Thus, HCM provides a comprehensive view of important conceptual variables by addressing their specific characteristics (Sarstedt et al., 2019). There is either a reflecting or formative nature of the interaction between the higher-order component and its lower-order components (Jarvis et al., 2003; Wetzels et al., 2009). Four sorts of higher-order structures have been proposed for different study types: reflective-reflective, reflective-formative, formative-reflective, and formative-formative relationships are all possible (Becker et al., 2012). In our analysis, we initially conducted first-order testing to examine the factor loading, reliability, and validity of our first-order constructs, including dimensions such as happiness, anxiety, and optimism. These constructs are all reflective. However, our overarching construct of Emotional Finance, which these dimensions form, is formative. Therefore, our model is reflective-formative, with the formative Emotional Finance construct informed by the reflective first-order constructs. The first-order construct was initially evaluated in the model with the endogenous construct. Items H1, H2, H3, H4, H6, H7, and H9 of happiness; items A1, A3, A4, A8, and A9 of anxiety; items Q5, Q6 of optimism; and items IV1, IV5 of investment performance were dropped from the analysis since they did not meet the required threshold values of item loadings on their relevant constructs. After that, for causal relationship testing, we took higher order to construct emotional Finance composed of latent variables values of our first order constructs happiness, anxiety, and optimism. In that model, emotional Finance became formative, and the model became reflective. The final model also included investor protection and market knowledge as exogenous constructs. We dropped items M6 and M7 from market knowledge and items IP3, IP5, IP8, IP9, and IP10 of investor protection due to their not meeting the required threshold value for the quality criteria of the outer model. Researchers might choose from various techniques when attempting to identify a higher-order construct. The repeated indicators methodology and the two-stage strategy are notable examples of potential methods (Hult et al., 2018). To characterize and estimate higher-order constructs using PLS-SEM, various techniques have been offered by researchers. The (extended) repeated indicators and two-stage strategies stand out as the two most effective techniques (Ringle et al., 2012). Becker et al. (2012) conducted an extensive simulation study comparing the two techniques for identifying reflective-formative higher-order entities. According to their findings, utilizing an approach involving (extended) repeated indicators resulted in fewer biases in estimating the measurement model for higher-order structures (i.e., the relations between lower-and higher-order components). On the other hand, the two-stage approach demonstrates superior parameter recovery for paths in the path model that (1) leads from exogenous constructs to the higher-order construct and (2) leads from the higher-order construct to an endogenous construct. When working with significant sample sizes, the (extended) repeated indicators and two-stage approaches frequently yield highly comparable results.
There were 270 distributed questionnaires, 260 of which were filled out by respondents. The respondents included both real estate and stock investors. In Pakistoth real estate and stock markets move in the same direction with economic progress. The investor faces similar challenges and risks in the markets. The active investors were approached personally to get the questionnaire completed from them. The participants were eliminated from the study after our questionnaire review revealed poor responses. Considering this, the investigation utilized 250 responses. The data for this inquiry were acquired using a method known as sampling by convenience. After data collection, the data were subjected to descriptive and inferential analyses; we checked the variables’ descriptives and the respondents’ demographic pro in the descriptive analysis file. While in the inferential analysis, we utilized SEM procedures, which included evaluating measurement and structural models using Smart PLS v4 software.
In addition, the robustness of the output model was evaluated with the FIMIX-PLS test supported by Smartpls. This test aimed to find any potential heterogeneity in the data. The test could distinguish between separate segments and clusters, which served as the principal focus of the ensuing inquiry. The anticipated IP, EF, and MK values on the endogenous variable INP were multiplied by four for the quadratic effect test. Utilizing the SPSS tool, we were able to achieve this objective. We determined whether nonlinearity existed by employing Ramsey’s RESET test, which he invented in 1969. Recent research has emphasized the development of techniques and methods for endogeneity correction in analyses, as well as tests that can detect endogeneity (Hult et al., 2018; Reeb et al., 2012). It occurs when the exogenous variables are associated with the error term and the endogenous construct, leading to erroneous results (Bascle, 2008; Ebbes et al., 2021; Mortazavi, 2018). We employ the highly trustworthy Gaussian Copula approach to determine whether the data were produced endogenously (Park & Gupta, 2012).
Results and Discussions
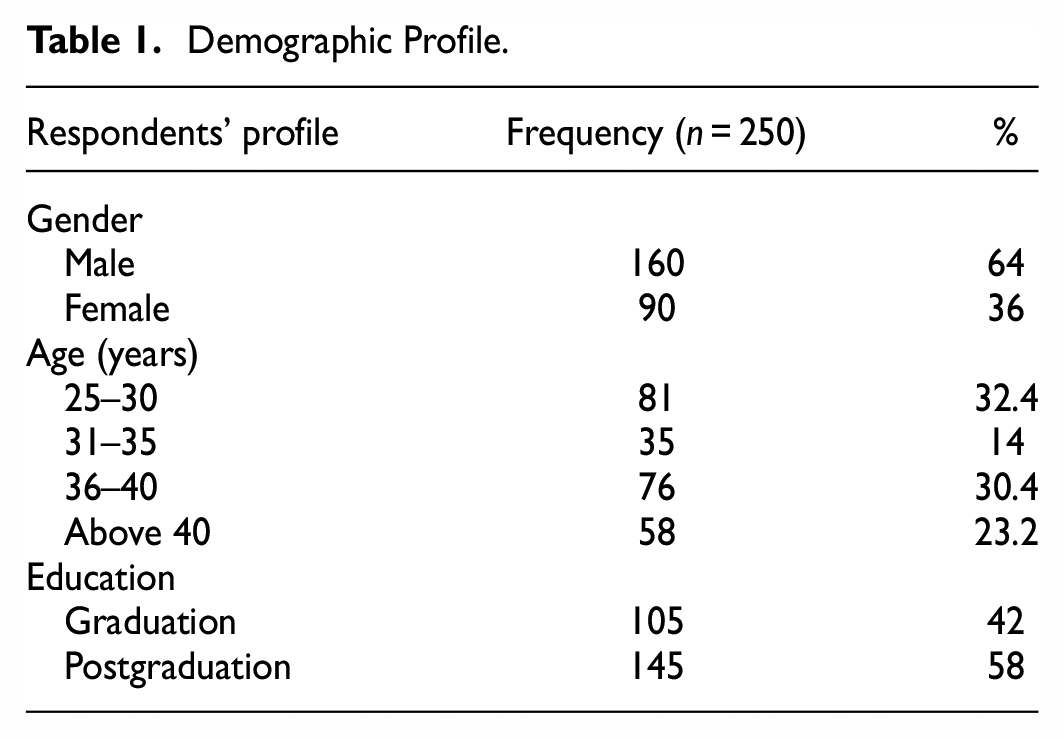
The demographic characteristics of the respondents are explored in Table 1. These demographic characteristics included the participants’ ages, degrees of education, and years of experience. There were 250 replies to the survey, 160 from men and 90 from women. Respondents included more men than women. Because in Pakistan, male dominance in professional fields is obvious. Females have less exposure to financial education due to various family restrictions and less support from society. Still, it was very good to outreach females for the data collection. The ages of respondents ranged from 25 to over 40 years, with the vast majority falling somewhere in the middle. The bulk of participants were between the ages of 25 and 30 years, with an additional 35 participants between 31 and 35. In addition to receiving responses from 145 postgraduate professionals, 105 graduated investors participated in the survey.
Demographic Profile.
Evaluation of the Outer Measurement Model
While assessing the outer conceptual model in structured equation modeling, the SMART Pls algorithm analyzes the measured constructs to ascertain the reliability, validity, and internal consistency of the data collected on those constructs (Ho, 2006). Figure 2 above shows the output model of the framework using SEM PLS modeling. The quality of having constant measuring elements across all the respondents is what is meant when discussing reliability. A score of more than 0.7 is deemed to be satisfactory and reflects the dependability of the scale (Sarstedt et al., 2021).

PLS-SEM showing the relationships in the inner model.
In Table 2, factor loadings indicate the correlations between the observed variables and their respective latent constructs. These include Anxiety (AN), Happiness (HP), Optimism (OP), Investor Protection (IP), Market Knowledge (MK), and Investment Performance (INP). The values suggest a satisfactory load exceeding the required threshold of 0.4, demonstrating strong relationships between the observed variables and their constructs. These constructs, therefore, are closely interrelated. The strong loadings underline the importance of each construct in explaining the variation in their respective indicators. As such, they do not exist in isolation but are interconnected components of the broader conceptual framework of our study. However, it is crucial to note that while these constructs are interconnected, each is distinct, meeting the exclusivity requirement. Additionally, all pertinent dimensions of the broader construct are captured within these constructs, fulfilling the completeness requirement. Therefore, while these constructs are closely related, each serves a unique role within the study’s overall framework.
Factor Loading.

Note. AN = anxiety; HP = happiness; OP = optimism; IP = Investor protection; MK = market Knowledge; INP = investment performance.
Table 3 aggregates the results of multiple collinear structures of the model. Table 3 provides a clearer picture of the lack of multicollinearity. It supports one of the fundamental assumptions upon which statistical inference is based. Since the numbers are less than 10, indicating no significant multicollinearity between the constructs, we can move to the next phase of the analysis.
Collinearity Statistics (Indicator Multicollinearity).

Scales Reliability Analysis
Kimberlin and Winterstein (2008) defines dependability as the reliability and stability of a measuring instrument. Repeatability is the cornerstone of reliability. Will the same outcomes be achieved if an intervention is repeated many times? Cronbach alpha and composite reliability (CR) are often used when calculating reliability. Table 4 shows the findings of both the Cronbach alpha and composite reliability measurements. Cronbach’s alpha ranged from .728 to .899, while composite reliability ranged from 0.847 to 964. The reliability statistics for these two metrics exceed the minimum needed threshold of 0.70 (Hair et al., 2011). As a result, construct dependability has been established.
Measurement Model.
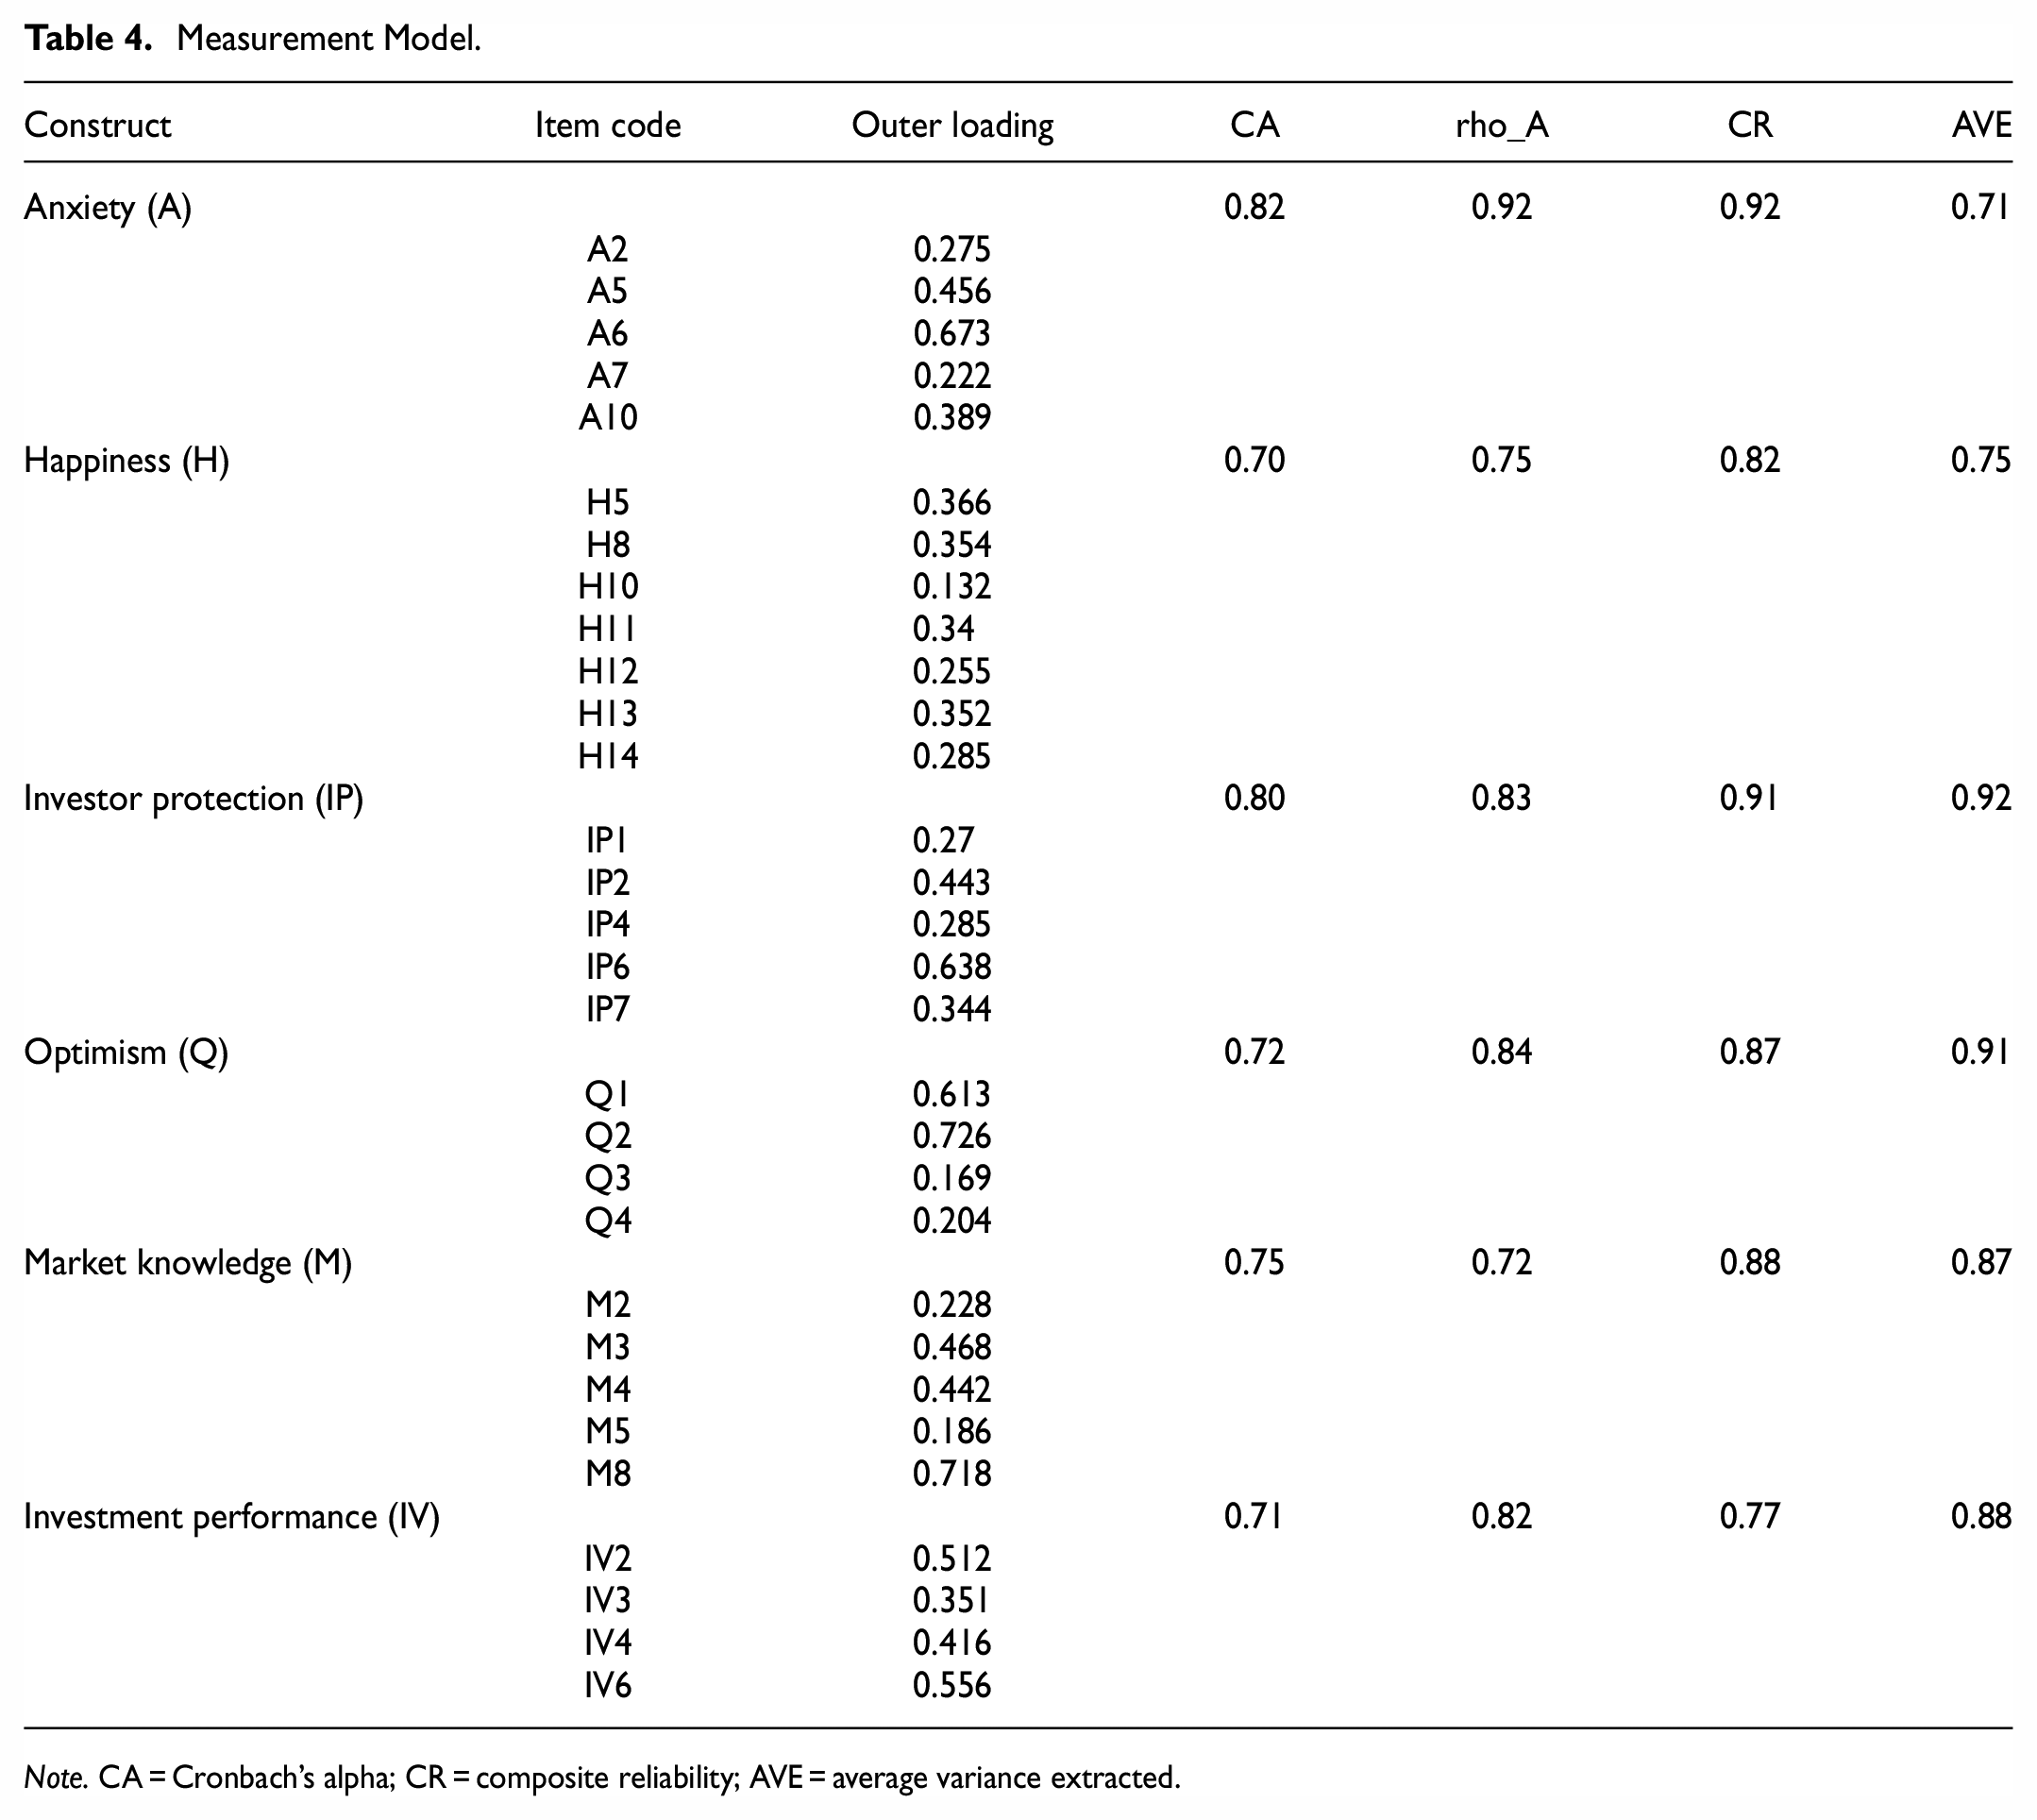
Note. CA = Cronbach’s alpha; CR = composite reliability; AVE = average variance extracted.
Cronbach’s alpha is a statistic that gages the dependability of an instrument. Its values vary from 0 to 1. Table 4 shows alpha values for several scales; remember that a higher value denotes greater reliability. Since the figures exceed 0.7, we can assume that the instruments used were accurate. There was a rigorous evaluation of the underlying constructs. AVE measurements evaluate whether a construct exhibits convergent or divergent validity. In this instance, the AVEs are greater than 0.5, indicating the establishment of convergent validity. Raykov (1997) developed rho value, also known as reliability rho and composite reliability, runs between 0 and 1, like Cronbach’s alpha. The greater its value, the more trustworthy the item scale. A rho number greater than 0.8 shows high internal consistency, whereas 0.7 marks the bottom limit of adequacy (Cicchetti, 1994). Because each instrument’s result in Table 4 was greater than 0.7, it may be assumed that its overall dependability has been assessed. All the tools employed in this study were useful for gathering information from the participants based on their basic components. Both the technique used and the data collected are suitable for further investigation.
Scales Validity
Convergent Validity
When we speak of convergent validity, we refer to the degree to which distinct methods of evaluating the same concept yield comparable results. If two or more measurements of the same thing are acceptable measures of the concept, then there should be a substantial degree of variance between them. Items will converge to measure the underlying idea, and convergent validity will be established when the AVE value is greater than or equal to 0.50.(Fornell & Larcker, 1981). The results of the current study’s convergent validity analysis, which is based on AVE statistics, indicate that all constructs have an AVE value greater than 0.50. Consequently, convergent validity has been established. Table 4 displays the values of the AVE for each of the constants.
Discriminant Validity
Discriminant validity is the degree to which different measures of distinct concepts may be discriminated from one another. If two or more concepts are unique, their respective valid measurements should not correlate excessively. One of the most used approaches for establishing the discriminant validity of measurement models is the Fornell-Larcker criterion. This criterion is widely accepted as one of the most utilized criteria. To meet this criterion, the square root of a construct’s average variance must be greater than the correlation between the construct in issue and any other construct. This requirement is only met if the construct is unrelated to any other construct. This prerequisite must be met for the condition to be satisfied. Once this criterion has been met, the discriminant validity of the examination can be considered established. The degree to which the instruments meet the Fornell-Larcker criterion is one of the factors evaluated when evaluating an instrument’s ability to differentiate between different sorts of people or groups. The square root of a construct’s average variance was shown to be more important in this investigation than its connection with other constructs (Table 5). This lends weight to the notion of establishing discriminant validity. Fornell-Larcker diagonal values larger than 0.70 indicate that the Fornell and Larcker requirements have been met and discriminant validity has been achieved. These findings prove that the algorithm is correct. This supports the argument that the scale can precisely measure the concept.
Fornell Larcker Criteria Discriminant Validity (Latent Variable Correlation and Square Root of AVE).

Note. AN = anxiety; HP = happiness; INP = investment performance; IP = investor protection; MK = market knowledge; OP = optimism.
The Heterotrait-Monotrait Ratio, commonly known as HTMT, can be used to comprehend the multicollinearity between the latent components. The core of the HTMT’s technique is estimating the correlation between the constructs. Based on the HTMT ratio, the discriminant validity of a test is determined. Kline (2023) suggested an HTMT threshold of 0.85 or less. However, Teo et al. (2007) suggest a more lenient HTMT threshold of 0.90 or less. In the existing body of research, the threshold for HTMT has been disputed.
To eliminate multicollinearity, it is required to analyze the discriminant validity of every study employing latent variables. The occurrence of multicollinearity leads to the emergence of complications. Comparing the correlations between Monotrait and heterotrait using the ratio is an innovative way of testing whether a discriminant model is accurate in PLS-SEM (HTMT). Without evidence of discriminant validity, researchers cannot tell if the data demonstrating structural channels are genuine or the consequence of statistical errors. This precludes them from determining whether structural channels exist or not. As a direct result, their capacity to generate relevant study results could be improved. The scientific community needs help determining which of the several hypotheses provides the most accurate explanation of the observed phenomena. It is possible to validate the discriminatory capacity of a test by employing the Fornell-Larcker criterion in conjunction with (partial) cross-loadings. This method is suggested. Rarely is discrimination-related validity established using these techniques.
In contrast, the HTMT criterion is significantly more effective than other, more standard approaches for showing the discriminant validity of a test. Given that HTMT prefers ratios of 0.9, it should not be surprising that all other structures chose these ratios; in fact, it should not be surprising at all (Henseler et al., 2015). According to the results of the HTMT, which are provided in Table 6, the HTMT ratio is below the required level of 0.90.
Heterotrait-Monotrait Ratio (HTMT).

Note. AN = anxiety; HP = happiness; INP = investment performance; IP = investor protection; MK = market knowledge; OP = optimism.
In assessing discriminant validity, we identified which indicators exhibited high loadings on their respective constructs and their correlations with other constructs. This was done by examining a broad spectrum of indicators across all constructs. To ascertain discriminant validity at the indicator level, it is necessary to find a strong correlation between indicators and their respective constructs while simultaneously observing weak correlations between indicators and different constructs. While this approach is straightforward, it is worth noting that it lacks theoretical support and empirical validation (Henseler et al., 2015). Table 7 highlights the cross-loadings for the corresponding constructs in italics. The cross-loadings for other constructs are significantly low, indicating good discriminant validity.
Cross Loadings for Discriminant Validity.

Note. AN = anxiety; HP = happiness; INP = investment performance; IP = investor protection; MK = market knowledge; OP = optimism.
Validating Higher Order Construct (HOC) Emotional Finance (Reflective-Formative)
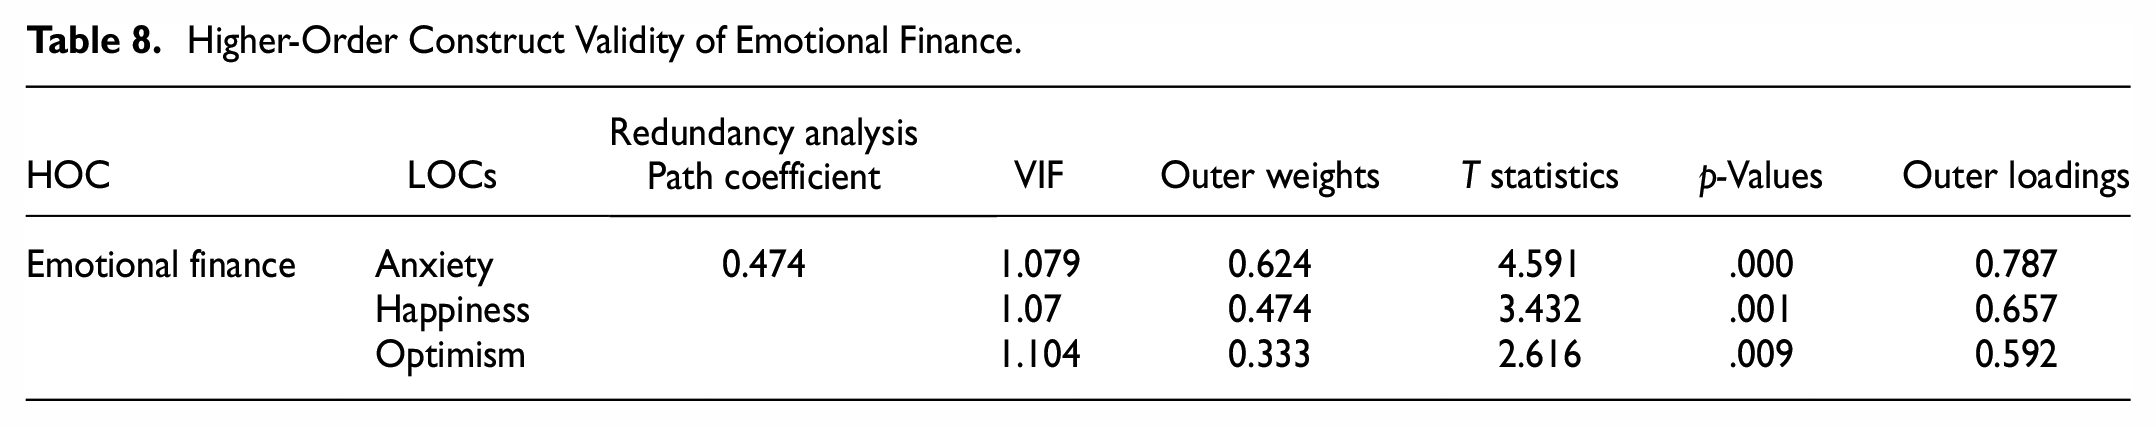
Our method for determining the validity of our emotional-financial variables was different because they were higher-order formative constructs. It is necessary to demonstrate the convergence validity of higher-order formative structures. Additionally, the examination of the measuring model validates these overall concepts. Each of these elements reliability and convergence validity was evaluated. Furthermore, as advised by Sarstedt and Cheah (2019), we assessed the discriminant validity of the higher-order components in relation to the other lower-order components in the study. In addition, the idea of Emotional Finance is evaluated using redundancy analysis as a higher-order reflective design construct. In a formative evaluation methodology, convergent validity refers to how closely a formatively created construct corresponds with one or more reflexively measured surrogate variables of the same concept. The approach is known as redundancy analysis. Before the researchers can conduct this procedure of determining convergent validity, they must plan the research design. To determine convergent validity, researchers planned to include an alternate measure of the formatively measured concept in their questionnaire during the research design stage. According to Diamantopoulos et al. (2012), an alternative measure is a single global item that encapsulates the essence of the construct under consideration (2018). According to Hair et al. (2010), the construct should correlate with the reflectively rated item(s) of 0.708 or higher, accounting for (at least) 58% of the variation in the alternative measure. This analysis yields a path coefficient of 0.800 for the emotional finance construct, above the recommended threshold of 0.708.
A collinearity assessment comes next. Check the formation model for issues with collinearity. The cost of the Variance Inflation Factor (VIF) is examined. The degree of collinearity increases with VIF cost. A collinearity issue is evident when the VIF score is 5 or above (Hair et al., 2021). Because the VIF values of the structural EF constructs were lower than the recommended cost of five, collinearity was no longer a risk in the gift research. Then, (Matthews et al., 2016) recommendations, outer weights’ statistical significance, and relevance were assessed. Applying external loadings allowed us to build the higher-order formative construct of emotional Finance. The outer loadings were found to be substantial for each of the higher-order indicators of the formative emotional finance construct and above the acceptable threshold fee of 0.50 as recommended by Sarstedt and Cheah (2019). The HOC validity was validated because all requirements were satisfied, as in Table 8.
Higher-Order Construct Validity of Emotional Finance.
Structural Model
The route coefficient of the inner structural model is displayed in Table 9. All hypotheses, including H1, H2, and H3, have been accepted. The findings demonstrate a considerable favorable impact of emotional Finance, a higher-order concept, on investment performance. It has been demonstrated that decisions taken under various emotional states and with different expectations lead to better investing outcomes. While investor protection also served as a reliable predictor of investing success. Government or stock market protection initiatives are unrelated to the performance of investments. The performance of investments is positively correlated with market expertise. A greater investor’s understanding of the real estate and stock markets results in more lucrative investments. They can choose wisely and benefit more from their efforts by doing so.
Path Coefficients.

Note. EF = emotional finance; INP = investment performance; IP = investor protection; MK = market knowledge.
Table 10 shows that exogenous constructs in our model explained 25.9% of endogenous construct investment performance variability. It is higher than the mandatory threshold figure of 20%. To help investors make decisions, the model described enough variation. Investors will be 25% confident in the success of their investments if they have market information and base their decisions on their feelings of worry, happiness, and optimism. These findings represent a significant breakthrough in understanding the role of emotions in investment decision-making. The implications of this study can benefit investors in both stock and real estate markets.
R Squared and Adjusted R Squared Values.

Table 11 provides model fit indices, while Table 12 presents the F square values. Regarding Table 11, the indices for the estimated model are identical to those of the saturated model, indicating that the estimated model fits the data well. However, the NFI (Normed Fit Index) appears negative, which is unusual and may require further investigation. Moving to Table 12, the F square values indicate the effect sizes of the paths in the model. (Cohen, 1992) has suggested guidelines for interpreting effect sizes, with f2 values of 0.02 or higher considered small, 0.15 or higher considered medium, and 0.35 or higher considered large. In this case, the model produces small effect sizes based on the F square values presented in Table 12.
Model Fit Indices.

F Square.
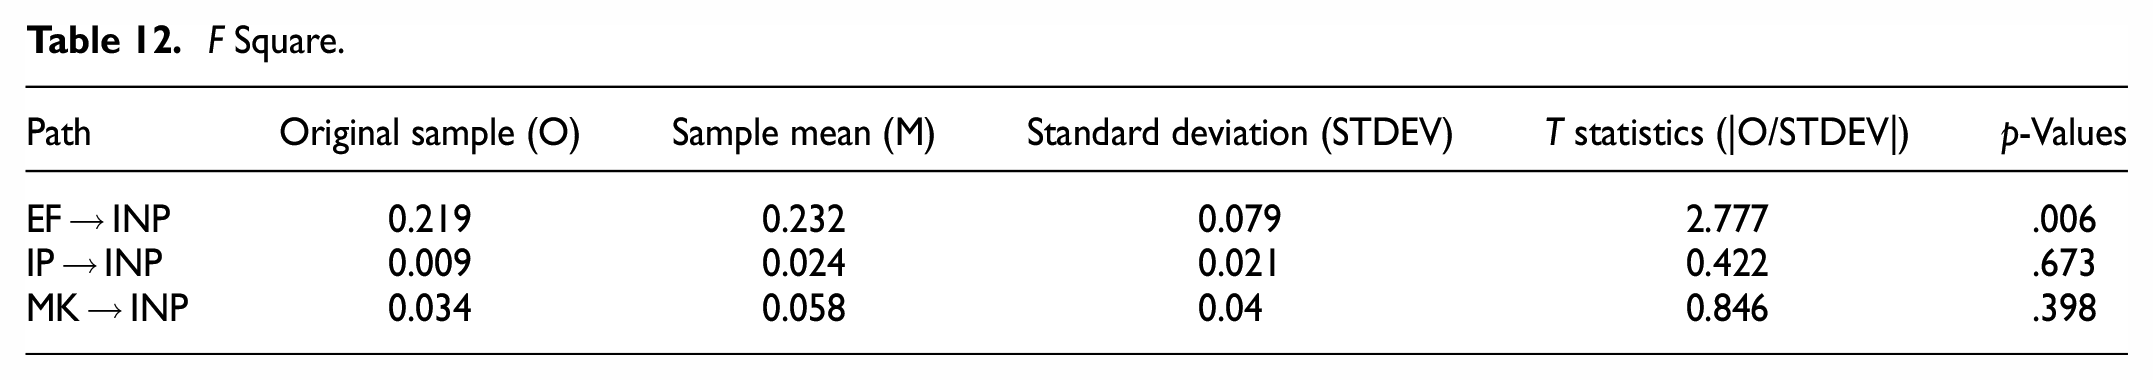
The small effect sizes could be attributed to various factors, which may require further examination. It is important to explore the specific context and factors influencing the model’s effect sizes to understand the findings comprehensively. Overall, the model fit indices suggest a good fit, while the effect sizes indicate small effect sizes according to Cohen’s guidelines. Further investigation and consideration of additional factors are necessary to gain a deeper understanding of these results.
The predictive relevance, commonly known as Q2, is a statistic that analyses and forecasts the model’s ability to avoid scenarios; an optimal value is greater than zero (Hair et al., 2019; Henseler, 2018). Performing the PLS-SEM algorithm permits the calculation of the value. Table 13 displays the predictive significance of the model, and the fact that it is positive rather than negative indicates that the model does have some predictive significance.
Predictive Relevance.

Structural Model Robustness Checks
To account for the data’s unobserved heterogeneity, the FIMIX-PLS approach was devised and then expanded (Hahn et al., 2002; Sarstedt et al., 2011). The later researcher has made numerous enhancements (Sarstedt, 2008). The values of the fit indices provide a trustworthy indicator of the number of segments and the amount of unobserved heterogeneity in the data. The AIC incorrectly assumes an overestimation and has a worse form than the MDL, which incorrectly assumes an underestimation. If the minimum values for AIC3 and CAIC are found in the same cluster, then we have no alternative but to select this number of clusters. Similarly, that number of clusters is selected if the least value appears in the AIC4 and the BIC. The entropy criteria should be greater than 0.5 (Hair et al., 2014). NEC provides a precise classification of the number of data segments that should be omitted (Ramaswamy et al., 1993). According to the FIMIX-PLS standards, Table 14 illustrates that the entropy indicates an alternative solution for several segments. Evidence needs to meet the research’s defined requirements. As a result, we have determined that the sample is homogeneous and that the data lack significant heterogeneity.
Fit Indices for One to Five Segments of FIMIX.

The p-values of squares for all exogenous components are greater than the threshold value of .05, as shown in Table 15. Using the SPSS 21 software, we squared the expected values to obtain the square values generated by applying the expected values. This indicates that the data contain no indicators of nonlinearity. Similarly, the Ramsey RESET test results reveal the values (F(6,240) = 2.030, p = .056), indicating that the model is dependable.
Nonlinearity Assessment.

Table 16 displays the outcomes of employing the Gaussian copula approach. We created copulas for each external term we could conceive (i.e., EF, MK. IP). In this table, “c” represents coefficients for endogenous variables (EFc, MKc, IPc) in Gaussian copula models. Coefficients indicate relationships between endogenous variables and their respective higher-order constructs. All p-values are greater than 0.05, suggesting the absence of statistical significance, in line with Hult et al. (2018), indicating credible model performance. None of the copulas are statistically significant, according to the data shown in Table 13 (p-values greater than .05). Every pair has a p-value greater than .05, including EF (p-value = .273), MK (p-value = .176), INP (p-value = .092), etc. As stated by Hult et al. (2018), the conclusion that can be reached is that the data lack endogeneity and that the performance of the structural model is credible.
Endogeneity Test Assessment Using Gaussian Copula.

Conclusion
Both the stock and real estate markets pose significant challenges for investors. However, it is important to clarify that the level of information available in the markets influences their efficiency rather than vice versa. In the case of Pakistani investors, their susceptibility to being influenced by emotions can contribute to lower market efficiency. As a result, there may be a limited amount of accurate and reliable information accessible to investors for making well-informed investment decisions. This study, in the field of Finance, examined and evaluated the strategy known as emotional Finance. Currently, research is undertaken on three dimensions of emotional Finance: optimism, happiness, and anxiety. The impact of emotional Finance on investment performance has been significant. Due to emotional decisions and uneven market knowledge, investors cannot make appropriate decisions.
Fluctuations in global indexes and share prices of risky comp are influenced by various factors, including fear and expectation. These fluctuations may occur frequently, ranging from optimism to pessimism. However, it is important to note that making a definitive statement about the impact on the life of a prudent capitalist as being “more comfortable” would require more extensive analysis and evidence.
In this context, understanding the irrational urges of capitalists is important than it has ever been. The relatively new field of EF, which first came into regular contact in the 1980s, examines the influence of psychological aspects on financial decisions. In the face of uncertainty, investors take in unique information, make decisions based on that knowledge, and then study findings imply that examining it is essential to examine one’s emotions before is essentially making financial decisions. Additionally, understanding the real estate and stock markets is a stronger indication of investment success. We are obligated to ensure that investors reap the benefits of market efficiencies. It is possible to expand the scope of the study to evaluate additional INP-related behavioral traits. The study has larger implications for authorities to consider when advising investors. Investment managers can enhance their performance by gaining a deeper understanding of the market, minimizing their risk exposure, and effectively managing their emotions. Emotional control is essential in making rational and informed investment decisions. While acknowledging the role of emotions in investment performance, it is recommended that investment managers strive to strike a balance by being aware of their emotions and utilizing emotional intelligence to make sound decisions rather than solely relying on heightened emotions. It establishes guidelines for policymakers to follow to build a new market mechanism that would provide investors with accurate and timely information so that they can make decisions based on accurate and timely information.
Footnotes
Author Contributions
Muhammad Irfan (Corresponding author): Conceptualization, Supervision, Visualization, Validation. Raima Adeel: Writing, Writing- Original draft preparation, Methodology, Investigation, Software. Muhammad Shaukat Malik: Data curation, Software.
Declaration of Conflicting Interests
The author(s) declared no potential conflicts of interest with respect to the research, authorship, and/or publication of this article.
Funding
The author(s) received no financial support for the research, authorship, and/or publication of this article.