
Abstract
The study is aimed to investigate the impact of investor sentiment on returns of selected emerging equity markets i.e., Brazil, India, China, Russia, Indonesia, and Pakistan using non-linear predictive regression analysis. Principal Component Analysis is used to generate investor sentiment index. Investor sentiment has a significant impact on current market returns and this influence is continued in the short run in most of the sample countries. However, the impact of sentiment is not much pronounced in the longer run. Therefore, decision-makers cannot ignore sentiments in at least the short run. The findings of this study may be helpful for investors to better understand the market trends under the influence of sentiments and portfolio managers and risk professionals can devise their strategies accordingly.
JEL: G02, G15, G24, M41
Introduction
Traditional finance theories proposed by great scholars (Black, 1972; Black & Scholes, 1974; Lintner, 1965; Markowitz, 1952, 1959; Miller & Modigliani, 1961; Sharpe, 1964) are based on the assumptions that (a) investors are always rational (b) information is equally available to all investors and (c) prices remain fair in the markets. The proponents of these assumptions claim that they provide a simple and understandable explanation of the market phenomena and are applicable in different market conditions, but these theories have failed to give a valid explanation of observed fluctuations in the market asset prices in diverse economic states.
To explain the phenomena, the scholars tried to obtain support from human psychology and as a result a new financial paradigm, called behavioral finance, emerged in finance. Behavioral finance assumes that (a) all investors are not always rational, (b) information is not equally available to all investors and (c) the asset prices do not remain fair in the financial market.
The animal spirit theory of Keynes (1936) and the prospect theory of Kahneman and Tversky (1979) explain the way sentiment drives demand and supply. Investor sentiment means the mind-set of investors in a particular stock market. Investor sentiment steers supply and demand in the financial market and is thus responsible for changes in the prices of financial assets. Investors in the market decide their entry and exit the market keeping in view the market sentiment indicators and trading strategies to optimize their returns. In the stock market, quick action in response to the attitudes of investors is crucial in maximizing returns. The optimism or pessimism of the investors also manifests in the price trends.
Kahneman and Tversky (1979) Discuss various forms of investor irrationality and concludes that investors’ cognitive and emotional biases play a vibrant role in determining the behavior of the investors which results in biased investing decisions. This type of cognitive and emotional disparities are more commonly observed in investors who are under the control of their instinct and their behavior is directed by their sentiments (Keynes, 1936). The existing market sentiment does not remain persistent for long periods as it reverts after a certain level and this fact called “trade in tandem” is used in predicting the market in long run.
Behavioral asset pricing theory is examined by using various models but Shefrin (2010) points out that there is no consistency, uniformity, or coherence in models that attempt to explain this phenomenon. Despite serious criticism, behavioral finance theory is acknowledged as descriptive of the normal stock market behavior of investors and provides a cogent explanation of the unexpected market price behavior observed in the equity markets. According to Zhang (2008), the unexpected fluctuations in market pricing are either due to the right use of incorrect information or due to the inaccurate use of correct information by the investors. These two possibilities are considered responsible for the initiation of specious beliefs in the minds of irrational investors and such beliefs may be termed “investor sentiment.”
In behavioral finance, it is presumed that investor sentiment can be used as a predictor of stock market returns, so consideration of sentiments in the prediction of stock market returns has remained the focus of debate for a long. Dash (2016) put forth that if there is a co-movement and consistency between investor buying and selling behavior and market direction then it can be used to predict the market by knowing the behavior of investors.
Many studies have investigated the forecasting power of investor sentiment using different proxies, methodologies, and frequencies of data in various markets. There is a considerable body of knowledge that argues that investor sentiment is not a significant predictor of returns (Baker & Wurgler, 2006, 2007; Brown & Cliff, 2004, 2005; Kadilli, 2015; S. H. Kim & Kim, 2014) but on the other hand, many studies find sentiment as a powerful predictor of market returns (Baker et al., 2012; Ho & Hung, 2013).
There is a vast body of literature that stresses the link between investor sentiment and market returns in a temporal context, some find investor sentiment as a significant predictor of stock market returns in the short term (Mingzhao & Yumei, 2009), some find that it is significant in the long term (Liston-Perez et al., 2018). On the other side, Brown and Cliff (2004, 2005) and Yelamanchili (2019) find investor sentiment as an insignificant predictor of stock market returns in the short term while Kling and Gao (2008) find investor sentiments as an insignificant factor even in the long term. Similarly, diverse results are observed when the direction of the relationship between investor sentiment and its predictive power is studied. Huang et al. (2014) observe a negative relationship in the short term whereas Cheema et al. (2020) report a positive link in the short term. Ruan et al. (2020) report a negative link in the long term whereas Brown and Cliff (2004, 2005) find a positive impact in long term.
The controversy observed in the results is attributed to the non-linearity inherent in data (Bekiros et al., 2016), measurement method (Huang et al., 2015b), statistical techniques (Balcilar et al., 2018), structural properties of data (Agarwal & Vats, 2021) and difference in market cultures (W. Wang et al., 2021). Nishiyama et al. (2011) are the first to notice the existence of non-linearity between two variables. Bekiros et al. (2016) using
Literature Review
Brown and Cliff (2004) study the relationship between investor sentiment and market returns for a short-term period and find no predictive power of investor sentiment in explaining asset returns. In many studies, it is found that investor sentiment is not a good predictor for stock returns in the short term (Brown & Cliff, 2004, 2005; Yelamanchili, 2019) as well as in the long term (Kling & Gao, 2008). In terms of direction, the relationship between investor sentiment and subsequent market returns is negative (Da et al., 2019; Huang et al., 2014) as well as positive (Cheema et al., 2020; Kling & Gao, 2008; Ni et al., 2015; Ruan et al., 2020) for the short term. Likewise, this relationship is negative (Baker & Stein, 2004; Baker et al., 2012; Brown & Cliff, 2004, 2005; Huang et al., 2014; Liu et al., 2020; Ni et al., 2015; Ruan et al., 2020) as well as positive (Fang et al., 2018) in the long term. Boyer and Zheng (2009) studies net purchases and stock returns for a long period of 52 years in the US market and find that investor flows are a poor predictor of market returns.
In a global study carried out over a period of 25 years, Baker et al. (2012) observe that global sentiments are a significant predictor for market return for the subsequent 12 months. Ho and Hung (2013) in a cross-country study observe that investor sentiment is a predictor of excess market returns in the US, and no relationship is seen in the European markets. The study further identifies a negative correlation between investor sentiment and market returns in Italy and France. Another study by W. Wang et al. (2021) examines the role of investor sentiment in explaining stock returns in a global context considering the emerging and developed markets and finds that global stock market returns are negatively influenced by investor sentiment during subsequent 2 to 12 months, however, the impact is more pronounced in developing markets in comparison to developed markets. It becomes evident from an international study that investor sentiment is an important indicator in the equity markets and that equity returns can best be forecasted when negative returns are also considered (Papapostolou et al., 2016).
Baker and Wurgler (2006, 2007) introduces a sentiment-based investor index (
Huang et al. (2015a) also develop a new sentiment Index (
The inconsistency in results may be credited to the innate intelligence, education, professional growth, and emotional stability of the investors, the proportion of rational and irrational investors in the market, cultural built-up, integrity, institutional status, calamities, and information/noises in the stock market.
Methodology
The objective of the study is to examine the power of investor sentiment in predicting stock market returns in the linear and non-linear settings in Brazil, Russia, India, China, Indonesia, and Pakistan over short and long horizons. The data regarding daily share prices, trading volume, and shares outstanding are collected from the respective market for the period 1st January 2001 to 31st December 2020. Emerging markets are selected in the sample because these are supposed to be more prone to investor sentiment as compared to developed markets. The macroeconomic data is taken from International Monetary Financial Statistics.
Daily prices of the stock index are converted into returns by using the formula:

Where
Two proxies (a) Trading Volume (as used by Baker & Stein, 2004; Banchit et al., 2020) and (b) Turnover Ratio (as used by Baker & Wurgler, 2006) are used to quantify the investor sentiment index by using the PCA approach of Baker and Wurgler (2006, 2007) by using the equations:
To construct an investor sentiment index at the country level:

Where
To construct an investor sentiment index at the group level the following equation is used:

Where
The impact of investor sentiment on Contemporaneous market returns under the assumption of linearity and non-linearity at the cross-sectional and aggregate levels is calculated by using the equations:
At the country level:
Where
At the group level:
Where
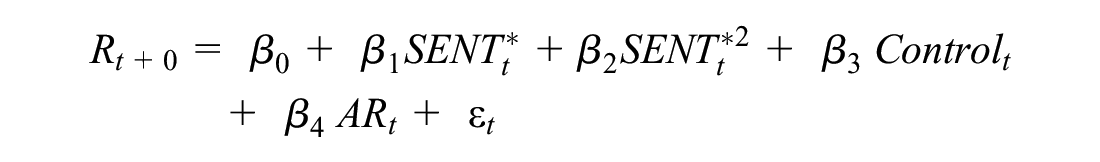
The predictive power of investor sentiment to predict future stock market returns under the assumption of non-linearity in the short and long term at the country and group level is examined by using the models:
A predictive model for country level:

Where
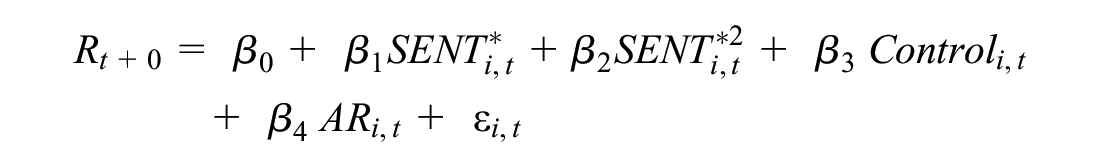
A predictive model for group level:

Where
Results and Discussion
The study first employs linear and non-linear predictive regressive models at the country level and then dynamic panel data analysis at the group level to investigate the impact of investor sentiment on same-day returns. Then the study uses the same models to examine the impact of sentiments on equity returns in subsequent periods. If autocorrelation is observed in a time series, auto-regressive models in linear settings and nonlinear settings are used.
In Table 1, RTP is market index returns, SENTIM is sentiment index, TS is term spread, TB is Risk-free rate, and IPI is Industrial Production Index. The average equity returns are positive for all of the sample countries. The average returns in the Russian market are the lowest (0.039), while the average return is the highest (0.07) in the Pakistani equity market. Russia displays the largest standard deviation indicative of more variability (2.036), while Pakistan displays the lowest value suggesting the lowest variability (0.007). Returns are negatively skewed suggesting the presence of a left tail. All of the kurtosis values of returns are larger than three indicative of the data being peaked and fat-tailed.
Descriptive Statistics.

Note. Table reports the descriptive statistics of the variable studied that is, equity returns, sentiment, T-bills, Term Spread, and Industrial Production Index for country and group level.
As regards the investor sentiment index, the average values are positive for all the sample countries except Russia and Pakistan that suggests in the majority of the selected countries investors exhibit positive investor sentiment. The standard deviation for the investor sentiment index is lowest (1.3310) in Pakistan and highest (1.395) in India. The investor sentiment index is positively skewed for all sample countries which is indicative of a peaked tail. The value of kurtosis is more than three but not too high. The high degree of kurtosis of the sentiment index displays non-normality in the data.
The mean values of T-bills are positive. The standard deviation of T-Bills is highest (5.194) in Brazil and lowest (1.226) in India. T-Bills is negatively skewed only for Pakistan while positively skewed for all others and kurtosis is almost three indicating non-normality. The average values of the Industrial Production Index are also positive for all the countries. The values of standard deviation range from (22.240 to 5.332) for all the countries showing more variability in the series.
The average values of Term Spread are positive for Russia, Indonesia, India, China, and Panel while negative for Brazil and Pakistan. The standard deviation of Term Spread is highest (3.652) in Brazil and lowest (0.033) in Pakistan. Term Spread is negatively skewed for Brazil, Russia, and Panel while positively skewed for all others. Kurtosis is too high in a few cases indicating high fat-tailed.
The investor sentiments have a significant positive impact on same-day returns of equity markets of Brazil, Russia, Indonesia, China, and Pakistan. The impact is linear in India and non-linear in nature in other markets. The negative sign of the quadratic term underscores the convexity of the relationship. The negative influence is observed by Brown and Cliff (2004) suggesting misprices in the equity market correct at a further higher level. Investor sentiments have a significant negative impact on the returns of equity markets in India. The impact is only linear in this market and highlights that rising sentiments result in a reduction in returns. It is further evident from Table 2 that at the panel data level, investor sentiment has a significant positive impact on contemporaneous market returns in a linear fashion. The positive influence is supported by the studies of Changsheng and Yongfeng (2012) and Lux (2011) indicating that a higher level of investor sentiments leads to a higher level of returns. The nonlinear term is found insignificant in India and group level and lines up with the study of Bekiros et al. (2016).
Impact of Investor Sentiment on Contemporaneous Market Returns.

Note. Table reports the impact of investor sentiments and macroeconomic variables on contemporaneous returns of the sample equity market. SENTIM = sentiment index; TS = term spread; TB = Treasury bill rate; IPI = Industrial Production Index; AR = Auto Regressive term. * is significant at 1%. ** is significant at 5% and *** denotes significance at 10%.
Table 3 reveals that investor sentiment predicts the market returns after 1 day and 5 days in Brazil. This relationship is negative and nonlinear. At a longer time frame, the link is significant and positive at 60 and 240 days. This indicates that the market observes a reduction in return with an increase in sentiments exhibited through volume which may be selling pressure in this case but it reverses subsequently. The relationship is nonlinear on days 1, 5, 40, and 60. This reversal implies that deviation in the prices from their fundamental value observed in short term is converged toward its fundament value in the long term both in the linear and nonlinear term. The negative link is aligned with the study of Da et al. (2019) and positive with the results of Cheema et al. (2020) in the short run and linear settings. Whereas, in the long run, and non-linear settings, the positive link is aligned with Fang et al. (2018), and the negative link is aligned with the study of Baker et al. (2012).
Investor Sentiment and Market Returns at Different Time Horizons.
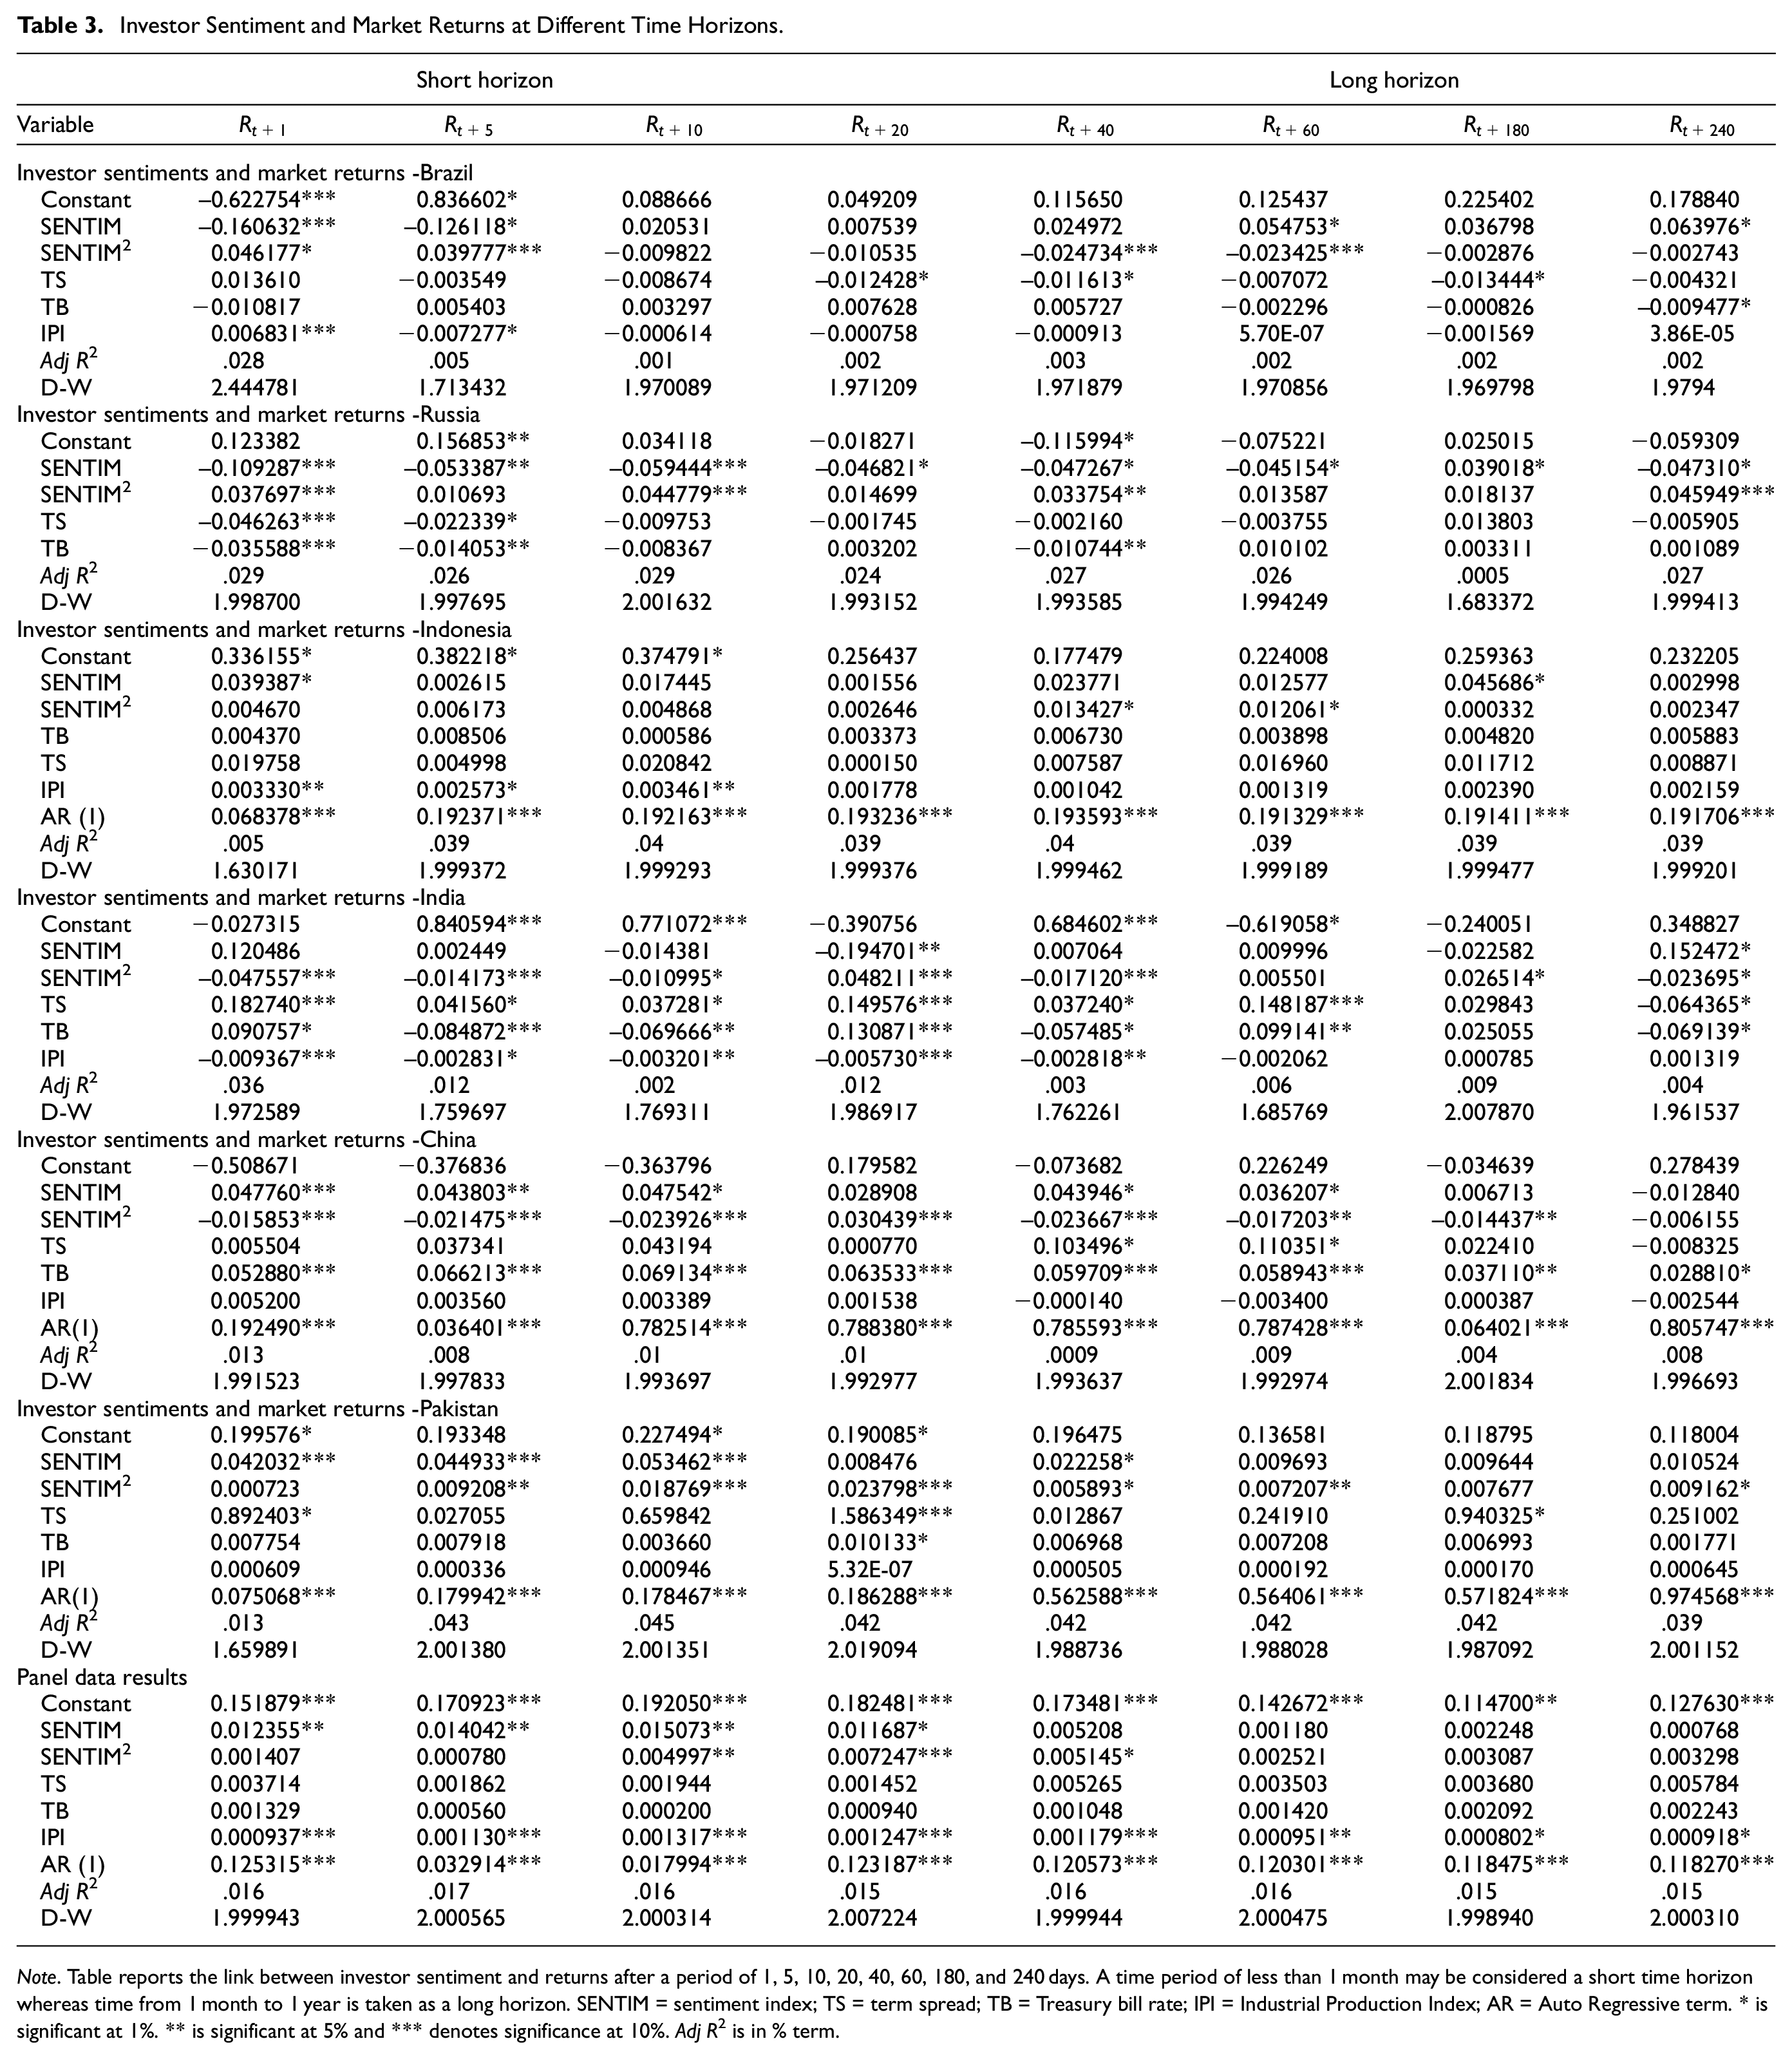
Note. Table reports the link between investor sentiment and returns after a period of 1, 5, 10, 20, 40, 60, 180, and 240 days. A time period of less than 1 month may be considered a short time horizon whereas time from 1 month to 1 year is taken as a long horizon. SENTIM = sentiment index; TS = term spread; TB = Treasury bill rate; IPI = Industrial Production Index; AR = Auto Regressive term. * is significant at 1%. ** is significant at 5% and *** denotes significance at 10%. Adj R2 is in % term.
A similar pattern is observed in the Russian equity market and sentiment influence returns negatively after 1, 5, 10, 20, 40, 60, 180, and 240 days. In the short run same results are observed by Huang et al. (2014) and in long run by Baker et al. (2012). The nonlinear term is significantly and positively influencing returns after 1, 5, 10, and 40 days. This indicates the convexity of the link between sentiments and market returns. The results are by the study of Cheema et al. (2020). The influence of sentiments is not much pronounced in the Indonesian equity market. In Indonesia, investor sentiment predicts market returns for the next day only in a linear fashion and returns after 180 days in a nonlinear way. Investor sentiment is observed to be a poor predictor in the short term (Yelamanchili, 2019) as well as in the long term (Kling & Gao, 2008).
In the Chinese market, higher investor sentiments result in higher returns on subsequent days that is, days 1, 5, 10, 40, and 60. This relationship is convex and nonlinear in nature concerning subsequent returns. It means returns increase at decreasing rate with sentiments. The positive link is aligned with the study of Ruan et al. (2020). The nonlinear significant link between investor sentiments and the subsequent market return is also observed in the Indian market. Positive results are observed in the study of Kling and Gao (2008) and negative in the study of Ma et al. (2021). The Pakistani market exhibits a significant positive nonlinear link between investor sentiments and subsequent equity returns in the short run and this relation is also non-linear in nature. The interesting feature is that returns increase at an increasing rate in general.
The dynamic panel data analysis exhibits a linear relationship between investor sentiments and subsequent market returns after days 1 and 5. The relationship is nonlinear for returns after 10, 20, and 60 days. These results are consistent with (Ruan et al., 2020) and (Fang et al., 2018) in the short run and long run respectively. The interest rates and term spread have no impact on returns in sample countries as a group. Industrial production has a positive link with market returns which is in line with the argument that an increase in growth rate is priced by the market and results in higher returns.
It is worth mentioning that interest rate generally has an insignificant impact on the market returns of Brazil, Russia, Indonesia, and Pakistan at several time frames. However, a significant impact is observed on the returns of India and China. The diverse signs may be the different economic models where states have varying degrees of control. However, panel data analysis reveals that no effect is observed at the group level. A similar pattern is seen regarding the influence of term spread. Industrial production has a positive impact on the returns of Brazil and Indonesia, no impact on the returns of China and Pakistan, negative impact on the returns of India.
Conclusion and Recommendations
Investor sentiment has a significant influence on contemporaneous index returns in both linear and nonlinear settings in Brazil, Russia, Indonesia, China, and Pakistan whereas in India and at the group level it has a significant influence in linear terms only. Moreover, investor sentiment is predictive of stock market returns at different time horizons. It is also a predictor of stock market returns for Brazil, Russia, India, Indonesia, China, and Pakistan in both linear as well as in non-linear settings.
The positive link of investor sentiment, in the short and linear term, observed in the case of China, and Pakistan is aligned with the study of Cheema et al. (2020), Kling and Gao (2008), and Ruan et al. (2020), and negative link with subsequent returns observed in case of Russia is by the results of Da et al. (2019) and Ma et al. (2021). The negative link between investor sentiment, in the long run, and linear term, observed in the case of Russia, and Indonesia is supportive of the findings of Ruan et al. (2020) and Liu et al. (2020), and the positive link reflected in the case of Pakistan is lined up with the findings of Han and Li (2017). In the case of China in the long and linear term, investor sentiment is not predictive of market returns and these results are similar to the results of Kling and Gao (2008). In non-linear terms, the predictability of investor sentiment for index returns observed in the case of Brazil, Russia, Indonesia, India, and China is aligned with the results of Balcilar et al. (2017) and Li et al. (2017). The reversing of coefficient signs, in most of the countries, in the long term are indicative of the fact that deviation in the asset prices observed in the short term tends to converge toward their fundamental value over time. In Russia, China, Pakistan, and the panel the negative (positive) signs of coefficients observed in linear terms are reversed positive (negative) in the short and long term which means these markets correct the prices immediately. The changing signs of coefficients in India indicate that fluctuations in stock returns are frequent but are corrected time and again. Low values of
At the group level investor sentiment predicts stock index returns in the short run. The nonlinearity is observed on days 5, 10, and 20 days. Therefore, decision-makers cannot ignore sentiments as these influences investment outcomes. The results of this study may be helpful for investors to better understand the market trends under the influence of sentiments. It may also be helpful for portfolio managers and risk professionals for making systematic predictions and devising strategies for asset allocation, portfolio restructuring, and risk management.
Footnotes
Declaration of Conflicting Interests
The author(s) declared no potential conflicts of interest with respect to the research, authorship, and/or publication of this article.
Funding
The author(s) received no financial support for the research, authorship, and/or publication of this article.