
Abstract
This article models the behavior of 179 listed and unlisted real estate and construction firms (RECFs) in Canada to study how financial constraints impact the investment efficiency of these real estate firms during the 2004–2020 period. Investment efficiency is interpreted here as the ability and ease of a firm to convert investment opportunities into actual investments. The results show that Canadian RECFs are strongly dependent on two sources of financing: equity financing and debt financing. Equity financing helped ease financing constraints due to a cash flow increase but was unlikely to decrease the uncertainty of follow-up financing of investments of these companies. This study constructed an investment efficiency index (IEI) for all 179 RECF firms. The results showed an investment rate loss of approximately 62% of the RECF firms due to financing constraints during the above period. The IEI of RECFs in Canada has demonstrated a descending pattern, and the investment efficiency level slipped from 0.47 to 0.40 from 2004 to 2020. Furthermore, a regional analysis demonstrates that compared with the RECFs located in Ontario, the investment efficiency indices of RECFs in Quebec and British Columbia were more volatile. Small RECFs demonstrated a very steady trend in investment efficiency during the sample period, which was completely different from the patterns displayed by large and medium RECFs.
Keywords
Introduction
In a well-functioning financial sector, external finances through commercial banks and capital markets, that is, the stock market and bond market, play an important role in helping bridge the cash shortages of firms and make large, new orders possible for firms facing liquidity problems or working capital (WC) shortages. Such a possibility would usually either be far less likely or even nonexistent, as banks would be less interested in offering firms WC based merely on sales and inventories, except in the case of firms with sufficient collateral. However, the value of such collateral may fluctuate upon erratic movements in product prices if they are used as potential collateral for either equity or debt financing, as well as for borrowing from banks and other financial institutions. Furthermore, firms with no financial support from banks or other sources tend to look for supplier credit (although the potential of obtaining such credit may vary subject to erratic movement in product prices, provided the firm assets are used as collateral). Carvalho (2018) illustrates a theoretical framework in which he argues that a firm’s investment decisions depend on how much collateral they have and that when the value of collateral increases, financing constraints are relaxed.
Financing constraints, either due to limited access to the stock market and/or bond market or institutional credits, hinder growth and development opportunities of firms by constraining the employment of fixed asset investment, for example, in real estate firms. Eventually, this problem may become prominent when these firms require investment efficiency, enabling them to be internationally competitive. Usually, the available cash on hand or cash reserves in banks help overcome the cash constraints of a real estate firm, for example, when its costs of running the business temporarily exceed revenue earnings or when there are delays in receiving sales revenues. Therefore, firms with a tendency to experience a constant cash shortfall may have solvency problems resulting from liquidity risks, particularly when they are unable to cover expenses or accept new orders; the problem may be especially acute in the event of collecting the last sales of real estate properties. Consequently, these firms fail to commit to new orders or to make larger than normal orders. It is likely that these financial problems will eventually hinder real estate firms from undertaking the desired expansion and growth to take advantage of new business opportunities when they appear due to higher interest costs and nonavailability of collaterals compared with financially unconstrained real estate firms. The consequences are less investment, fewer jobs created, and less income generated by constrained real estate firms.
Another major aspect of financing constraints relates to the level of information asymmetry and deficiency of information; these two attributes may differ across real estate and construction firms (RECFs), among debtors and creditors. This problem may create difficulties for financial institutions to credibly determine the relative value of a RECF project, for example. This may lead to credit rationing and other pitfalls, such as risky credit to new RECFs, leading to high interest costs to borrowers, with a simultaneous high demand for collateral and long-term guarantees, further constraining capital acquisition. Furthermore, RECF owners who are unaware of alternative sources of capital may find their choices of funds limited. As capital acquisition becomes a constraint, the necessary level and growth of the investment expenditure required to sustain the current momentum of the capacity utilization rate in RECFs would be less and questioned.
According to the doctrine of neoclassical theory, investment becomes efficient when it improves firms’ market value and is inefficient when there is either overinvestment or underinvestment. This means that firms with overinvestment (e.g., due to easy access to external financing from the share market, bond market or other institutional credit markets, which helps them to inefficiently accumulate a high inventory volume) may be found to have invested in projects with negative net present values (NPVs), whereas firms with underinvestment (e.g., due to lack of required and timely finances from external sources) fail to exploit projects with positive NPVs. Conflicts of interest in and out of the firms may also prohibit them from efficient investments.
One may observe the above phenomenon due to a lack of proper alignment of interests between managers and shareholders that leads to conflicts, resulting in firms making inefficient investments. Conflicts between shareholders and debt holders may also result in inefficient investment. Furthermore, in lieu of the interests of shareholders, the persuasion of managers regarding their own interests helps generate manager–shareholder conflict. In addition, shareholders’ gains are given priority over the gains of debt holders, resulting in a conflict between shareholders and debt holders. Investment inefficiency may further be an outcome, particularly when managers and shareholders only cater to their respective self-interests in the first and second conflicts, respectively.
As Jensen (1986) argues, such inefficiency leads managers to pursue firm growth above the potentially optimal or desirable size. Firm managers often aim at practicing this as higher growth eventually elevates their power in the company with improved compensation. In a situation of severe manager-shareholder conflict—when managers’ interests are far different from those of shareholders and they can pursue interests other than those of shareholders—there may be a tendency for even greater overinvestment. According to Jensen, in such a profound manager-shareholder conflict, firms have a significant flow of free cash and few projects with positive NPVs. A hostile takeover, as Jensen pointed out, can solve this conflict. Firms where managers make bad decisions are attractive targets for hostile takeovers. Such a move is considered one way of solving the overinvestment problem (Jensen, 1986; Myers & Majluf, 1984). Hence, managers who fear hostile takeovers find incentives to distribute cash freely to shareholders instead of investing in projects with negative NPVs.
In the last 5 years, real estate entities in Canada have focused on real estate development opportunities over their usual tendency to acquire existing real estate properties. Large public Canadian real estate investment trusts (REITs) and pension funds began indirectly completing office buildings/towers and many mixed projects through their corporate arms. Foreign investment in Canadian real estate, such as by Asian-based firms, surged from 2010 until 2017, followed by a cooling off due to increased taxation, among other issues. Increased taxation and regulation led to a fall in Asian investment in Vancouver from its peak of CAD 1 billion in 2016 and 2017 to CAD 350 million; in Toronto, where such regulations were not implemented, investment was slightly up in 2017 over 2016. Afterward, there was an increase in U.S. investment in the Canadian real estate sector in 2018. Despite experiencing a decade-long superior performance, overall, the real estate investment in Canada fell by 20% at the start of 2019 over that of the first quarter of 2018 (Goodmans LLP, 2020).
Furthermore, despite the crash of global economic market returns in 2008 and 2009, this sector demonstrated a significant increase in its price level. The reasons include a low interest-rate environment and low capitalization and compression rates in the real estate sectors among various real estate classes in urban areas across Canada, namely, Vancouver, Toronto and more recently, Montreal.
The construction, real estate and related financial and insurance industries in Canada accounted for one-fifth of its GDP in 2017, accounting for 22.68% of total GDP by the end of 2017. These industries helped significantly drive the country’s GDP growth in 2017. When GDP in Canada fell by 0.6% in January 2016, its real estate sector was growing to such an extent that it represented approximately half of the country’s economic growth in 2016. Statistics indicate that, as a whole, Canadian industries utilized 86% of their production capacity in the fourth quarter of 2017. The greatest contributors to the overall increase in capacity utilization were construction and oil and gas extraction in the fourth quarter of 2017. The Canadian economy witnessed an increase in the capacity (production) utilization rate for six consecutive quarters, from 89.5% in the third quarter to 91% in the fourth quarter. An overall increase in construction sector activity was responsible for this occurrence.
Given that the real estate and construction (REC) sector in Canada accounted, on average, for a high-capacity utilization rate, the research question is as follows: to what extent has the REC sector in Canada been technically efficient at the firm level for all types of RECFs? Furthermore, there are discrepancies in the relative investment efficiency levels of each firm size across provinces. What are the dynamics of investment efficiency over time, regionally? Finally, to what extent have Canadian RECFs experienced any financing constraints, including cash constraints and external constraints (such as the ability to obtain equity financing and/or debt financing, etc.), preventing firms with different attributes from attaining investment efficiency?
In the present study, we use the information of 179 listed and unlisted Canadian RECFs traded in the 2004–2020 period. The results show that Canadian RECFs are strongly dependent on two sources of financing: equity financing and debt financing. Equity financing helped ease financing constraints due to a cash flow increase but was unlikely to decrease the uncertainty of follow-up financing of investment of these companies, on average. Both the coefficients of equity and debt financing variance functions are significant, presenting different signs. For example, the coefficient estimates and signs with debt financing indicate the likelihood of reducing the uncertainty of future follow-up financing, while such coefficient estimates and signs with equity financing are indicative of increasing the uncertainty of follow-up financing. The coefficients of equity and debt financing mean that functions are significant at the 5% and 1% levels, respectively. However, we find insignificant coefficient estimate values for both the equity and debt financing variance functions with different signs. For instance, debt financing is likely to reduce the uncertainty associated with future follow-up financing, while equity financing tends to increase such uncertainty.
This study constructed an investment efficiency index (IEI) for all 179 RECF firms. The results showed an investment rate loss of approximately 62% of these RECF firms due to financing constraints during the above period. The IEI of RECFs in Canada demonstrated a descending pattern, with the investment efficiency level slipping from 0.47 to 0.40 from 2004 to 2020. Compared with the RECFs located in Ontario, the IEIs of the RECFs in Quebec and British Columbia are more volatile. A regional analysis demonstrates that the three provinces demonstrate very different patterns in terms of financing channels. Small RECFs demonstrated a very steady trend in investment efficiency in the sample period, which was completely different from the patterns displayed by large and medium RECFs. The nexus is more significant for listed firms and for firms during noncrisis periods.
The present study has made two important contributions to existing studies in the field. First, few studies have focused on the financing constraints and investment efficiency of Canadian RECFs using firm-level data, despite the considerable growth of the REC section in Canada and increasing integration with international real estate markets in the last two decades. Lewis et al. (2003) analyze the cost efficiency of REITs. To perform this, they estimate the deviations of the measured costs of individual REITs from a defined efficient cost frontier.
We believe that using firm-level data from listed and unlisted RECFs could offer another interesting perspective in examining financing constraints on internal and external sources. The second contribution relates to the time-varying pattern of the investment efficiency of RECFs located in different provinces in Canada and RECFs in groups of different sizes in the sample period. The latter sheds light on the policy regulations of the REC sector from the policymakers’ perspective, as each provincial and territorial government has their individual statutes that govern the real estate sector.
This article is structured as follows. In Section “Dynamics of Firm-Level Investment Financing and Investment Efficiency,” we discuss the dynamics of firm-level investment financing and investment efficiency. A review of the literature is discussed in Section “Literature Review.” This is followed by a discussion on the choice of methodology and data in Section “Method and Data.” Section “Empirical Results” presents the empirical results and a robustness check. Finally, Section “Concluding Remarks” presents the concluding remarks of the study.
Dynamics of Firm-Level Investment Financing and Investment Efficiency
One may find the essence of financial flexibility (FF) and its value-creating role through its effects on the financial corporate decision-making process. FF helps firms undertake profitable investment, avoid investment and reduce the danger of bankruptcy under negative shocks of cash flows (Gamba & Triantis, 2008). FF enables firms to respond effectively to investment opportunities or unpredictable shocks at a lower cost than otherwise. This depends on a firm’s ability to generate basic cash holdings and assured and secured levels of potential cash flows for investment financing. Denis and Sibilkov (2010), De Jong et al. (2012), and Marchica and Mura (2010) all find the investment behavior of FF firms and their investment performances to be causal. They argue that FF firms make an easy initial investment and then can easily improve the firm’s investment performance with a follow-up investment. Here, they conclude that investment works as a mediator between FF and firm performance. In this process, they establish a causal connection between FF, investment, and performance in Chinese firms. They differentiate between investment efficiency and investment scale to examine how this distinction has been important in playing a key role in the process of making the firm financially flexible, thus affecting its performance.
The capital structure that firms choose and build on for investment depends on the relative ease and advantages in terms of cost and assured and secured levels of respective sources of investment funds generated both internally and externally. Given the availability of financial derivatives, Gamba and Triantis (2014) demonstrate that the ability to manage liquidity is essential, but it is also important to address the integrated risk-management system, where a wider spectrum of risks and high adjustment costs related to operating flexibility are prevalent. Evidence justifying superior stock performance due to fewer distortions in investment is abundant (Arslan-Ayaydin et al., 2014; Marchica & Mura, 2010).
Agha and Faff (2014) argue that firms with financial inflexibility find themselves to be highly (less) sensitive or vulnerable to bad (good) news than firms with FF. Rapp et al. (2014) find that firms with high value FF tend to make lower dividend payments, opting to share repurchases instead of paying dividends. Firms may further desire to obtain more cash than otherwise and pursue a debt policy that tends to be conservative. Other implications of FF relate to how these firms are able to design hybrid securities such as bonds that are callable and bonds that are convertible (Tewari et al., 2015). The important first-order factor in making financial investment decisions is to what extent firms are FF. This is evidence suggested by the Top US & Euro Executives (Brounen et al., 2006; Graham & Harvey, 2001). This observation is further endorsed with evidence that FF matters and becomes very important in periods of recession due to (a) larger (negative) shocks to corporate income, (b) reduction of equity values, and (c) shortage of credit supply (Ang & Smedema, 2011; Campello et al., 2010).
The assertion is that the components of WC and net WC itself constitute important parts of a firm’s total assets. WC is a source of liquidity, providing firms with a limited pool of financing sources. This is also an avenue to avoid dependence on alternative internal financial reserves, in that firms facing a high variance in cash flows and requiring investments in fixed capital can smooth out the variances in cash flows with WC (Fazzari & Petersen, 1993). This also means that WC competes with fixed capital in firms, resulting in a suboptimal investment in WC. This occurs when an internal source of finance is lacking. Earlier studies find evidence of suboptimal investment in WC, indicating that firms tend to have grossly ignored the importance of WC as a potential source of financing for growth (Buchmann & Jung, 2008). Ek and Guerin (2011) find opportunities for improving investment efficiency, given the current WC situation. However, firms with a relatively high level of WC may end up with high costs of debt and a higher likelihood of bankruptcy, consequently decreasing firm value (Baños-Caballero et al., 2014; de Almeida & Eid, 2014).
Accounts receivables, while they may be smaller than cash, can serve as an alternative to cash to finance potential customers to enhance firm sales and profitability; firms can otherwise force payment from customers earlier to improve the management efficiency of WC. The above relationships identify the natural linkages between WC and net WC, further linking the internal FF level and the FF value of firms. One can find a firm’s investment in WC to be effective and valuable when one is able to increase firm performance, reducing the risk with a reduced cost of capital. How easily a firm has been able to overcome internal financial inflexibility by arranging and maintaining necessary cash flows and how efficiently a firm makes good use of these funds greatly determine the firm’s ability to invest and the size of the required investments in WC. As WC competes with investment in fixed capital due to limited financing sources, it is obvious that firms may experience underinvestment in various forms of WC. This underlies an implicit relationship between the value of FF and the efficiency of investment in WC.
Furthermore, a firm can make use of WC to indicate some degree of internal flexibility, in addition to just holding cash (Bates et al., 2009). For example, firms could release unnecessarily high levels of WC to enhance their internal FF in terms of the cash reserves required for investment financing of other capital. Other benefits of the use of cash are associated with the advantages of extended trade credit benefits from suppliers and other short-term credits. Eventually, these options help reduce the costs of financing in WC and make the changes in WC and cash holding interdependent, enhancing the value of FF.
One may find theoretical ambiguity in the relationship between the capital structure of a firm and its investment efficiency. For example, outside equity may increase the incentives to divert funds, consequently leading to underinvestment, as finance managers may be required to share future returns from any current investment with shareholders. However, one would expect higher investment efficiency from debt financing, due largely to the stringent requirements of a state-independent stream of payments (Grossman & Hart, 1982). Furthermore, in a situation when a firm declares bankruptcy, creditors bear most of the returns on any additional investment. Consequently, one can find even highly leveraged firms reducing their investment in projects with high positive NPVs and, hence, experiencing a fall in investment efficiency (Myers, 1977). On average, lower capital investment becomes the norm with higher debt; however, this syndrome of lower investment (under investment) is overcome only when firms find immense growth opportunities.
On average, debt overhang reduces investment, but firms with debt overhang may invest more than other firms if they operate in economic sectors with global opportunities and potentials (Chudik et al., 2017). They find the above result consistent with the debt financing over equity financing proposed by Grossman and Hart (1982) due to the inherent disciplining role of the former and find it inconsistent due to inefficient underinvestment, as predicted by Myers (1977). Chudik et al. (2017) caution that firms experiencing a positive impact of debt financing on investment efficiency may experience three pitfalls.
First, firms with a relatively higher leverage ratio might tend to engage in risky and value-decreasing profits at the expense of investment efficiency. Second, a relatively larger share of short-term debt may actually decrease investment efficiency exclusively due to the high prevalence of sample firms predominantly financing investment out of short-term debt. Third, during systemic financial crises, the positive impact of debt overhang on investment efficiency usually either disappears or becomes nonexistent. One can find this particular effect to be consistent with the agency problems at both firms and banks. There is evidence that weak banks tended to cut credits to firms performing badly during the Eurozone crisis, misallocating credits, which eventually reduced the failure rates of these firms.
During a crisis period, Chudik et al. (2017) observed that firms with few growth opportunities invest relatively more than others, even with better economic opportunities. Such misallocation of investment, they argue, is due to poor and deteriorating credit market conditions. Other important determinants of low overall investment relate to various properties of firm-specific debt characteristics. Regulatory tools and prudential supervisions (proposed by Grossman & Hart, 1982) are responsible for curtailing credit booms; this allows firms to be overly leveraged and reliant on short-term debt, leading to a speedier recapitalization of banks during a period of financial crisis.
It is no wonder that the pattern of ownership type and concentration may precipitate manager-shareholder conflict. In firms with dispersed ownership, shareholders find limited interest in monitoring management. There is an obvious increase in managerial discretion when ownership is dispersed, limiting its ability to exercise supervision. Usually, with high ownership concentration, managers tend to become accountable more to shareholders. Therefore, in such firms, manager-shareholder conflict becomes less obvious and less important. When such ownership is dispersed, not resolute, and composed of minority shareholders, the conflict shifts instead to controlling the owners and shareholders by managers (see, for example, Cronqvist & Nilsson, 2003). There is an obvious difference in outcome between controlling an owner versus the manager as an opponent in the conflict. One may find more aligned incentives and interests by controlling owners and minority shareholders over managers and dispersed shareholders. By controlling shareholders, unlike managers, there is an opportunity to own a substantial portion of a firm’s shares, which eventually encourages control over owners to maximize shareholder value of the company.
One may observe, however, that controlling owners have a greater ability to pursue their own interests over those of managers; by arranging shareholders’ meetings, controlling owners can make more important decisions than managers. Furthermore, with the increase in ownership concentration, the capital stake of controlling owners also rises such that their capital incentives eventually align with those of the minority shareholders. In this process, while their discretion to pursue their own goals is amplified, one must be cautious. The risk that the positive effect of the controlling owner-minority shareholder conflict of more aligned capital incentives might overwhelm the negative effect due to greater discretion of the controlling owners due to an increase in ownership concentration should not be underestimated. At low levels of ownership concentration, conflict between the controlling ownership and minority shareholders are rare. If conflicts do exist, they can be mitigated by increased ownership concentrations. Therefore, it is customary for managers and controlling owners in general to engage in maximizing shareholders’ value when the ownership concentration increases.
Several studies find the effects of leverage on the investment efficiency of overinvestment or underinvestment. The importance of a firm having financial leverage is self-evident; it can explain firms facing investment inefficiencies in that the nature and extent of leverage of a firm may affect manager-shareholder and shareholder-debt holder conflict (Jensen, 1986; Myers, 1977). However, most research on the investment efficiency of firms has tested the effects of factors other than leverage, such as ownership structure, insider ownership and the legal framework (Gedajlovic & Shapiro, 1998; Thomsen & Pedersen, 2000). For instance, a study of Swedish firms in the 1997–2005 period applied the following three different investment efficiency measures: marginal q, absolute investment (capital expenditure plus R&D expenses), and Tobin’s Q. It is observed that the investment efficiency of overinvesting firms improves by greater leverage based only on marginal q measures of investment efficiency; there is no such response with the other two investment efficiency measures, that is, absolute investment and Tobin’s Q.
Literature Review
Numerous studies on financing constraints and corporate investment have been conducted since the foundational work of Fazzari et al. (1988), followed by several important studies by Hoshi et al. (1991), Bond and Meghir (1994), Hubbard (1998), Kadapakkam et al. (1998), Wang (2003), Bhaumik et al. (2012), and Das (2014).
Since borrowers and lenders hold asymmetric information, selection becomes adverse, and moral hazard becomes the norm, hindering the efficient operation of financial markets. There is a high cost of stakeholders not holding perfect information. Firms face investment constraints when they are not able to find readily available financing other than high-cost finance. Stiglitz and Weiss (1981) investigate this issue for bank credit and Myers and Majluf (1984) for the equity market. The financing literature suggests that firms experiencing financing constraints typically have various firm attributes and characteristics, including small firm size, nondividend paying, and poor credit ratings. All these factors are responsible for their investment spending behavior.
Another important dimension is cash flow. Researchers, following Fazzari et al. (1988), observe the cash flow variable to be important; later they add this variable to the Hayashi’s (1982) Q-model of investment to measure the extent to which investment is responsive to various levels of cash flow in different subsamples. The evidence suggests a strong correlation between investment and cash flow for subsamples of financially constrained firms (Gilchrist & Himmelberg, 1995). Further studies on this relationship have found the likely existence of capital market imperfections and evidence of a financial accelerator mechanism.
Recent studies invalidate the above assertion of the investment sensitivity of a firm to its own cash flow because even under imperfect capital markets, firms with less severe financing constraints might face stronger cash flow sensitivities (Kaplan & Zingales, 2000). Measurement errors in Tobin’s Q may lead firms even under perfect capital markets to experience cash flow sensitivity (Erickson & Whited, 2000) because of market power (Cooper & Ejarque, 2003), the effect of uncertainty (Alti, 2003) and the presence of nonconvex capital adjustment costs (Pratap, 2003). Other researchers find that firms with significant cash flow coefficients measuring cash flow sensitivity do not necessarily qualify to have experienced financing constraints of any sort. To this end, Gomes (2001) explicitly models equity finance, and Moyen (2004) then models debt finance; both simulate data on investment with a null hypothesis, assuming perfection in the capital market and otherwise. Bond and Van Reenen (2007) convey that a firm enjoying a windfall gain of cash flow will not necessarily provide any strong basis for future profitability or investment opportunities and, hence, grounds for increased spending.
Given the reflective and interesting relationship between financing constraints on a firm’s investment and financing behavior, researchers further investigated this issue under various regional and industrial settings. For instance, Harris et al. (1994) examine the above association for Indonesia, Günçavdı et al. (1998) for Turkey, Gelos and Werner (2002) for Mexico, Wang (2003) for Taiwan, Koo and Maeng (2005) for Korea, Bhaduri (2005) and Ghosh (2006) for India, and finally, McVanel and Perevalov (2008), Leung and Secrieru (2012) and Islam and Luo (2018) for Canada. McVanel and Perevalov (2008), by using data at the firm level for Canadian firms for the 1980–2006 period, observe that the cash holding behavior and firm characteristics were highly correlated, finding that the smaller the firm size, the larger cash holdings become. Furthermore, firms experiencing variability in cash flow tend to hold fewer substitutes of cash, and firms with a tendency to spend frequently on R&D tend to become financially distressed.
Leung and Secrieru (2012) study the strength of real financial linkages by applying input–output analysis. They calculate and compare multipliers with and without endogenous financial flows to test the impact of financial flows when there is a final demand shock in the economy, finding that it increases the impact of a final demand shock on output by 4%–11%.
Economies of scale and X-efficiency are two economic concepts used in the literature to analyze industry efficiency, firm efficiency and optimal firm and industry size in the real estate sector. The position of a firm on the long-run average total cost curve determines whether the firm is scale efficient, and firm inefficiency results from the failure to operate at a constant return to scale (CRS). It may also arise from suboptimal use of firm factors of production. Bers and Springer (1997) employ this approach. X-efficiency techniques allow a relatively better assessment of efficiency, as they compute a firm’s efficiency relative to an efficient frontier. Leibenstein (1966) finds that efficiency losses result from the lack of motivation of managers to operate efficiently. Bers and Springer (1998) find evidence that comparatively larger REITs can access more favorable debt terms in capital markets.
Anderson et al. (2002) apply data envelopment analysis (DEA) to estimate economies of scale and X-efficiency for REITs and find that REITs are inefficient, with the overall range of measures indicating that between 44.1% and 60.5% of firms are inefficient. They observe the nature of inefficiencies to be technical and allocative, meaning that firms experiencing deviations from the efficient frontier fail to use the input mix optimally and fail to make efficient use of factors that are already available with REITs.
While DEA methods overcome some of the statistical issues of regression-based methods, shortcomings remain. DEA, as with single error-based methodologies, regards any deviation from an efficient frontier surface as an inefficiency, and these inefficient results are biased, as the technique does not allow for or regard any random factors or random error term, causing the deviation. This makes the use of DEA sensitive to the model specifications and outlying observations. Furthermore, it measures the relative efficiency rather than optimal efficiency and is subject to a larger variation given the various types of data sets.
The debt level may benefit the cost performance of a firm in that leverage may serve as a tool to discipline a manager, where debt may serve to offset the free cash flow problem by reducing cash flow due to higher interest, thereby forcing the manager to be more cost efficient (Jensen, 1986). High interest costs cause REITs to be less cost efficient. All these results suggest that leverage promotes cost efficiency when managers are able to reduce other costs of factors more than proportionally to offset higher interest costs. Anderson et al. (2002) investigate REITs for the 1992–1996 period individually and find inconclusive results overall. However, they observe that increases in leverage are negatively related to REIT input utilization.
Lewis et al. (2003) apply the stochastic frontier approach, incorporating Bayesian statistics to analyze the cost efficiency of REITs; they use the data for the 1995–1997 period. They make use of deviations of the estimated costs of individual REITs from a well-defined cost frontier to estimate the (a) magnitude of managerial inefficiency of each REIT, (b) industry inefficiency, and (c) returns to scale. They calculate the odds ratio to assess the specific characteristics/attributes of REITs for their respective contribution to inefficiency and observe that REITs with a particular characteristic/attribute tends to be more efficient than REITs with an alternative characteristic/attribute. Furthermore, REITs experiencing increasing returns to scale tend to be mostly cost efficient.
Chung et al. (2012) investigate whether institutional investors help to improve governance and firm inefficiency, creating firm value in various economic and financial circumstances and crises due to dot.com bubbles, the collapse of Enron, and the 2007–2009 subprime mortgage and global financial crisis. By applying a stochastic frontier approach, they discover a reduction in firm inefficiency due to institutional ownership; they also find a stronger effect for active, top-five, and long-term investors (with relatively long lease firms, such as retail, office, and health care REITs). These were possible, as they argue, due to higher equity stakes or longer investment horizons, as firms have incentives to improve their corporate governance. Short-term institutional investors (such as residential and lodging REITs, holding shorter leases) have no effect on firm inefficiency, as they are myopic with little incentive to monitor firm governance. A recent study by Pyles and Khieu (2018) confirms that constrained REIT firms hold relatively greater cash than their unconstrained counterparts do. Islam and Luo (2018) apply the stochastic frontier approach to investigate to what extent Canadian forest firms face financing constraints for the 2004–2014 period. They report that investment efficiency is approximately 60%, and the time-varying patterns of investment efficiency in three major provinces are significantly different.
Method and Data
The implicit assumption of a traditional regression-based technique with a single point error term is that a REIT operates on the efficient cost frontier, which is a correct depiction of scale economies. Firms operating off the efficient cost frontier are called X-inefficient. This is found in the studies on banking, insurance, and real estate brokerage. Berger et al. (1993) find that firms face substantially more losses in efficiency due to not being X-efficient than the losses due to failing to be scale efficient. This raises the efficacy issue of the usefulness of the traditional methodology to correctly estimate efficiency.
While a good number of studies address the efficiency of REITs in estimating scale economies and X-efficiency purely from a cost perspective, we find no studies examining investment efficiency and financing constraints in the REC sector in Canada. Given this impetus, we model the financing behavior of Canadian RECFs by applying the stochastic frontier approach. There is no a priori separation of samples in our model based on the following attributes to test the investment sensitivity of firms to cash flow and other explanatory variables: firm size (amount of assets), firm age, ownership type and pattern, firm leverage, and firm location or region.
Our study closely follows Wang (2003) and Islam and Luo (2018) to examine the stochastic frontier model, as follows:

where

where

Equation (3) is a generalized form depicting the existence of financial constraints that eventually reduce a company’s investment spending. If we assume

Equation (4) is a typical stochastic frontier model described in Wang (2003). Here, the difference between the efficient investment-to-capital ratio and the observed investment-to-capital ratio is attributed to financing constraints; this is represented by a nonnegative term

and

where

where

The variables in Equation (8) are parameterized to model heteroscedasticity in

and

where
We made use of data from 179 listed and unlisted Canadian RECFs for the 2004–2020 period. Our dataset consists of 3,043 firm-year observations. We use Tobin’s Q as the proxy of investment opportunity
Summary Statistics.

The mean investment expenditure is shown in Table 1. We measure it by capital expenditures from cash flow statements; it is approximately 132.8%. The mean log of Tobin’s Q is 0.87. Regarding external financing, Canadian RECFs rely on both the stock market and bond market. This is evident from the incremental value of equity financing and debt financing.
Empirical Results
Stochastic Frontier Analysis
We present the results of various stochastic frontier models in Table 2. The benchmark model (m1) shows that the sign of the cash flow coefficient is found to be negative and significant in the mean function; this is significantly positive in the variance function. This means that RECFs, on average, are able to ease financing constraints due to an increase in cash flow with a likelihood of an increase in uncertainty of the company’s follow-up financing in the future. The coefficients of both the equity and debt financing mean functions are significant at the 1% level. This result signifies the assertion of a strong investment dependence of Canadian RECFs on both equity financing and debt financing. The coefficient estimates of variance functions of equity and debt financing are found to be significant but with different signs; on one hand, debt financing is likely to reduce the uncertainty of future financing; on the other hand, equity financing tends to accentuate or widen the uncertainty of future follow-up financing from equity.
Stochastic Frontier Models.

10% level of significance. **5% level of significance. ***1% level of significance.
We also follow Wang (2003) and Islam and Luo (2018) to estimate the IEI, which has a value between 0 and 1.
Following Battese and Coelli’s (1995) setting, Model 2 (m2) is developed. It is assumed that cash flows and firm size have no impact on the uncertainty of financing constraints. Model 3 (m3) also assumes that cash flows and firm size do not affect the financing constraint itself. Model 4 (m4) assumes that investment inefficiency

A value of 0 indicates the tendency to be the least efficient investment, while a value of 1 indicates the most efficient investment. We demonstrate the frequency distribution of the IEI for Canadian RECFs plotted in Figure 1. While there is a skewed distribution of the IEI to the left, we find that RECFs facing financing constraints are responsible for an approximately 62% loss of the rate of investment.
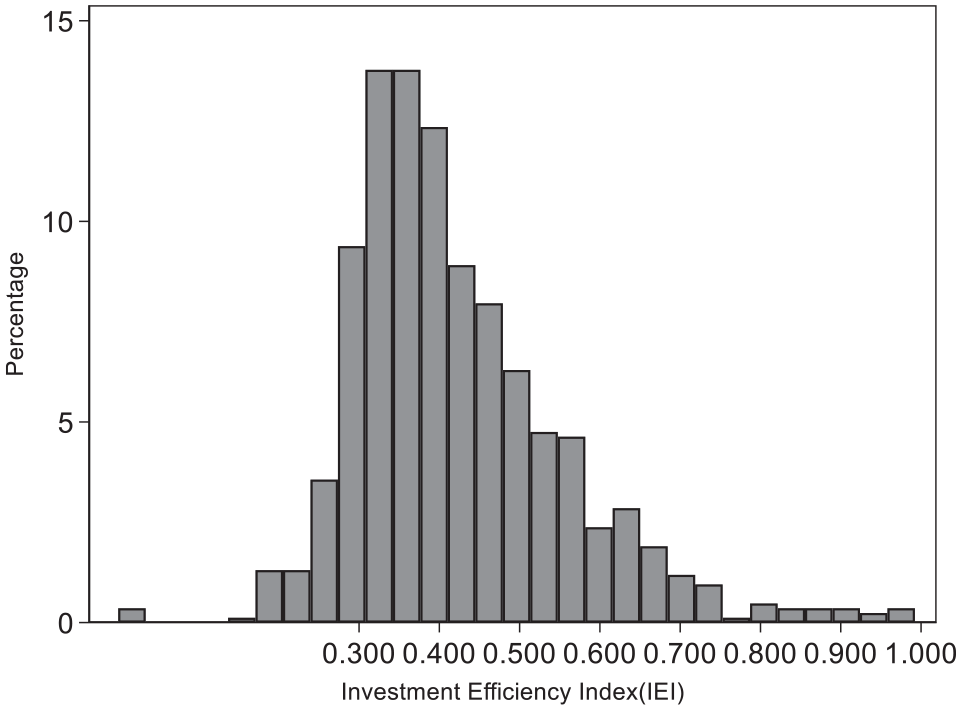
Investment efficiency index.
Regional Analysis
The results of the unrestricted benchmark model are shown in Table 3 for three provinces. They are Quebec (QC), British Columbia (BC), and Ontario (ON). We find the coefficient estimate of investment opportunity (measured as ln_tobin) to be significant at the 1% level for ON, while they are insignificant for both QC and BC. The coefficient estimate value for ON is 0.371, which is higher than that of QC and BC. The coefficient estimates for cash flow variables are significantly negative in the mean functions and insignificantly negative in the variance functions for the BC. This indicates that the RECFs of British Columbia are able to ease financing constraints due to an increase in cash flow. Nevertheless, the sign of the cash flow coefficient is negative and insignificant in the mean function for the RECFs in QC, while the cash flow coefficient is significantly negative in the variance function. This indicates that the RECFs of Quebec are not able to ease financing constraints due to an increase in cash flow with a likelihood of reducing the uncertainty of the company’s follow-up financing.
Stochastic Frontier Results for Quebec (QC), Ontario (ON), and British Columbia (BC).

10% level of significance. **5% level of significance. ***1% level of significance.
In terms of financing channels, the three provinces demonstrate very different patterns. In Ontario, the coefficients of both the equity and debt financing mean functions are significant at the 1% level. This again supports the assertion regarding a strong dependence of Ontario’s RECFs on both equity financing and debt financing. The coefficients of the equity and debt financing variance functions, however, are insignificant and have different signs, which shows that both debt and equity financing channels are likely to reduce the uncertainty of future financing.
In British Columbia, the coefficient of the debt financing mean function is significant at the 5% level, while the coefficient of the equity financing mean function is insignificant. This finding demonstrates a strong dependence of British Columbia’s RECFs on debt financing instead of equity financing. The coefficient of the equity financing variance functions is positive and significant at the 5% level. It might help to explain that British Columbia’s RECFs tend to avoid using equity financing because it enlarges the uncertainty of future financing.
In Quebec, the coefficient of the debt financing mean function is significant at the 10% level, while the coefficient of the equity financing mean function is insignificant. This finding demonstrates a dependence of Quebec’s RECFs on debt financing instead of equity financing. The coefficients of both the equity and debt financing variance functions are negative and insignificant, which shows that both equity and debt financing are likely to reduce the uncertainty of future financing.
In Figure 2 we present the time varying pattern of the IEI results of three provinces, that is, QC, BC, and ON, and of Canada as a whole. The IEI of the RECFs in Canada has demonstrated a descending pattern, and the investment efficiency level slipped from 0.47 to 0.40 from 2005 to 2020. The global financial crisis temporarily shocked the investment efficiency of RECFs in Canada between 2008 and 2009. Compared with the RECFs located in Ontario, the IEIs of RECFs in Quebec and British Columbia are more volatile.

Time-varying pattern of regional investment efficiency indices (IEIs).
Listed vs. Unlisted Firms
We also compare the results of the unrestricted benchmark model for listed and unlisted RECFs. The coefficient estimate of investment opportunity is significant at the 1% level for listed firms and insignificant for unlisted firms. The coefficient estimates for cash flow variables in the mean and variance functions are all positive and insignificant for both listed and unlisted firms.
The listed RECFs’ coefficients of the equity financing mean function are significant at the 10% level, and the coefficients of the debt financing mean function are significant at the 1% level. It is not a surprise that the coefficients of these two mean functions for unlisted firms are both insignificant. It is commonly believed that listed firms have strong dependence on both financing channels.
The coefficients of equity and debt financing variance functions are insignificant for both listed and unlisted firms. A negative sign of the coefficients of debt financing variance functions indicates that debt financing is likely to reduce the uncertainty of future financing for RECFs, regardless of whether they are listed or unlisted. Nevertheless, the positive sign of the coefficient of the equity financing variance function shows that if listed RECFs choose to raise capital to finance debt or make growth acquisitions by undertaking secondary offerings, this may result in increasing the uncertainty of future financing. However, this effect is not evident in unlisted firms (Table 4).
Stochastic Frontier Results for Listed and Unlisted Firms.

10% level of significance. **5% level of significance. ***1% level of significance.
Size Analysis
Figure 3 reports the time varying pattern of the IEI results of the RECFs in the different sized groups. The small RECFs demonstrated a very steady pattern in investment efficiency in the sample period, ranging between 0.44 and 0.51. They were barely affected by the global financial crisis. The medium-sized RECFs demonstrated a prominent descending trend in investment efficiency between 2005 and 2020. The IEI of the median RECFs fell from 0.57 to 0.34 between 2005 and 2009, bounced back to 0.52 in 2012, and eventually dropped to 0.37 in 2020. We may conclude that the medium-sized RECFs were significantly affected by the global financial crisis. The IEI of large RECFs fluctuated between 0.33 and 0.46 before 2009 but stabilized after the global financial crisis and eventually ended at 0.34 in 2020.

Time-varying pattern of investment efficiency indices (IEIs) for real estate and construction firms (RECFs) in different size groups.
Robustness Check
Greene (2005) notes that the literature on stochastic frontiers dealing with panel data does not provide much scope or a mechanism to disentangle the effects of unmeasured heterogeneity and inefficiency. We find in the literature a blended use of these two characteristics in a single term in the model. To supplement the stochastic frontier analysis in the previous section, we adopt various econometric methodologies to test whether they will render consistent results as well as an orderly distinction between unmeasured heterogeneity and inefficiency.
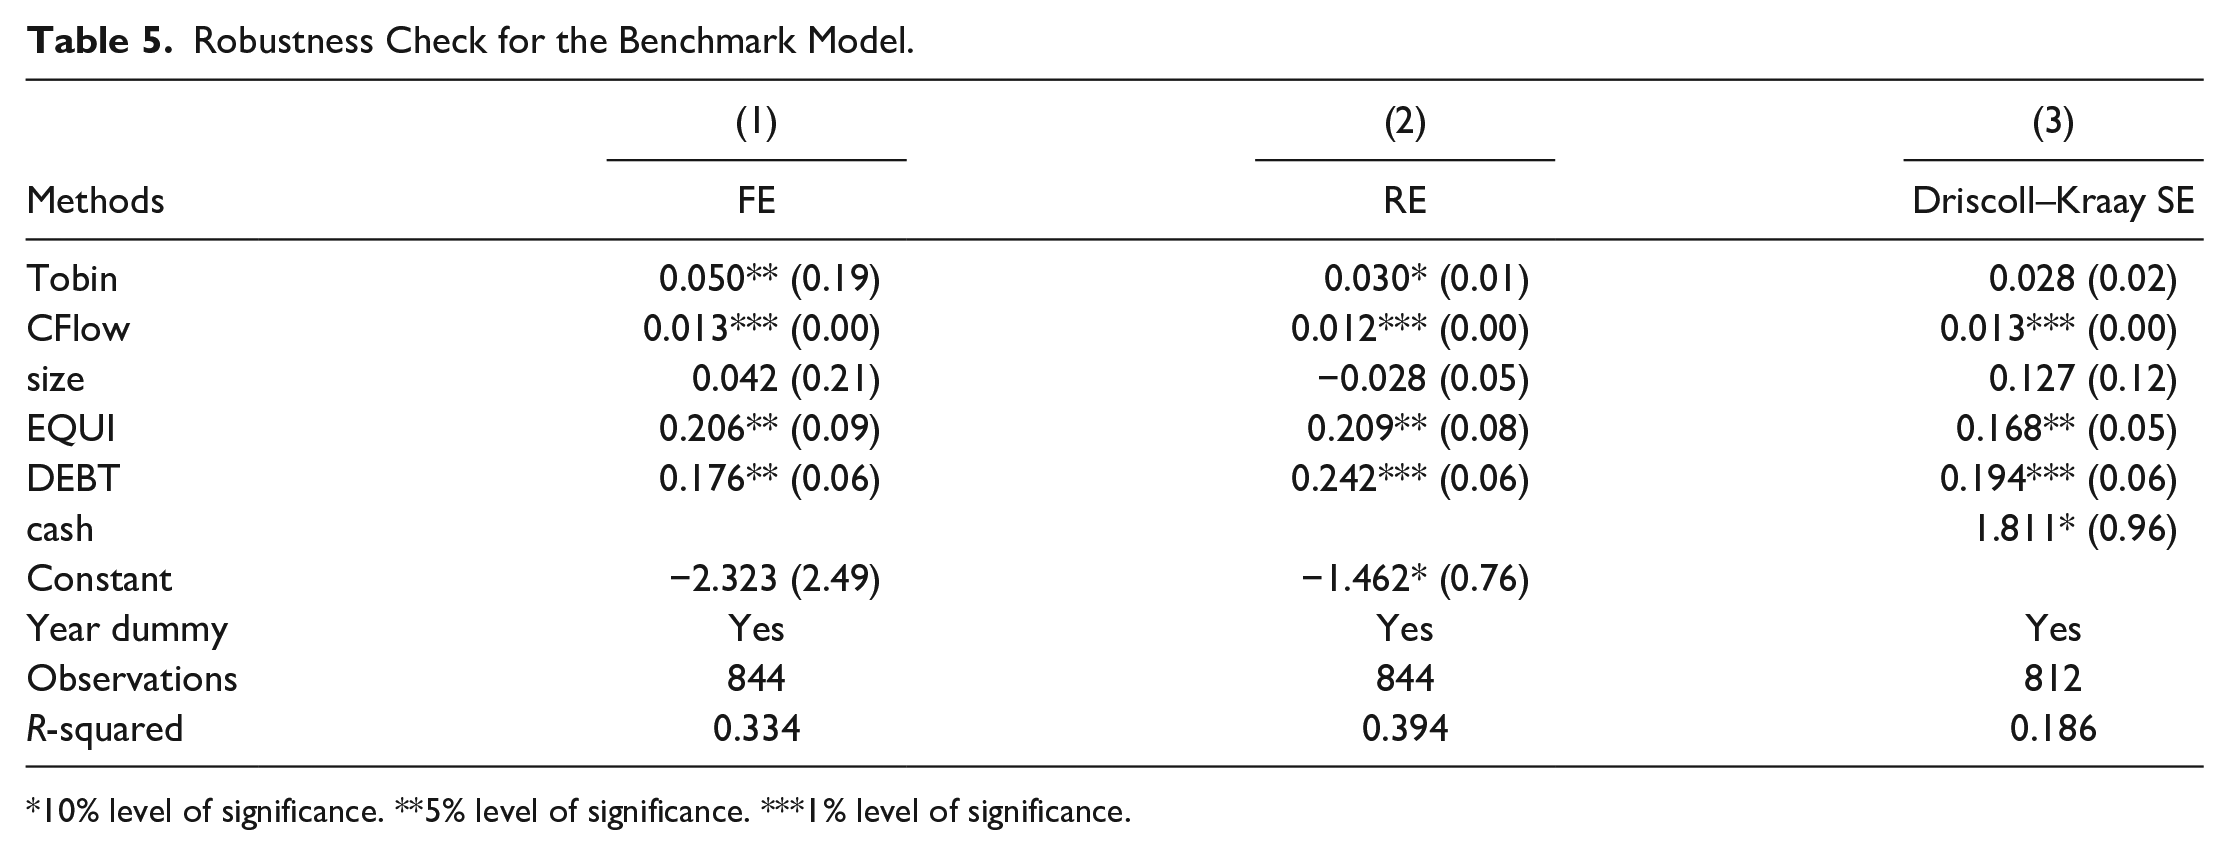
The robustness check results are reported in Table 5. First, we apply the fixed-effects estimator to re-estimate the regressions. As shown in Column (1) of Table 5, we find the coefficient on Tobin’s Q index to be statistically positive. We then apply the random-effects estimator and find that the coefficient on Tobin’s Q in Column (2) still turns out to be statistically positive. Finally, in Column (3), we use the Driscoll–Kraay standard errors (Driscoll & Kraay, 1998) in the fixed effects estimation. This cross-sectional dependence could be attributed to market-wide shocks on all firms in a country. We find that our main results remain the same when using the Driscoll–Kraay standard errors. The positive results of equity and debt financing across the abovementioned five models demonstrate that both external sources of financing are important for Canadian RECF investments.
Robustness Check for the Benchmark Model.
10% level of significance. **5% level of significance. ***1% level of significance.
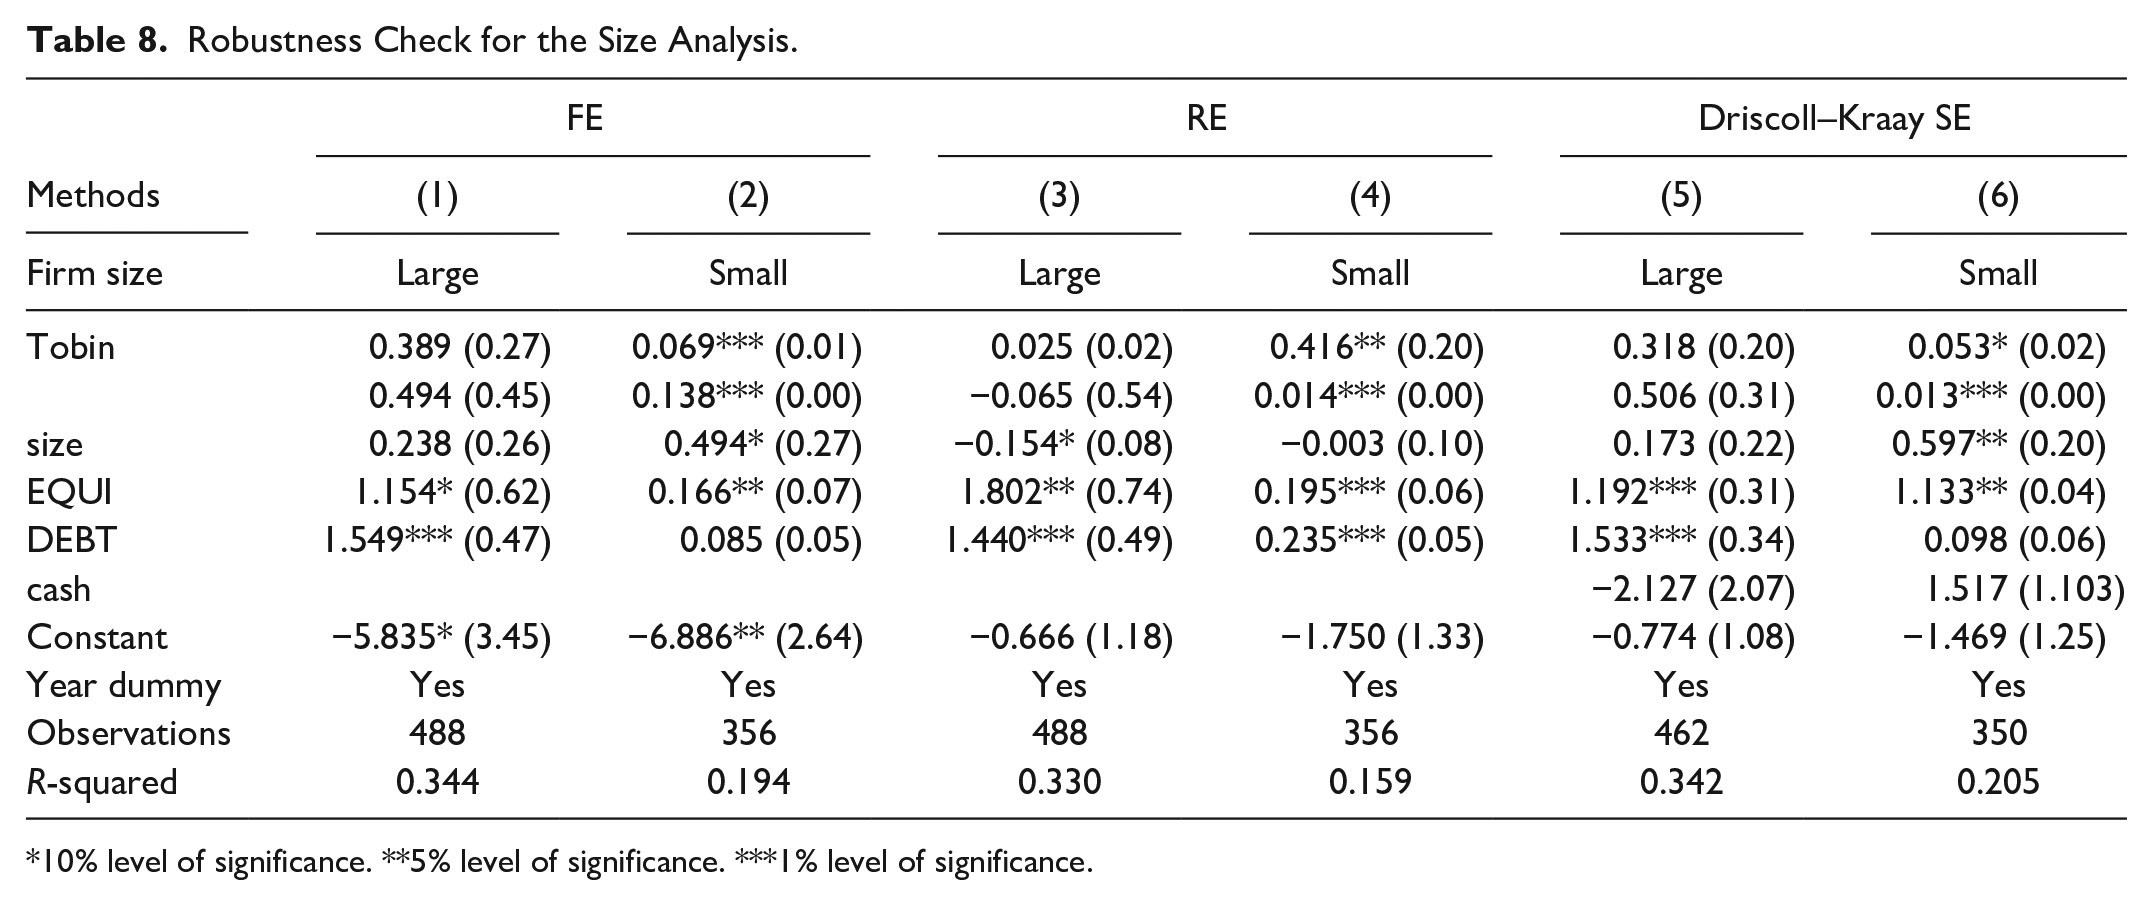
The robustness check of the firms is conducted next by province. The results are demonstrated in Table 6. The coefficients of Tobin’s Q in BC and ON demonstrate positive signs for all regressions, while the significance depends on the estimation methods. Debt financing is positive and significant for almost all regressions. We also apply alternative methods to examine the firm listed status and size effect by dividing the firms according to their listed status and asset size (above/below the mean) and report the results in Tables 7 and 8, respectively. It is shown that the coefficients of Tobin’s Q are statistically positive for all regressions for listed firms and small firms. Finally, we examine whether the 2008/2009 financial crisis had an impact on financing constraints and the investment efficiency nexus by dividing our sample into two periods (2007–2009 and other years). As shown in Table 9, we find that the nexus is more significant for the noncrisis period.
Robustness Check for the Regional Analysis.

10% level of significance. **5% level of significance. ***1% level of significance.
Robustness Check for the Listed/Unlisted Status Analysis.

10% level of significance. **5% level of significance. ***1% level of significance.
Robustness Check for the Size Analysis.
10% level of significance. **5% level of significance. ***1% level of significance.
Robustness Check for the Crisis Period.

10% level of significance. **5% level of significance. ***1% level of significance.
Concluding Remarks
This article models the behavior of 179 listed and unlisted RECFs in Canada to study the nature of financing constraints and their impact on investment efficiency for the 2004–2020 period. The results show that Canadian RECFs are strongly dependent on using both equity financing and debt financing; they are able to ease financing constraints due to an increase in cash flow, although with a likelihood of increasing the uncertainty of the company’s follow-up financing in the future. The coefficients of the equity and debt financing variance functions are found to be both significant, presenting different signs. These results indicate that debt financing is likely to reduce the uncertainty of future follow-up financing, while equity financing might rather widen or enlarge the uncertainty.
The study estimated the IEI for 179 RECFs. The results demonstrate a loss of approximately 62% of the rate of investment due to financing constraints during the sample period. The IEI of the RECFs in Canada has demonstrated a descending pattern, and the investment efficiency level fell from 0.47 to 0.40 from 2004 to 2020. The global financial crisis temporarily shocked the investment efficiency of RECFs in Canada between 2008 and 2009. The IEIs of the RECFs in Quebec and British Columbia are more volatile than those in Ontario. The regional analysis demonstrates that the three provinces demonstrate very different patterns in terms of financing channels.
The time varying pattern of the investment efficiency indices of the RECFs in the different sized groups demonstrates some interesting results. The small RECFs were barely affected by the global financial crisis, as their IEI demonstrated a very steady pattern in the sample period. The medium-sized RECFs displayed a prominent descending trend with high volatility in investment efficiency between 2005 and 2020. The IEI of the large RECFs was found to fluctuate between 0.33 and 0.46 before 2009 but stabilized after the global financial crisis and eventually ended at 0.34 in 2020.
Given the liberalization of financial markets in Canada since the 1990s, our results suggest that, overall, Canadian RECFs experienced financing constraints. The study found a trend of deterioration in the median investment efficiency of RECFs in Canada between 2004 and 2020. However, the investment efficiency of RECFs slightly improved with small RECFs located in Ontario. Investment efficiency is interpreted here as the ability and ease of a firm to convert investment opportunities into actual investments.
Furthermore, given the dynamics of the financing constraints of Canadian RECFs in the provinces of BC, ON, and QC from 2004 to 2020, our study demonstrates a rather paradoxical view on two points. First, it relates to the financing adequacy of RECFs on average nationally due to the high influx of foreign capital to this sector, and second, the capacity utilization rate of this sector nationally was as high as 89%–91%. Our findings also shed light on the efficacy of different sources of external financing (equity financing versus debt financing) and their relative weights to be discerned by concerned policymakers and management personnel in Canadian RECFs (across provinces with various RECF sizes) when they opt for external funding.
Footnotes
Acknowledgements
The authors thank the School of Economics at Peking University for providing the Bureau van Dijk Osiris database during Hang (Robin) Luo’s visit.
Declaration of Conflicting Interests
The author(s) declared no potential conflicts of interest with respect to the research, authorship, and/or publication of this article.
Funding
The author(s) disclosed receipt of the following financial support for the research, authorship, and/or publication of this article: This research is financially supported by the National Science Foundation of China (Grant No. 71971174), Department of Science and Technology of Sichuan Province (Funding No: 2021JDR0222), Chengdu Science and Technology Bureau Soft Science Project (Grant No. 2020-RK00-00172-ZF), and Social Science Planning Project of Sichuan Province (Grant No. SC19B121).