
Abstract
Export tax rebate (ETR) and inwards foreign direct investment (IFDI) are important driving forces for the steady development of China’s export-oriented economy. Based on data from 2004 to 2019, this study puts forward relevant assumptions on constructing a model for empirically analyzing the impact of the ETR on China’s IFDI from the perspective of the national and the sub-national. The result demonstrates that there exists a complementary relationship between the ETR and IFDI; the weak lag effect of ETR on IFDI in the eastern, middle, and western regions of China; an explicit impact on the performance in the western region, which lags behind only one period; and no significant lag effect of ETR on IFDI in developed, moderately developed, and underdeveloped regions. On the basis of this evaluation, the conclusion could be achieved that that ETR has a significant effect on IFDI, though there may be differences in the direction and value of the impact. The highlight of this research is to detect the impact of ETR on IFDI by taking China as a case, and achieved that there exist sub-national differences, including the geographical and development-level differences.
Plain Language Summary
The purpose of this article was to detect the impact of export tax rebates (ETR) on China’s Inwards Foreign Direct Investment (IFDI) by considering various types of regional differences. The main methods was to establish econometric model considering of time lag effect and control variable and bring relevant hypothesis, then made panel data model to reveal the impact from perspectives of different regions. The conclusion was that the impact of the ETR on the IFDI generally demonstrated differences in complementarity, lag, and geographical and development levels. The implications was that China should implement different regional ETR policy for achieving larger effect on IFDI. The limitations could be detected from two aspects, which was whether an ETR that lags behind to be adopted being debatable and the adoption of enterprise microdata could effectively examine the impact of ETR on IFDI respectively.
Introduction
The export tax rebate (ETR) is an important engine for China’s export-oriented economic development, especially for accelerating the scale of trade, including that of import and export. It not only comparatively promotes fair international competition but also affects the development of related industries. Meanwhile, the adjustment of ETR policy in China is a route treatment for achieving certain targets (F. Chen & Chen, 2022). For example, it had experienced eleven adjustments from 1994 to 2010, including the first change in 1995 to 1996 with ETR rate being 3%, 6%, and 9% respectively, the second change in 1998 with ETR rate being 5%, 13%, 15%, and 17% respectively, the third change in 1st January 2004 with ETR rate being 5%, 8%, 11%, 13%, and 17% respectively, the fourth change in 2005 with ETR rate according to the feature of the category, the fifth change in 1st July 2007 with ETR rate being 5%, 9%, 11%, 13%, and 17% respectively, the sixth change in 1st August 2008 caring much about garments, the seventh change in 1st November 2008 with ETR rate being 5%, 9%, 11%, 13%, 14%, and 17% respectively, the eighth change in 1st February 2009, the ninth change in 1st April 2009, the tenth change in 1st July 2009 and eleventh change in 15th June 2010 caring mainly about certain categories. In fact, China’s ERT rate pays more focus on certain category but not the rate generally. Recently, the round of the ETR policy adjustments in China based on changes in the domestic and international environment, which began on 20th March, 2020, had significantly adjusted the ETR rate as per different categories, for example, the ETR rates of 1,084 products, such as porcelain sanitary appliances, and 380 products, such as plant growth regulators, had increased to 13% and 9% respectively, which will further enhance international competitiveness in China’s merchandise trade; Chinese State Tax Administration issued No. 9 document for adjusting ETR on 29th April, 2022, mainly took methods by bettering management policies and optimizing relevant policies of ETR.
“Bringing in” strategy and “Going out” strategy are two major strategies for China’s achieving sustainable and rapid economic development especially open economy since the implementation of open up policy. Among which, “Bringing in” strategy implies to take attracting foreign direct investment (IFDI) as main target, and this could be demonstrated by China’s policy of “market for technology” to some extent. For example, the quantity of China’s actual used FDI (here, it refers to IFDI) was US$ 40.67 trillion in 2002, US$ 111.72 trillion in 2012, US$ 189.13 trillion in 2022, respectively, and that increased 6.3% in 2022 even under background of severe COVID-19 and anti-globalization, with the quality of IFDI being steady promotion (X. P. Xu & Sheng, 2012). The rapid increase of IFDI could be result of the success of “Bringing in” strategy. In fact, China’s industrial development is driven by multiple internal and external factors, and IFDI is an influencing factor in the development of an open economy (Kandogan, 2016; C. G. Li et al., 2021; Z. X. Zhao & Zhang, 2010); it has a dominant impact on the steady transformation and upgrading of industries (S. L. Wang et al., 2020), and economic development (Gusarova, 2019; Wei et al., 2022), especially owns significant impact on high-tech industry (K. Liu et al., 2014). Therefore, IFDI is an important channel for exploring China’s steadily development so as to maintain China Miracle.
There is no doubt that ETR and IFDI contribute much to the development of outwards economy in China. ETR would influence export directly, and IFDI could be some signal of attracting foreign capital with the feature of comparatively strong international competitiveness. ETR would obviously influence export, and this would affect the decision of the foreign enterprise, then imposes relevant impact on investment made by the foreign enterprise. Hence, ETR may be related to IFDI by affecting export-oriented economic development. Therefore, it is necessary to analyze the impact of the ETR on China’s IFDI absorption.
Literature Review
As per research of the effect of ETR on IFDI, few direct literature could be detected, and the relevant literature might include the following three aspects, which is the impact of ETR on economic and social development, ETR on export, and export on foreign investment respectively.
ETR could touch the effect of resource allocation (Weinberger et al., 2022), which would influence economic and social development. As for China, ETR have a corresponding impact on economic transformation and upgrading, and usually could be regarded as a trade policy (Braakmann et al., 2020). For example, Song et al. (2015) considered huge exports facilitated by ETR as exerting significant environmental pressure, and its structure should be optimized to reduce comparative pollution. Following the CEEPA model, Fan et al. (2015) discussed the effects of the cancellation of export rebates on CO2 emissions and socioeconomic consequences, and reached similar conclusions on the relationship between ETR and environmental change. An et al. (2017) explored regional effect of export tax rebate on exporting enterprise in China. Z. H. Xu (2018) found that the counteracting effects of China’s export tax rebate policy affected the effectiveness of real exchange rates in facilitating the resolution of trade imbalances under background of the pegged exchange rate regime. D. Y. Zhang (2019) found that export tax rebate would expand export scale and work as an alternative financial tunnel to increase firms’ TFP. Y. J. Zhang and Song (2022) found that export tax rebates can achieve both economic and environmental benefits for Chinese firms and have an incentive effect on technological innovation. Liang et al. (2022) detected that export tax rebates would significant influence the product quality of China’s agricultural product processing industry. Sun and Wu (2023) studied how the export value-added tax rebate impacted exporters’ product markups by taking data of China’s industrial enterprises.
China’s ETR will undoubtedly affect exports. Using varied methods and relevant data, scholars have stated its direction and effectiveness from many perspectives. C. H. Chen et al. (2006) developed a Cournot quantity competition model to detect the effect of the ETR policy on export performance in China and found that an increase in ETR would significantly influence domestic firms’ exports and foreign competitors’ output. Bao et al. (2017) detected the influence of China’s ETR policy on textile exports to USA using the difference-in-difference technique and found that the country achieved approximately 6% to 25% of growth. Tan et al. (2015) modified the model introduced by Nocke and Yeaple (2014) to detect the impact of changes in the ETR on the product scope of multi-product firms in China and found that less profitable products face larger ETR reductions. Braakmann et al. (2020) explored a difference-in-differences strategy to estimate the effects of value-added tax (VAT) rebates on exports in China and found that the pass-through of VAT rebates to importers was approximately 47%. Chandra and Long (2013) detected the impact of VAT rebates on Chinese exports using firm-level panel data, and econometric results demonstrated that the multiplier of VAT rebates on Chinese exports was 4.7, implying a comparatively strong multiplier effect. Anwar et al. (2019) empirically detected the impact of ETR on the duration of F-C-P level export spells in China using a survival analysis technique and found that a 1 percentage increase in the ETR rate would increase the duration rate of F-C-P relationships by 23.2%. D. Y. Zhang (2019) found that ETR expanded export volume and worked as an alternative financial tunnel to increase firms’ TFP in China, and the ETR improved the performance of a private firm more positively than that of a state-owned or foreign firm (D. Y. Zhang, 2021). Gourdon et al. (2022) achieved that 1% decline in the export VAT tax would lead to 7.2% relative increase in eligible export values at the city level in China. C. K. Xu and Liu (2022) detected the relationship between export tax rebates and enterprise export resilience in China by using the difference-in-difference approach, and achieved that increased by 0.027 standard deviations owning to export tax rebates.
On the impact of exports on investment, scholars pay more attention to the “going out” investment, that is, enterprises’ outwards foreign direct investment (OFDI), rather than attracting IFDI. At present, there are four typical opinions on the relationship between exports and foreign direct investment: the substitution relationship, as suggested by Wakasugi (1994), Leibovici and Waugh (2019); the complementary relationship, as in Busse (2010), Aydin (2010), and Xiong and Sun (2021); no relationship, as demonstrated by F. F. Wang et al. (2017); and the uncertain relationship with simultaneous substitution and complementary effects (X. Y. Yang & Li, 2019). However, the impact of the two effects will get different results because of differences in data, methods, and models, as suggested by Martínez et al. (2012) and Akadiri et al. (2020). However, the ETR would undoubtedly influence exports, which would obviously affect OFDI, as demonstrated by relevant literature on the relationship between exports and investments, and this might give impact on domestic investment such as private and state-owned investment. Some scholars have conducted empirical analyses of this. For example, D. Y. Zhang (2019) found that the ETR could be substituted for working capital, fixed asset investment, and R&D investment to some extent. Babich et al. (2020) characterized the timing of the investment decision of households and the optimal subsidy parameters for the government and detected practical factors favoring the feed-in tax rebate policy by taking the solar panel as an example. T. T. Xu and Ma (2021) detected differences in tariff and tax rebate regulations on investment decisions by taking the solar photovoltaic supply chain as an example.
The ETR policy is an important countermeasure to promote the development of an export-oriented economy and incentive domestic manufacturing in China. It affects not only exports but also FDI. At present, there are many literature caring about ETR’s impact on economic development or export, and export’s impact on OFDI, but scare research on the impact of the ETR on China’s inwards foreign direct investment (IFDI). Also, considering varied differences in the impact of the ETR in different scenarios, insight should be provided into the relationship between these two, and the above relevant literature would give great hint on detecting the effect of ETR on IFDI. Therefore, based on the corresponding assumptions, this study intends to empirically analyze the impact of China’s ETR on IFDI from multiple dimensions and perspectives as well as the impact of China’s trade policy on industrial development from the perspective of the ETR and IFDI.
Methods and Data
Econometric Model
There is an intrinsic relationship between investment and foreign trade scale (including export and import scales), which is directly related to the stages of economic development, as the above literature demonstrated. Therefore, these factors are included in the analysis of the impact of the ETR on foreign investment. However, the way ETR lag will significantly impact investment is uncertain, which implies that should detect the lag period according to relevant econometric detection (Sizykh, 2020; D. Y. Zhang, 2019). It is significant that many factors would influence FDI, and many scholars made relevant study about this (Contractor et al., 2021; Demirbag et al., 2007; Mahbub et al., 2022; Tian et al., 2023), so does that on IFDI (J. X. Chen et al., 2020; Imbruno et al., 2022; Wu et al., 2023). The purpose of this research is that detect the effect of ETR on IFDI, and ETR should be considered as the most important factor. At the same time, export-oriented economy requires international capital inflow simultaneously, and trade (including export and import) would indeed impose obvious impact on foreign direct investment (X. Z. Li & Park, 2016; Rakshit, 2022), therefore, export and import are chosen as controlled variables for detecting variables influencing IFDI; GDP of one region or nation is one major reason for attracting foreign direct investment (Beckmann & Czudaj, 2017), the larger GDP is, the larger IFDI would be, if there owns other same condition. Hence, to examine how the ETR affects the IFDI while considering the impact of the lag period of the ETR as well as the impact of the level of economic development, import, and export, a panel data model is established. In the model, the current period, relevant lag period of the ETR are independent variables; the level of economic development, import, and export are control variables; IFDI is a dependent variable. Simultaneously, to eliminate the influence of auto-regression comparatively, the logarithm of the above variables is taken, and the basic model is:

IFDI, ETR, ETRt-1, ETRt-2, ETRt-n, GDP, EX, and IM represent the total investment, ETR, phase I of ETR lag, phase II of ETR lag, phase n of ETR lag, level of economic development, total exports, and total imports made by foreign-invested enterprises, respectively. When the panel data model was adopted for analysis, different lag periods and appropriate control variables were selected for quantitative analysis. The measured coefficients were elastic coefficients.
Data Sources and Processing
The period selected for this study was 2004 to 2019, for reason of data collection in September 2021, and only relevant data in 2019 could be available at that time. The GDP, total exports, and total imports of each provincial region in this period were taken from the China Statistical Yearbook (2005–2020); the total investment of foreign-invested enterprises absorbed by each provincial region was taken from the Statistical Yearbook of China’s Foreign Trade and Economic Cooperation (2005–2020); the ETR of each provincial region was taken from the China Tax Yearbook (2005–2020). Relevant data processing is explained as follows:
(1) Since the GDP of most provincial regions in China has exceeded 100 billion yuan over the years, the GDP/100 billion yuan of a specific provincial region is used as an indicator to measure the level of GDP.
(2) In the Statistical Yearbook of China’s Foreign Trade and Economic Cooperation, the total exports, imports, and investments of foreign-invested enterprises are denominated in US dollars. Considering the different statistical caliber of exports and imports, the data classified by domestic destination and source of goods were adopted in the study. To convert into RMB, the relevant data of each provincial region was smoothed by the average exchange rate of RMB against the US dollar in the relevant years, and the data of the average exchange rate was derived from China Statistical Yearbook (2020). In the specific analysis, the total export/10 billion yuan and total import/10 billion yuan of specific provincial regions are used as indicators to measure exports and imports; the total investment of foreign-invested enterprises registered at the end of the year/10 billion yuan is the index to measure IFDI; the ETR/1 billion yuan is also used as an index of measurement.
(3) Some data are missing as per the above indicators, which are mainly reflected in the ETR of relevant provincial regions. The following two explanations are made: first, if one or more data points in a provincial area are missing, the simple weighted processing of the data of the previous and subsequent years will be used; second, the ETR of Shanghai from 2010 to 2019 can be located or achieved in the State Administration of Taxation and Shanghai Municipal Taxation Bureau, and its statistical caliber is significantly different from that of other years in Shanghai, which were taken from the China tax Yearbook.
(4) This paper examines how the ETR affects the investment of foreign-invested enterprises in China from the perspective of geography and the level of economic development. From a geographical perspective, the division method from China’s Environmental Statistics Yearbook (2013) was adopted. However, Liaoning in the northeast is merged with the east; Jilin and Heilongjiang are merged into the middle part. That is, the regions are divided into three, including the eastern, the middle, and the western. The eastern region includes eleven provincial regions, which is Beijing, Tianjin, Liaoning, Hebei, Shanghai, Jiangsu, Zhejiang, Fujian, Shandong, Guangdong, and Hainan respectively. There are eight provincial-level regions in the middle, which is Jilin, Heilongjiang, Shanxi, Anhui, Jiangxi, Henan, Hubei, and Hunan respectively. Twelve provincial-level regions in the western region included Inner Mongolia, Guangxi, Chongqing, Sichuan, Guizhou, Yunnan, Tibet, Shaanxi, Qinghai, Gansu, Ningxia, and Xinjiang. Taking the per capita GDP of all provincial regions in 2019 as the criterion for judgment, those with per capita GDP ranking 1 to 10 were regarded as developed regions; those with per capita GDP ranking 11 to 21 were regarded as moderately developed regions; those with per capita GDP ranking 22 to 31 were regarded as underdeveloped regions. It can be seen that the developed regions include 10 provincial regions such as Beijing, Shanghai, Jiangsu, Zhejiang, Fujian, Guangdong, Tianjin, Hubei, Chongqing, and Shandong. The moderately developed regions include eleven provincial-level regions such as Inner Mongolia, Shaanxi, Anhui, Hunan, Liaoning, Hainan, Henan, Sichuan, Xinjiang, Ningxia, and Jiangxi. The less developed regions include 10 provincial-level regions such as Qinghai, Tibet, Yunnan, Guizhou, Hebei, Shanxi, Jilin, Guangxi, Heilongjiang, and Gansu.
Research Hypotheses
Considering of analyzing the effect of ETR on IFDI, the relevant research hypotheses focus on the relationship between these two and influencing differences.
The first hypothesis attaches importance to the internal relationship between ETR and IFDI. To some extent, the adjustment of China’s ETR policy is an improvement of the traditional tax rebate policy (Song et al., 2015). In view of the implementation effect of the policy, the ETR treats the products that should have been sold abroad and domestic sales, and the domestic sales tax has been levied at the time of production. Therefore, it is necessary to return this part of the tax collected in advance in the form of a tax rebate; its actual role is to achieve fairness in the sales of domestic and foreign goods. Also, the ETR divides commodity sales into domestic and international parts to promote exports. Extensive research on the relationship between export tax rebates and exports supports this view (Anwar et al., 2019; Bao et al., 2017; D. Y. Zhang, 2021). While affecting foreign trade exports, the ETR plays a guiding role in capital flow and factor flow. The general view is that there is a complementary effect between trade and investment both in the merchandise and service sectors. Some scholars who have studied the relationship between the ETR adjustment and outwards foreign direct investment believe that they are positively correlated (Sizykh, 2020), which implies that ETR would direct influence OFDI. At the same time, there existed complementary relationship between inwards foreign direct investment and outwards foreign direct investment (Durani et al., 2021; Haddad, 2018). Hence, ETR would be positive to IFDI correspondingly. This leads to hypothesis 1: An increase in the ETR for a product is expected to be positively associated with the level of inward foreign direct investment.
The Second hypothesis cares about whether there is time lag effect of ETR on IFDI or not. ETR would influence export significant undoubtedly, and direct impact on IFDI might not exist. For example, ETR pays attention to commodities for exporting, while IFDI is some behavior dominated or implemented by foreign enterprises, which would bring IFDI invested in the local region. However, there are corresponding transmission channels or mechanisms through which the ETR impacts IFDI, such as the production of the commodity. That is, it might affect export and then affect investment based on the pull effect of “export-investment” (Dasgupta, 2022; Kim & Xin, 2021; Z. Li et al., 2023), including foreign investment of Chinese enterprises and domestic investment of foreign enterprises, which refers to OFDI and IFDI, respectively. There is a corresponding time lag in the performance of the transmission channels or mechanisms for ERT’s impact on FDI, as the basic model demonstrates. In fact, policies or countermeasures have some lag or lag effect at any condition (Z. H. J. Chen et al., 2023; Shinagawa & Tsuzuki, 2019; Y. Yang & Zhang, 2021). However, the number of periods of lag that will have a dominant effect has not been identified, which is directly related to differences in the investigated objects and changes in the socio-economic situations at domestic and abroad. Therefore, there should also be a corresponding buffer period for the impact of the ETR on the investment of foreign-invested enterprises. This leads to hypothesis 2: Increases in the ETR for a product are expected to affect the level of inward foreign direct investment with a lag.
The third hypothesis detects the influencing difference from perspectives of the geography and the development levels. As the largest developing country in the world, China is currently in the late stage of industrialization referring to post industrialization, and its multiple attributes of economic and social development are more obvious. For example, scholars believe that there exist binary structure (Fleisher et al., 1997; He & Zhang, 2022; Ma et al., 2021), ternary structure (Gu et al., 2021; L. Zhao & Zhong, 2015), and quaternary structure (Hu & Ma, 2012) respectively, which will inevitably lead to the coexistence of developed and underdeveloped regions, high and low wages, and efficient and inefficient enterprises simultaneously, and this is common phenomenon as per in the transformation process of the transition country or nation. Considering the ETR or investments of foreign-invested enterprises in different regions with different levels of economic development or different geographical locations, the attributes of diversified development could be located. Thus, the relationship between the ETR and investments would show corresponding differences as per the feature of developing differences, including that on IFDI. Among which, different region and different developing level should be considered, but these two angles might own corresponding difference. Meanwhile, we do not care about the difference as per bring out relevant hypothesis. Therefore, hypothesis 3 is proposed: The lagged impact of the ETR for a product is expected to differ by sub-national region.
Descriptive Analysis
The data of various provincial regions were summarized to form the relevant data of the eastern, the middle, and the western, the developed, the moderately developed, and the underdeveloped regions, according to corresponding treatment. To effectively understand the ETR, the investment of foreign-invested enterprises and their relative statuses were analyzed in comparison with the relative scale of relevant regions; the internal differences of relevant regions were examined with the coefficient of variation; the relative ratio of the ETR and foreign investment in relevant regions were characterized with the proportion of ETR to that of foreign investment. Considering that the descriptive analysis here only needs to reflect the basic situation of each region, only few years were selected for a brief description, with detailed results in Tables 1 to 3.
Proportion and Coefficient of Variation of Foreign Investment in Each Region.

Proportion and Dispersion Coefficient of Export Tax Rebates (ETR) in Various Regions.

Proportion of ETR in Each Region/the Proportion of Total Investment by Foreign-Invested Enterprises.

From the perspective of foreign-invested enterprises, the proportion and internal differences in different regions are more obvious. The proportion of foreign investment in the eastern region is close to or more than 80%, but it has shown a relatively obvious downward trend in recent years, which might be the reason of more comparatively balanced development in China. In terms of the overall trend, the proportion in the middle region is characterized by an increasing trend. For example, the proportion of the western region has increased rapidly from 9.08% in 2004 to 10.57% in 2019. In the western region, it increased from 6.12% in 2004 to 9.89% in 2019, with that explored over 60% within this period, and this might be directly related to the overall acceleration of China’s western economy. For example, the Strategy for the Rise of Central China and the Strategy for the Western Development are two major policies to smooth away the regional development gap in China, which would inevitable to bring more investment taken by foreign-invested enterprises. In fact, achieving comparatively balanced development is important drive for realizing the goal of Chinese Modernization, which was brought by the 20th report of the Communist Party of China.
Consideration of economic growth rate, some provincial regions such as Xinjiang, Yunnan, and Guizhou have generally ranked among the top five in China since 2016; Comparison of the coefficient of variation, the investment of foreign-invested enterprises in the middle region is higher than 2, the eastern region is higher than 1 and is basically stable, while the downward trend in the western region shows that the internal difference in attracting foreign investment in the middle region is the largest, followed by the eastern and western regions. It demonstrates the fact that economic growth rate vibrates much in China.
From the perspective of the level of economic development, the proportion of foreign-invested enterprises undertaken by developed regions has declined to some extent—for example, from 79.51% in 2004 to 75.37% in 2019. The investment of foreign-invested enterprises in moderately developed regions increased rapidly. For example, the proportion in 2019 increased by 4.12% compared with that in 2004. That is, the proportion of developed regions declined, and its ratio reduced was basically taken over by moderately developed regions. In the less developed regions, the ratio remained basically unchanged with being about 6%, and the internal differences between the developed and underdeveloped regions are relatively stable. As shown in Table 1, the data for relevant years are 1.23 to 1.36 correspondingly, but the internal difference of moderately developed regions show an expanding trend, for example, the value reached 1.33 in 2019.
From the perspective of ETR, the proportion of each region is similar to that of foreign-invested enterprises, and there are also obvious differences. See Table 2 for details where the coefficient of variation was greater than 1.5 over the years. From the perspective of the eastern, middle, and western regions, the proportion of the ETR in the eastern is more than 85%, and the internal difference is relatively small. For example, the values in 2004 and 2019 were 89.79% and 87.60%, respectively, and the dispersion coefficient was about 1.0%. The proportion of ETR in the middle region is increasing, but the internal difference is significantly larger than that in the eastern and western regions. For example, the proportion increased from 5.67% in 2004 to 8.50% in 2016. The proportion was maintained at 4% to 5%, and the internal difference showed a narrowing trend. From the perspective of the level of economic development, the proportion and internal difference of the developed regions are maintained at a steady state. For example, the proportion remains above 85%, and the coefficient of variation remains at 1.1. The proportion of moderately developed regions is generally 8% to 9%, but the dominance of internal differences is higher than that of the developed and underdeveloped regions. For example, the coefficient of variation was as high as 1.71 in 2018, which shows that the internal differences are significantly larger. Similar to the moderately developed regions, the proportion of underdeveloped regions is also basically stable, but the internal difference shows a narrowing trend and is significantly lower than that of the developed and moderately developed regions. For example, the proportion is basically 4% to 5%, and the coefficient of variation decreased from 1.06 in 2004 to 0.64 in 2016. Comparison of the perspectives of geography and the level of economic development, we could touch that the internal differences of the middle is significant larger than that of the moderately developed region, while that between the eastern region and the developing region, the western region and the underdeveloped region does not own comparative large difference respectively.
A comparison between Tables 1 and 2 shows that the regional agglomeration degree of the ETR in the eastern and developed regions is significantly higher than that of foreign-invested enterprises. For example, the relevant values in 2019 are 8.05 and 12.38% higher, respectively, and the proportion of ETR in the middle and the moderately developed region is generally lower than that of foreign-invested enterprises. Also, the relevant values in 2019 were 2.2 and 9.83 percentage points lower, respectively, and both the proportion of the ETR and the investment proportion of foreign-invested enterprises were relatively small in the western and the underdeveloped region, but the investment proportion of foreign-invested enterprises in the western region was obviously high. For example, this value reached 9.89% in 2019.
To clearly analyze the relative differences between the ETR and investments of foreign-invested enterprises in different regions, we divide the proportion of the ETR by the relative value of the proportion of the investments of foreign-invested enterprises, as shown in Table 3. If the value is greater than 1, it indicates that the ETR ability is stronger than its ability to attract foreign capital; if the value is less than 1, it indicates that a region’s ETR ability is weaker than its ability to attract foreign investment. From the actual situation of China’s economic development, the eastern region mainly belongs to the developed region; the middle region to the moderately developed region; the western region to the underdeveloped region. This view is also supported by the results of the division of the three geographical locations and the level of economic development. The ETR capacity of the eastern and developed regions is significantly stronger than that of other regions. That is, the ETR capacity of the middle, western, moderately developed, and underdeveloped regions is less than their capacity to attract foreign investment, respectively. Compared to the western region, the ETR capacity of the middle region is gradually increasing. For example, the value was 0.62 and 0.74 in 2004, respectively, but it turned to 0.79 and 0.41 in 2019, respectively—that is, the relationship between the value of the middle and the western regions has been reversed. Different from the change in relationship of the middle and western regions, the relationship between the values of the moderately developed and underdeveloped regions has not changed significantly. For example, the values in these regions were .64 and .70 in 2004 and .45 and .61 in 2019, respectively.
Econometric Results
We used E-views 7.2 as the measurement software for making econometric analysis, and the panel data model was used to analyze ETR’s impact on the investment of foreign-invested enterprises, named IFDI. The panel data model consisted of three models, which is fixed effects, random effects, and mixed estimations respectively. Since the research considered the period from 2004 to 2019 and considered the lag period as the explanatory variable, the fixed effect model was found better after testing and was adopted in the subsequent empirical analysis. Meanwhile, it was found that time lag being two periods was the optimal when detected the time lag effect. Hence, only two period’s lag was considered when making the following econometric analysis. The least-squares method was adopted in the selection of data processing. In the specific analysis, the following actions were taken: (1) to highlight the impact of the ETR on foreign investment enterprises, the influence direction and certain value of control variables were not reported; (2) if the relevant control variables were used, it demonstrated the signal of “**” when reported results; (3) the selection of control variables was not based on the difference in geographical region and the level of economic development, but on the measurement results of 31 provincial regions in China, that implied to be up to the national perspective. If the control variable failed to pass the 10% significance test, it would not be considered in the analysis of subsequent subregional differences; (4) if the control variables based on the national data passed the significance test but failed to pass it in the subregional difference test, the relevant control variables would also be used in the relevant models—there would not be further consideration of whether these control variables had passed the test or not; and (5) when measuring whether it had passed the significance test, 10% was taken as the judgment standard.
From the National Perspective
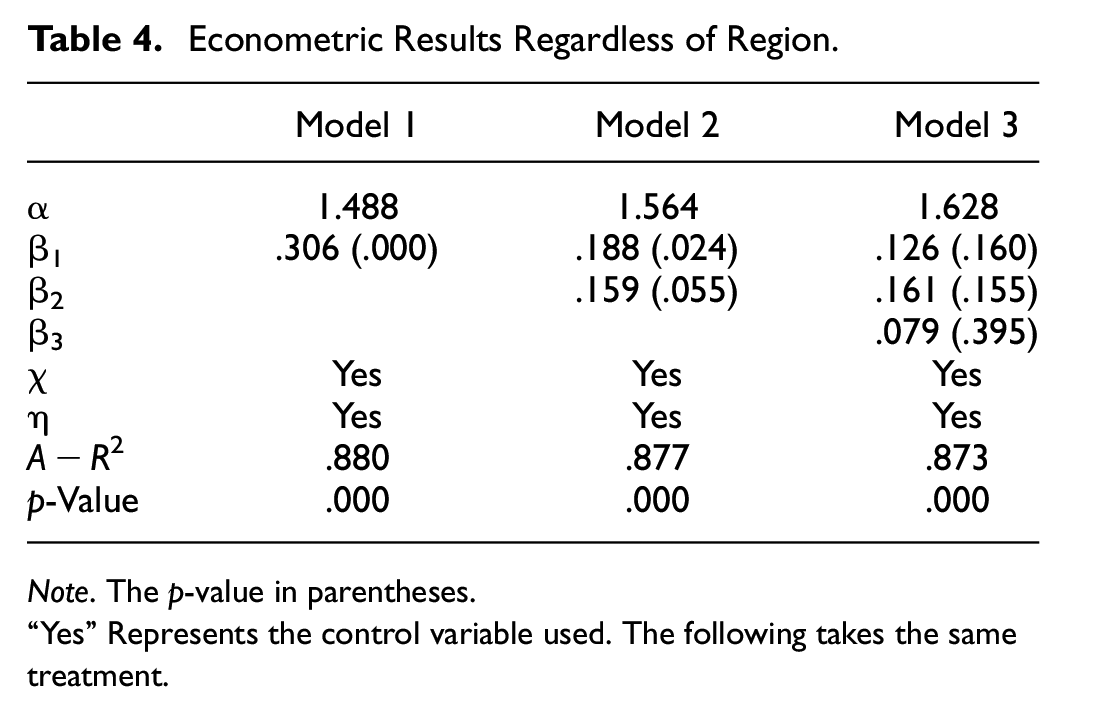
The measurement results show that whether the ETR of the current period, the current period and one lag period, or the current period plus one and two lag periods is adopted or not, the export volume index fails to pass the significance test. For example, the corresponding p-values were .786, .774, and .678, respectively. Therefore, when examining the country’s overall situation, the control variable of the export volume is excluded, and so, this variable is also excluded in the calculation models of the following two types of sub-regions. In fact, China’s ETR is directly related to the exports of enterprises; that is, a certain proportion of the rebates is based on specific export products, and there should be obvious multicollinearity and internal relationships between the two (An et al., 2017; Lee et al., 2021; Tan et al., 2015; D. Y. Zhang, 2019; T. Zhang et al., 2022), and the econometric result support this. The results of the measurements regarding non-subregional econometric results are shown in Table 4. It shows that the lagging phase II in the ETR index did not pass the significance test, and the lagging phase I in Model 2 passed the significance test of 10% but failed to pass the significance test of 5%, while the current ETR in Models 1 and 2 passed the significance test of 5%. Therefore, Model 2 can be regarded as more suitable. When the elasticity coefficients of the ETR in the early stage and the first lag period are .188 and .159, respectively, there is a complementary relationship between the current period and the lag phase of ETR and the investment amount of foreign-invested enterprises, which supports hypotheses 1 and 2.
Econometric Results Regardless of Region.
Note. The p-value in parentheses.
“Yes” Represents the control variable used. The following takes the same treatment.
From the Geographical Perspective
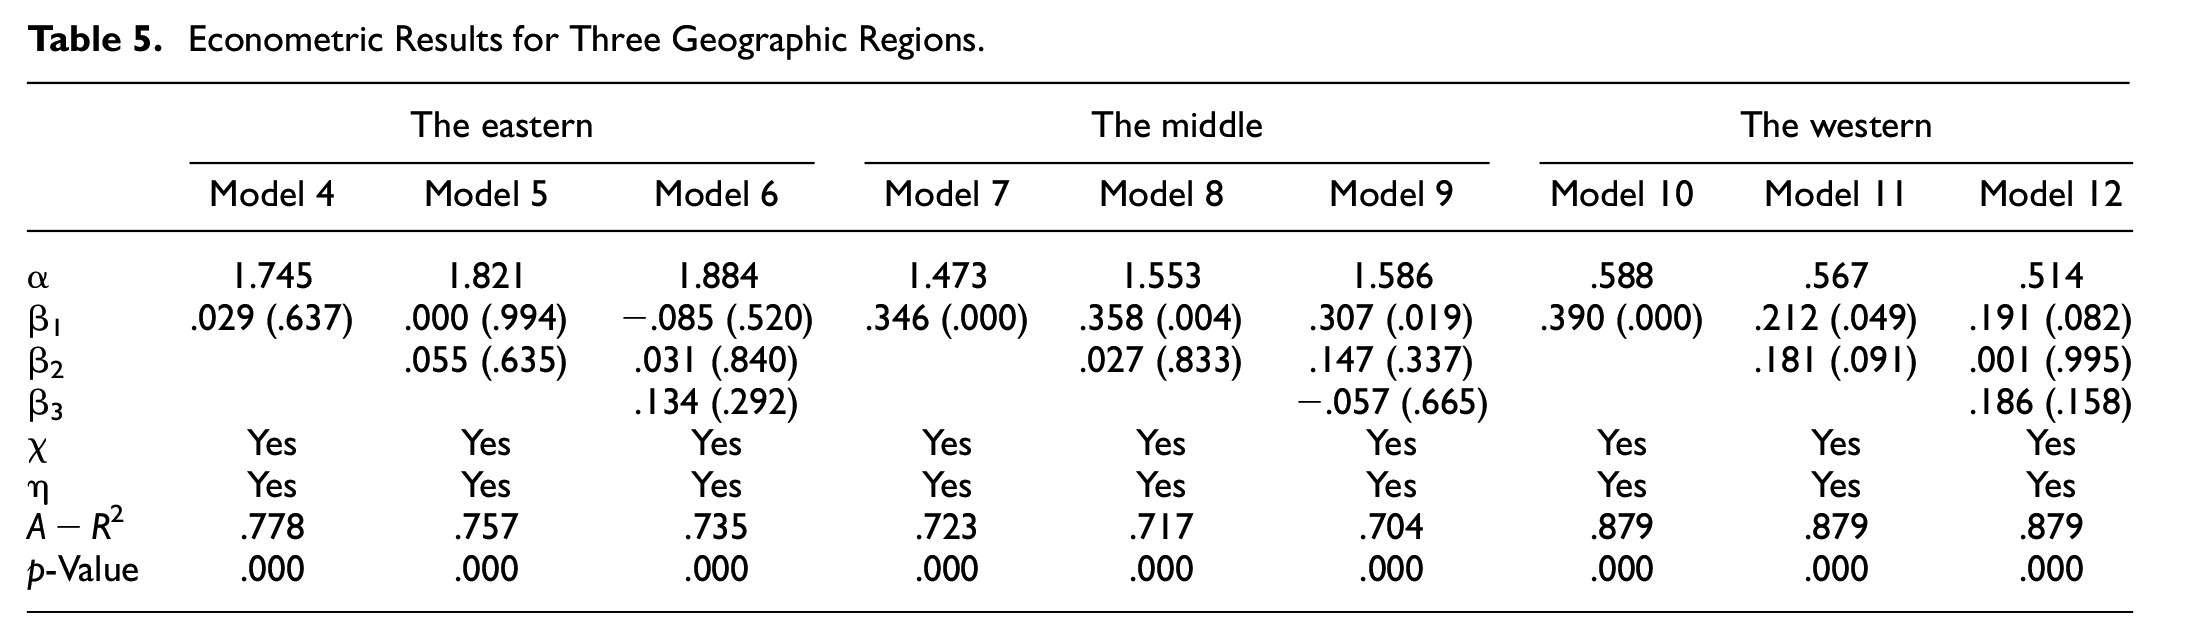
Table 5 demonstrates the econometric results for the eastern, middle, and western regions. From the perspective of the east, none of the indicators in Models 4, 5, and 6 passed the significance test. The investment of the foreign-invested enterprises in the eastern region does not bear on the ETR, which can be considered as neither a complementary nor an alternative relationship to a certain extent. As per the middle region, only the variables in Model 7 passed the significance test, and only the current period variables in Models 8 and 9 passed the significance test. Also, the ETR in the lag period is not suitable for explaining the relationship between the rebate and investment by foreign-invested enterprises in the middle region. Therefore, Model 7 was used to characterize the relationship between the two in the region. In the western region, the econometric results of each model are consistent with those in the middle. The p-value of the ETR lagged behind the first phase and is close to 10%. Based on the above setting, the model is considered to have passed the significance test. Therefore, Model 11 can be used to characterize the internal relationship between the ETR and investment of foreign-invested enterprises in the western region. The comparison shows that the impact of the ETR on the investment of foreign-invested enterprises in the middle region in the current period is greater than that in the western region. For example, the value is .212 in the western region and.346 in the middle region, but the elasticity coefficient of the ETR in the later period also reaches.181. If the two elastic coefficients in Model 11 are added, the sum can be found as greater than the elastic coefficient in the middle. In addition, compared with the overall measurement results regardless of region, the value without considering the impact of the lag is smaller than that in the middle and western regions, which should be related to the failure of the significance test of the ETR in the eastern region. The three assumptions mentioned above are consistent with hypotheses 1 and 3, and partially coincide with hypothesis 2—the ETR in different geographical regions and the investment of foreign-invested enterprises show complementary effects and obvious regional differences, and only the western region represents a certain degree of lag effect, which demonstrated significant gap as per the geographical aspect, and this in coincided with corresponding research indirectly caring about ETR’ s impact on FDI (J. X. Chen et al., 2020).
Econometric Results for Three Geographic Regions.
From the Development-Level Perspective
Based on the levels of development in the three regions defined above, the relevant data are substituted to the panel model to obtain measurement results representing different levels of development, with detailed econometric results in Table 6. From the perspective of developed regions, all the indicators of the ETR in Models 13, 14, and 15 have not passed the significance test of 10%, so the ETR in developed regions has little correlation with the investment of foreign-invested enterprises. In China’s economically developed regions, infrastructure and development ecology are relatively good. If commercial investment enterprises choose to invest in the region, more consideration should be given to obtaining dividends from economic and social development, which will form a de facto investment imbalance (C. Li et al., 2020; L. L. Liu, 2021; Qi et al., 2009), and may not have the ETR as the core consideration. From the perspective of moderately developed regions, Models 17 and 18 failed to pass the significance test for all variables, while Model 16, that is, the model considering only the current ETR, passed the test with an elasticity coefficient of .148. Therefore, there is a complementary effect between the current ETR and the investment of foreign-invested enterprises. From the perspective of underdeveloped regions, the measurement results are like those in moderately developed regions, and only the model considering the current ETR has passed the significance test, and its elasticity coefficient is greater than that of moderately developed regions. The three assumptions mentioned above are in line with Hypotheses 1 and 3, but not with Hypothesis 2—there are complementary effects and regional differences, but no lag effect.
Econometric Results of the Three Major Economic Development Level Regions.

A comparison between Table 5 and Table 6 shows a similarity between the econometric results of the eastern and developed regions, middle and moderately developed regions, and western and underdeveloped regions, which should be directly related to the main developed regions in the east, main moderately developed regions in the middle and main underdeveloped regions in the west. The lag effect of the ETR on foreign investment enterprises is weak, which is mainly reflected in the western region, and it is only one lag period, which has an explicit impact on performance.
Conclusion Remarks, Contribution, and Discussions
Conclusion Remarks
By constructing the model, this study makes a multidimensional empirical analysis of how China’s ETR affects IFDI and puts forward corresponding hypothesis by taking panel data from 2004 to 2019. Among which, current period and time lag periods of ERT are treated as major variables, and level of economic development, total exports, and total imports The results show are considered as control variables. It demonstrates that two phases of time lag is the optimal, hence, current period, phase I of ETR lag, phase II of ETR lag are the major variables for making further econometric analysis. The results support research hypothesis generally, and own relationship being complementary between the ERT and IFDI, so do there exist significant time lag effect, geographical and development levels’ differences. As per the geographical difference, hypotheses 1 and 3 could be met but partial to hypotheses 2, and appears comparatively week time lag effect as per the effect of ERT on IFDI, so do the econometric result got from the perspective of development level generally. Meanwhile, the influence of current period of ETR on IFDI demonstrated much difference caring about the direction and the corresponding value.
Contribution
This paper has main academic contributions in the following aspects. (1) To detect ETR’s effect on IFDI by taking China as a example. Many literature caring about the effect of ETR mainly made analysis from some areas such as export, economic development, OFDI, but few focused on that of IFDI. Considering of one nation, if it implements the adjustment of ERT, whether the inflow of foreign direct investment would vibrate or not should be an important problem, so it is necessary to touch the effect of ETR on IFDI. (2) To tell time lag effect of ETR on IFDI. ETR is a trade policy to some extent, and that would own time lag effect on economic and social development. Hence, there is necessary to judge that time lag effect by implementing corresponding econometric analysis. The result demonstrated that time lag effect as per ETR on IFDI were comparatively weak.
Discussions
Subject to the constraints of the research data and relevant method, there is still room for further deepening in the following three aspects.
First, what period or phase of the ETR that lags behind to be adopted is debatable. The ETR will have a direct impact on enterprise exports that will obviously affect IFDI. That is, the impact of the ETR on IFDI should have a lag process undoubtedly. Therefore, it is necessary to consider the ETR lag as a dependent variable to explore its impact on IFDI. However, in the empirical research, the lag variable is mainly proposed to verify whether there is an impact of lag. That is, it is divided into two dimensions: the current period and the lag period. The ETR variables of the current period, lag period I, and lag period II are adjusted in turn during the empirical research to weaken the selection of the optimal lag period. But, if the data lasts for a longer period, for example, from the beginning of open policy in China, that is, 1978 to 2022, the lag period might be different.
Second, the adoption of enterprise microdata can effectively examine the impact of ETR on IFDI. In the initial setting of the study, adopting the matching data from China’s industrial enterprise database and China customs database was planned; however, after careful screening, no more systematic data were found, and some indicators could not be obtained in the two databases. That is, there were data on enterprises’ foreign investment but no IFDI data. Therefore, in the construction of the model, a relative macro analysis was adopted from a regional perspective. To obtain more accurate results—the microdata of ETR and investment of foreign-invested enterprises—we should analyze the heterogeneity from the perspective of enterprises. However, this entry point is obviously different from the goal of this study—to examine the correlation between foreign-invested enterprises from the perspective of an export-oriented economy.
Third, we analyzed whether this model is appropriate from the perspective of geographical location and the level of economic development. In both ETR and IFDI, the impact of industry attributes is significant (Anwar et al., 2019; Salike, 2010). It is usually divided into labor, resource, capital, and technological intensity. There may be differences in the direction and value of the impact. However, considering that the data of subindustry attributes could not be obtained, research in this field could not be carried out in-depth. For example, from the various statistical yearbooks and bulletins published in China, we can only obtain panel data on the ETR in the subregions.
Footnotes
Declaration of Conflicting Interests
The author(s) declared no potential conflicts of interest with respect to the research, authorship, and/or publication of this article.
Funding
The author(s) disclosed receipt of the following financial support for the research, authorship, and/or publication of this article: Doctoral Research Foundation of Jiangxi Science and Technology Normal University (2019BSQD024). National Social Science Foundation of China (18AJY023).
Data Availability Statement
Data sharing not applicable to this article as no datasets were generated or analyzed during the current study.