
Abstract
As China’s export products have been pollution-intensive in recent decades, stringent environmental regulations have been applied to export products. Environmental regulation will squeeze out a firm’s expense on innovation and impact its productivity through the cost effect and innovation offset effect. However, the overall impact on productivity change is uncertain because of the trade-off between the two effects. This study explores the relationship between the innovations of export firms and environmental regulation using the panel data of export firms in 18 industrial industries. The impact of the implementation of the Law of Promoting Cleaner Production on the innovation of export firms in industries with different pollution intensities has been studied using the difference-in-differences method. The findings show that environmental regulation has a negative impact on the innovation of export firms. Export destinations create a difference in innovation performance. Environmental regulation tends to have a positive impact on the innovation of firms whose major markets are developed countries. Compared with light pollution-intensive industries, the Law of Promoting Cleaner Production has reduced the innovation ability of export firms in heavy and medium pollution-intensive industries. Therefore, when formulating environmental policies, regulators should consider the impact of such policies on the innovation of export enterprises and formulate a reasonable intensity of environmental regulations to achieve a win–win situation vis-à-vis improving the ecological environment and enhancing the innovation ability of export enterprises.
Keywords
Introduction
As China has become the world’s second largest economy and the largest trader in the past 40 years, an increasing number of scholars have begun to analyze China’s economic and trade development. The environmental cost of economic growth is an unavoidable topic in the literature. In the Outline of the Eleventh Five-Year Plan for Economic and Social Development of the People’s Republic of China published in 2005, the restriction of the export of energy-, pollution-, and resource-intensive products was proposed, while the adjustment of industrial composition in an eco-friendly direction was encouraged. In the Central Government Annual Report 2020, it is proposed that “pollution prevention and control” is a government strategy for high-quality development, and innovation is the first driving force for development that serves as a strategic support for building a modern economic system. Overall, environmental protection has been considered as one of the primary tasks for governments at all levels in China, and innovation is a vital path toward quality development.
Strengthening the intensity of environmental regulations poses a significant challenge to the exports of Chinese industrial enterprises. An increase in the intensity of environmental regulations will heighten the production costs of export enterprises, which will further affect the innovation of export enterprises. In this context, it is of great theoretical and practical significance to study the impact of environmental regulations on the innovation of export enterprises and explore whether a win–win situation of environmental and corporate innovation can be achieved.
This study examines the impact of environmental regulation on export firms’ innovation performance because current research rarely focuses on the impact of environmental regulation on innovation in export firms. Innovation performance, that is, input on patents, requires strong firm support, which may be crowded out by the pressure from environmental regulations. However, innovation has a significant impact on firm productivity and competitiveness.
Our contribution is to examine the impact of the implementation of the Law of Promoting Cleaner Production (hereinafter referred to as the LPCP) on the innovation performance of export firms in industries with different pollution intensities via a quasi-natural experiment. We focus on examining, under environmental regulation, the impact of firm heterogeneity of export destinations and the industry-based heterogeneity of pollution intensity on firm innovation. We incorporate export destinations and pollution intensity into the analysis framework to explore the relationship between environmental regulation stringency and export firms’ innovation performance. Our results show that environmental regulation has a negative impact on the innovation of export firms, and this impact is greater in high and moderate pollution-intensive industries. In addition, environmental regulation tends to have a positive impact on the innovation of firms whose major markets are developed countries. Practically, our findings will help firms undertake green transition. Our findings will also help regulators to consider the impact of environmental policies on the innovation of export enterprises when formulating such policies, and a reasonable intensity of environmental regulation is needed to achieve a win–win situation of improving the ecological environment and enhancing the innovation ability of export enterprises.
The remainder of this paper is structured as follows: Next section presents the literature review. Section “Model specification and data” focuses on the models and data description. We discuss the findings and results in Section “Empirical results,” followed by the section in which the robustness tests are presented. The major propositions and policy implications are given as a conclusion in Section “Conclusions and policy implications.”
Literature Review
Innovation on Export Firms
Coelli (2016) argues that trade liberalization has fostered technological innovation. There are two approaches toward promoting technological innovation through trading. First, trade can optimize the allocation of resources to more productive firms (Melitz, 2003), and productivity gains will further stimulate research and development (R&D) investment and technology adoption by export firms (Bustos, 2011). Second, firms can increase their links with foreign countries by participating in international markets (Grossman & Helpman, 1990).
Taylor (1993, 1994) analyzed the impact of international intellectual property protection on the innovation strategies of export enterprises under the framework of free trade, and it was found that the imitation behavior of import countries will prompt export enterprises to choose suboptimal technologies, and in this case, intellectual property protection in import countries will promote the innovation of export enterprises. Branstetter (2006) found that an improvement in the intellectual property system would increase the R&D investment of export enterprises and their income from technology transfer. Greenaway and Kneller (2007) found that the lower the uncertainty of trade policies and the greater the export behavior of enterprises, the more foreign investment enterprises will expand and more often adopt new technologies to produce better-quality products, thus improving the innovation ability of export enterprises. Handley and Limão (2013) show that the higher the uncertainty of trade policy, the lower the investment inflows of export firms, which leads to a decline in trade volumes and real consumer incomes.
The early literature on the influencing factors of corporate innovation mainly includes R&D investment, human capital, and productivity, while recent scholars are more inclined to study ownership, law, and corporate innovation policies. Research on the factors influencing the innovation of export enterprises has mainly focused on the policies, the uncertainty of trade policies, and the relevant laws and regulations of export countries. Our research interest lies in the impact of environmental regulations on export firms’ innovation.
On the Porter Hypothesis
According to Porter (1991), a well-designed environmental regulation may have sufficient positive effects to offset the negative impact from cost, thereby increasing firm productivity and global competitiveness. This view of the relationship between environmental regulation and firm performance is known as “the Porter hypothesis.” Various theoretical and empirical studies have tested this hypothesis. Jaffe and Palmer (1997) distinguished three different versions of the Porter hypothesis: narrow, weak, and strong. According to the weak Porter hypothesis, compliance costs of environmental regulation will stimulate certain types of innovation, but it cannot indicate whether the resulting innovation offset effect can compensate for the increased compliance cost. The strong version of the Porter hypothesis implies that the shock of a new regulation may induce firms to find new products or processes that comply with the regulation and increase profits, that is, well-designed environmental regulations stimulate innovation whose benefits exceed its costs.
Ample evidence supports the Porter hypothesis. Popp et al. (2011) found a positive correlation between environmental regulations, both at home and abroad, and innovation performance in the paper industry in the United States. Berman and Bui (2001) found that between 1982 and 1992, the total factor productivity of regulated enterprises increased compared to those that were not subject to environmental regulation, which showed that environmental regulation could increase the productivity of enterprises. Chakraborty and Chatterjee (2017) believe that environmental regulation stimulates the growth of innovation expenditures in the Indian leather and textile industries. Costa-Campi et al. (2017) found that environmental regulation encouraged R&D inputs in firms. Weiss and Anisimova (2019) conducted a case study of Swedish pulp and paper mills and found that a dynamic command-and-control approach to environmental regulation led to innovative compensation through improved energy efficiency. Z. Jiang et al. (2020) find that voluntary environmental information disclosure and environmental management system certification have a positive impact on corporate innovation investment. Xu (2012) believes that an increase in emission tax rates and permit prices can encourage firms’ innovation of green technologies. Qu (2015) and Zeng et al. (2016) both show that China’s industrial environmental regulations have significantly improved corporate innovation and productivity.
Many scholars have also found evidence against the Porter hypothesis. Lanoie (2011) confirms that stricter environmental regulations can promote technology R&D, but the regulation compliance cost effect is stronger than the innovation effect. Blackman and Kildegaard (2010) used environmental inspections by local environmental protection agencies in Mexico as an indicator of the intensity of environmental regulation and found that the increased intensity of environmental regulation did not encourage green technology innovation. Greenstone (2012) found that environmental regulation significantly inhibited technological innovation using manufacturing industry data from the United States from 1972 to 1993. You and Gao (2013) claim that there is a negative correlation between environmental regulation and ecological efficiency by testing China’s industry-level data. Z. Zhang et al. (2015) come to the same results using China’s province-level panel data.
Existing studies on environmental regulation and firm innovation mainly test the Porter hypothesis using industry- or regional-level data. Firm-level research in the area of trade and environment has slowly emerged since 2014 (Cherniwchan et al., 2017). Huang and Huang (2015) incorporate environmental regulation into the Melitz model and find that environmental regulation has a positive but weak correlation with firm productivity. The environmental regulatory stringency has a negative correlation with firm exports, especially for pollution-intensive firms, but overall, it presents an inverted U-shaped relationship with firms’ exports.
Most firm-level research in this area focuses on the relationship between environmental regulation and firm productivity or export firms’ eco-productivity; few studies have considered the role of export destinations in this relationship. Wang and Liu (2015) found that environmental regulation stringency encouraged firms to export to developed countries and also increased the productivity of firms that export to developing countries.
The literature mentioned above mainly focuses on the Porter hypothesis to study the impact of environmental regulation on all-enterprise innovation. However, the literature on the overall impact of environmental regulation on productivity change is uncertain due to the trade-off between the cost effect and the innovation offset effect, and this needs to be further deepened and expanded. The cost effect is one of the most fundamental impacts of environmental regulation on firms (Dension, 1981; Gollop, 1983), that is, environmental regulation increases firms’ compliance costs, thereby weakening their competitiveness. The innovation offset effect is another important impact of environmental regulation. Yu (2020) shows that environmental regulations can also improve industrial capacity utilization through the innovation offset effect, although the compliance cost effect of environmental regulations is not significant. Zhong et al. (2021) state that implementing environmental regulations will generate a compliance cost effect and innovation offset effect, but the impacts of both effects on employment differ. The compliance cost effect will promote the employment of high-skilled labor while suppressing that of low-skilled labor. The innovation offset effect, however, will facilitate employment for both high- and low-skilled labor in China.
This study examines the impact of the firm heterogeneity of export destinations and the industry heterogeneity of pollution intensity on firm innovation under environmental regulation. On the one hand, this paper continues to verify whether the Porter hypothesis is tenable; on the other hand, it improves the research on the impact of environmental regulation on the innovation of export firms and makes marginal contributions to relevant research fields.
Model Specification and Data
A reasonable environmental regulation intensity can promote enterprise innovation, and enterprises can improve their competitiveness through “innovation compensation” and “first-mover advantage.” As the intensity of environmental regulation increases, the production costs of export enterprises also increase, which puts competitive pressure on export enterprises in the international market. Meanwhile, the innovation of export enterprises can reduce the cost of pollution control and improve the international market competitiveness of export enterprises. Therefore, this mechanism encourages innovation in export enterprises. In the environmental management and production process, enterprises will reallocate resources and shift from ending governance to production process, which can enable them to achieve environmental protection goals, on the one hand, and reduce the cost of pollution control of enterprises, on the other hand. In this process, enterprises can adopt cleaner production technologies through technological innovation to improve the utilization rate of factors or product quality, which will partially or fully compensate for the cost of pollution control of enterprises and make them more competitive in the market. However, environmental regulations force enterprises to seek cleaner production technologies, which will improve the cleanliness of export products, while consumer demand for clean products is higher, and export enterprises can innovate to increase the international market share of export products. Therefore, we hypothesize that environmental regulations have a significant positive impact on the innovation of export firms.
Model Specification
According to the abovementioned hypothesis, environmental regulation will have an impact on the innovation of export enterprises. However, the magnitude of this impact is subject to the joint effect of cost and competition, and the size of the competitive effect may be affected by the main export destination of enterprises. To explore the interaction between environmental regulatory stringency and export firms’ innovation performance, we conduct the regression analysis described in equation (1). Our test selects the innovation of export enterprises as the explanatory variable; the intensity of environmental regulations, the export country, and the interaction between environmental regulation intensity and export countries as the core explanatory variables; and the total assets, sales revenue, net income, and scale of enterprises as the control variables.
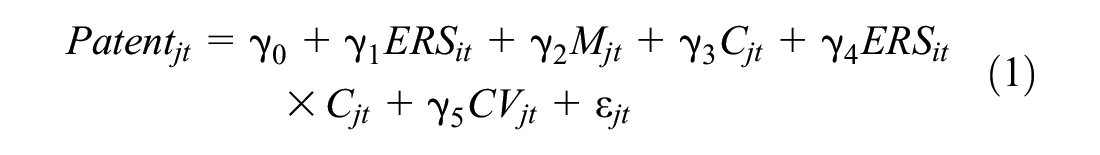
In equation (1), Patentjt represents the number of patented inventions of firm j in period t. The number of patents is used to measure a firm’s technological innovation output. According to the international patent classification, there are three types of patents: invention, utility model, and design. Compared with the other two patents, invention patents usually involve most R&D activities, higher authorization standards, and longer validation times, and are considered as the most valuable authorizations.
ERSit represents the environmental regulatory stringency of industry i in time t, and Cjt is the dummy variable of the export destination country of firm j in the period t. ERSit × Cjt represents the interaction between environmental regulatory stringency and export destination countries.
The control variable CVjt denotes a vector of variables that contribute to the change in firm j’s patents: total assets (Tassetsjt), sales revenue (Salejt), net income (Netinjt), and size (SSizejt). To a certain extent, a firm’s total assets have an impact on its R&D investment and talent employment, which in turn affects its technological innovation performance. A firm’s sales revenue is related to its profit, and thus affects its innovation investment. A firm’s net income can measure its profitability and therefore influence its R&D investment and innovation behavior. This study uses the number of employees in a firm to describe its size, as the labor force is one of the major sources of technological innovation.
Estimating the impact of environmental regulations requires devising a means of empirically measuring their stringency. Creating such a measure is often portrayed as a data collection problem. Based on this very concern, inspired by Zhao (2008) and Brunel and Levinson (2013), we develop equation (2) to estimate the environmental regulatory stringency (ERS) of industries:

ACiW is the abatement cost of wastewater in industry i, ACiG is the abatement cost of waste gas in industry i, and Oi is industry i’s output value. We only include two pollutant abatement costs—wastewater and waste gas—in the equation because of data availability.
To further examine the impact of environmental regulatory policies on export firms’ innovation performance, we employ the difference-in-differences (DID) method to test the impacts of the LPCP. The LPCP, approved at the 28th meeting of the Standing Committee of the National People’s Congress in 2002, is considered a milestone for China to transition to a more sustainable economic development mode.
We chose 2003 as an important time node as the LPCP became effective on January 1, 2003. Considering that the effect of the LPCP is asymmetric, we follow H. Liu et al.’s (2019) approach and set firms in high and moderate pollution-intensive industries as treatment groups and firms in clean industries as the control group. This approach is adopted because compared with high and moderate pollution-intensive industries, clean industries are much less affected by the LPCP.

In equation (3), j, i, and t represent firm, industry, and year, respectively. Patentjit represents the innovation output of firm j in industry i in year t, Treati can identify whether industry i is highly or moderately pollution-intensive. If industry i is a high or moderate pollution-intensive industry, it takes a value of 1. If industry i is a clean industry, it takes the value of 0. Postt is used to identify the implementation time of the LPCP. The years 2003 and hereafter are assigned a value of 1, and the years before 2003 are assigned a value of 0 (L. Jiang & Lu, 2018; H. Liu et al., 2019). Xjit is the control variable reflecting firm features, including the four control variables: total assets (Tassetsjt), sales revenue (Salejt), net income (Netinjt), and size (SSizejt). In the DID model, the control variables also include the industry’s total output value (Value) and the export destination country (C) to explore firm heterogeneity. αj and σt are the fixed effects of the firm and year, respectively.
Data
Since 2003, the Ministry of Ecology and Environment has issued 56 industry standards for cleaner production to promote the implementation of the LPCP. The first and second editions of cleaner production industry standards began to be implemented in 2003 and 2006, respectively. To avoid the influence of subsequent cleaner production industry standards’ shock on the empirical results and to match the other database, we select a testing time span from 2000 to 2006, which is in line with other studies on the LPCP (Gao & Yuan, 2020; Wan et al., 2021).
Patent data are taken from the Abstracts of the Chinese Patent Database from 2000 to 2006. There is a time lag effect between patent application and authorization, and patent application does not necessarily lead to patent authorization. Therefore, we choose the number of final patents authorized to measure a firm’s innovation performance. The data used to estimate abatement costs of wastewater and gas are obtained from the China Environmental Yearbooks from 2000 to 2006.
As there is no perfect definition for developed and developing countries, to follow Wang et al. (2015), we choose 28 Organization for Economic Co-operation and Development (OECD) countries and 16 non-OECD economies as developed export destinations. For the dummy variable of export destination country C, firms that are developed-market-focused take the value of 1, and those that are developing-market-focused take the value of 0. Each firm’s yearly export value to all destination countries is estimated by matching the China Customs Import and Export Data, Chinese Patent Database, and China Industrial Firm Database from 2000 to 2006. With the yearly export value to each destination country, we can decide whether these export firms are developing- or developed-market-focused.
The data on total assets, sales revenue, net income, and size of the firms are all derived from the matching results of the three databases of the China Industrial Firm Database, China Customs Import and Export Data, and Chinese Patent Database from 2000 to 2006. The total output value of the industry (Value) is calculated based on the industrial output value data in the China Environment Yearbooks. When matching the China Customs Import and Export Data and China Industrial Firm Database, because of the inconsistency of the firm codes, we first match the name and year of the firm, zip code, and the last seven digits of their telephone numbers, and then match the firm codes with the Chinese Patent Database, and finally, according to the industry code of the firms, we match them with their corresponding industrial environmental regulatory stringency (ERS).
To describe the industry pollution intensity, we construct the pollution intensity index for each industry. Following Zhao (2008), we group and select 18 categories of industries using data from the China Environment Yearbooks 2000 to 2006, based on the national economic industry classification and code GBT4754-2002. Equations (4) and (5) measure the pollution emissions and pollution scale, which are designed by Q. Liu et al. (2012).


Here, Eik is the emission intensity of pollutant k (k=1,2,3…n) in industry i (i=1,2,…j), Pik represents the emissions of pollutant k in industry i, Oi represents the industrial output value of industry i, and Sik indicates the scale of pollution emissions from industry i of pollutant k. We then normalize Eik and Sik in equations (6) and (7):


Based on the normalized pollution emission and pollution scale in equations (6) and (7), we construct equation (8) to illustrate the industry pollution intensity index:

Ai is the pollution intensity index of industry i. Industries with a pollution intensity index greater than 0.05 are considered high pollution-intensive industries or dirty industries, and those with an index between 0.01 and 0.05 are moderate pollution-intensive industries, while industries with an index lower than 0.01 are low pollution-intensive industries or clean industries. Table 1 reports the Chinese industry pollution intensity indexes from 2000 to 2006. Five pollutants—industrial wastewater, industrial solid waste, dust, smoke, and sulfur dioxide—are used to calculate the indexes.
Industry Pollution Intensity Levels.

Descriptive Statistics
As shown in Table 2, from 2000 to 2006, the average number of export firms’ invention patents (Patents) was 7.3983, the maximum number of patents of export firms was 4,094, and the minimum value was 0. The average environmental regulatory stringency (ERS) value from 2000 to 2006 was 3.9239, the maximum was 25.1061, and the minimum was 0.8264. From 2000 to 2006, the average value of the company’s total assets (Tassets) was 1,426,509 (in Yuan), the average value of the company’s sales revenue (Sale) was 1,383,081 (in Yuan), the average value of the company’s net income (Netin) was 138,921 (in Yuan), and the average value of the company’s size (Ssize) was 2,133.
Descriptive Statistics.
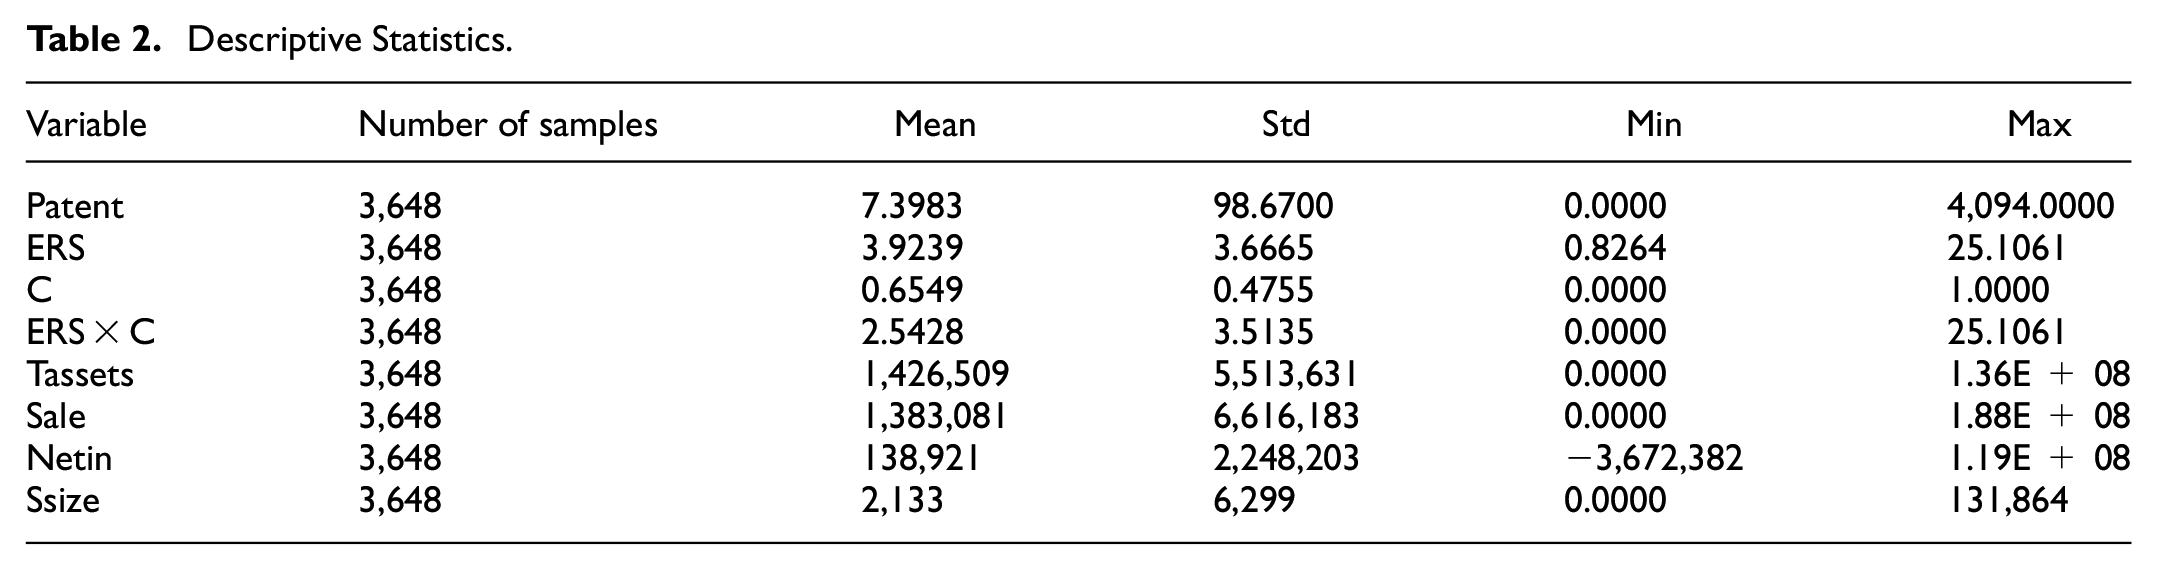
Figure 1 depicts the changes in the environmental regulatory stringency values of industries with different pollution intensities from 2000 to 2006. During this period, the stringency of environmental regulations in high pollution-intensive industries showed a very similar trend, as shown in Figure 1. It went up from 2000 to 2002, continued to decrease until 2005, and then increased. The moderate pollution-intensive industries followed the trend of high pollution-intensive industries, except that the stringency was quite stable from 2001 to 2002. The stringency of environmental regulations in low-pollution-intensive industries remained relatively stable. The environmental regulatory stringency became stronger as the industries became more pollution-intensive.

The stringency of environmental regulations of industries with different pollution intensity levels from 2000 to 2006.
Notwithstanding their limitations, patent data have become one of the most popular measurements of innovation performance over the past 20 years. As Figure 2 shows, from 2000 to 2006, the total number of invention patents from Chinese industrial export firms increased from 390 to 10,461 in 2006.

Total invention patents of export firms from Chinese industries (2000–2006).
Empirical Results
Environmental Regulatory Stringency, Export Destination, and Patent
Table 3 reports the baseline results. In Columns 1, 3, and 4, the coefficients of environmental regulatory stringency (ERS) and export destination country (C) are all significantly negative, and the interactions (ERS × C) of the stringency of environmental regulations and export destination countries are significantly positive. This showed that, generally speaking, the stringency of environmental regulation discouraged the innovation of export firms, but for developed-market-focused firms, the increased environmental regulatory stringency was a push to their innovation output. The total assets (Tassets) are significantly positive in Columns 2 and 3, while positive but not significant in Column 4. In Column 4, the firm’s sales revenue (Sale) has a significant positive relationship with patent, the firm’s net income (Netin) is significantly negatively related to the patent, and the firm size (Ssize) exhibits a negative but non-significant relationship with the patent.
Basic Regression Results.

Note. The t-statistics are in parentheses.
, **, and * represent significance levels of 1%, 5%, and 10%, respectively.
DID Regression Results
Table 4 summarizes the regression results of the double-difference method used to study the impact of the environmental regulation policy, the LPCP, on export firms’ innovation performance. All models control for both individual and time effects. Except for Column 4, the interaction of Treat × Post shows a significantly negative relationship with the dependent variable, which indicates that the implementation of the LPCP has a significant negative impact on the innovation output of export firms in high and moderate pollution-intensive industries. Compared to clean industries, the implementation of the LPCP has weakened the innovation performance of export firms in high and moderate pollution-intensive industries. In Columns 2–5, the coefficient of export destination country (C) is negative but not significant, while that of corporate total assets (Tassets) is positive but not significant. Although the coefficients of sales and net income are significant, they are small and close to zero, while the coefficient of firm size (Ssize) is significantly positive. The effect of the industry’s total output value (Value) is significantly positive in Columns 2 and 4 but negative and insignificant in Column 5.
DID Regression Results.

Note. The t-statistics are in parentheses.
, **, and * represent significance levels of 1%, 5%, and 10%, respectively.
Effects Test
The main effects of environmental regulation on the innovation behavior of export firms are the cost and innovation offset effects. On the one hand, the stricter the environmental regulations, the higher the cost of environmental compliance. With financial restraint in the short term, increased abatement expenditure will crowd out R&D and innovation investment, which will reduce the firm’s innovation activities and weaken its innovation performance. The cost effect of environmental regulatory stringency will inhibit the innovation of export firms. On the other hand, under the pressure of international competition, the shock of a new regulation may induce firms to find new products or processes that comply with the regulation and increase profits. In other words, the innovation offset effect will lead to innovation that could offset the compliance and abatement costs, and even create more profit. These two effects cancel each other out, and the final result depends on the market structure and stage of economic development. When the cost effect is greater than the innovation offset effect, the increase in the stringency of environmental regulation will discourage the innovation activities in export firms; however, when the cost effect is weaker than the innovation offset effect, more stringent environmental regulations will lead to better innovation performance in export firms.
We use the production cost as an intermediary variable and construct intermediary effect models to test these effects. Equation (9) is the total effect equation and equation (10) examines the intermediary effect.


In equation (11), ERSit represents the environmental regulatory stringency of industry i in time t, and Cjt is the dummy variable of the export destination country of firm j in period t, while ERSit × Cjt represents the interaction between environmental regulatory stringency and export destination countries. The control variable CVjt denotes a vector of variables that contribute to the change in firm j’s patents in period t: total assets (Tassetsjt), sales revenue (Salejt), net income (Netinjt), and size (SSizejt). Mjt is an intermediary variable for firm j in period t, and it is the production cost of firm j at time t.
The regression results in Table 5 show that environmental regulation has a significant impact on the innovation performance of export firms, which can be tested using the intermediary effect. After using the intermediary variable (Mjt), the test for equation (10) shows that the environmental regulation coefficient is positive but not significant, and the regression coefficient of the production cost is significantly negative. This shows that the intermediary effect of cost has a complete intermediary effect, and an increase in the stringency of environmental regulation will increase the production cost of the firm, which, in turn, will discourage the innovation activities in export firms.
Effects Test Results.

Note. The t-statistics are in parentheses.
, **, and * represent significance levels of 1%, 5%, and 10%, respectively.
Robustness Tests
Replacing Key Variables
We consider a different measurement of environmental regulatory stringency for the robustness test. Following C. Zhang et al. (2011), we replace the industrial output value with the industrial added value in the calculation of environmental regulatory stringency in Equation (2). The industrial output value in 1999 is considered as the base period. The number of patents of exporting firms (Patent), the stringency of industry environmental regulation (ERS), the main export destination country of the firm (C), and the interaction between environmental regulatory stringency and the export destination country of the firm (ERI × C) are used in the test. The specific robustness test regression results are presented in Table 6. After using different environmental regulatory stringency indicators, the coefficients of environmental regulation (ERS), export country (C), and the interaction term of environmental regulation stringency and export country (ERS × C) remain unchanged, indicating that the regression results are robust.
Robust Regression Results.

Note. The t-statistics are in parentheses.
, **, and * represent significance levels of 1%, 5%, and 10%, respectively.
Parallel Trend Test
To test the applicability of the DID model in this study, we conduct a parallel trend test, that is, to check whether there is a difference in the innovation changes of the export firm samples of the treatment and control groups before the implementation of the LPCP. If such a difference exists between these two groups of samples before and after the implementation of the LPCP, it cannot be established that the policy effect estimated by the model is due to the LPCP. The model is given by equation (12):

Here, Yeart is the dummy variable for the year, βt and γ are the parameters to be estimated. The results of the parallel trend test are presented in Table 7. Taking 2003 as the time node, the coefficients of Treati × Year00, Treati × Year01, and Treati × Year02 are not significant, whereas the coefficients of Treati × Year04, Treati × Year05, and Treati × Year06 are significantly negative. Therefore, there is no change in innovation performance in the year-to-year difference between the treatment and control groups before the implementation of the LPCP. The model passes the parallel trend test.
Parallel Trend Test Results.

Note. The t-statistics are in parentheses.
, **, and * represent significance levels of 1%, 5%, and 10%, respectively.
DID Test of Different Policies
Between 2000 and 2006, many environmental laws and regulations have been promulgated, which may have caused multiple policy time nodes in the previous model. We take 2001, 2002, 2004, and 2005 as policy time nodes in equation (1), that is, using Treati × Post01, Treati × Post02, Treati × Post04, and Treati × Post05 for regression.
The regression results in Table 8 show that the Treati × Post01 coefficient results are not significant, whereas the Treati × Post02, Treati × Post04, and Treati × Post05 coefficients are all significantly negative. This shows that 2002, 2004, and 2005 may also be the policy time nodes for generating DID results, which means that there are multiple DID periods. However, the prerequisite for using the DID method is the parallel trend test. From the previous parallel trend test, it was evident that before 2003, the change in patent authorization in the high and moderate pollution-intensive industries followed the same trend as in the low pollution-intensive industry but became different after 2003. The three time nodes of 2002, 2004, and 2005 do not satisfy the parallel trend test.
Multi-Policy DID Test Results.

Note. The t-statistics are in parentheses.
, **, and * represent significance levels of 1%, 5%, and 10%, respectively.
Conclusions and Policy Implications
China was in middle industrialization when heavy and chemical industries were booming from 2000 to 2006. Exports began to take off after China’s accession to the World Trade Organization. Meanwhile, the pollution from the export firms strated to get more attention by the society.
For the past few decades, studies on environmental regulation and firm innovation have mainly tested the Porter hypothesis using industry- or regional-level data. Most firm-level research in this area focuses on the relationship between environmental regulation and firm productivity or export firms’ eco-productivity, and merely a few studies have considered the role of export destinations in this relationship. This study analyzes the relationship between the stringency of environmental regulations and export firm innovation performance using panel data from 18 major industries in China’s Industrial Firms Database and China Customs Import and Export Database from 2000 to 2006. This complements the related literature by exploring the heterogeneity of firms and industries during the process. The DID method was used to further study the impact of the implementation of the LPCP on the innovation performance of export firms in industries with different pollution levels.
The study finds that the impact of environmental regulation on the innovation of export firms is affected by the cost and innovation offset effects. During the period tested in our research, the impact of environmental regulation on the innovation performance of export firms is negative. This was because China was in the stage of industrialization of the heavy chemical industry from 2000 to 2006, while the competition method of export enterprises was still relatively extensive.
For firms that mainly exported to developed countries, environmental regulations showed a positive relationship with export firms’ innovation. This is because quality competition in developed markets is fiercer than that in developing markets, where cost competition matters more. Developed countries demand cleaner products. Although China’s environmental factors are relatively abundant, export firms are more sensitive to international market competition than to the domestic price changes of environmental costs. In other words, for export firms that were developed-market-focused, the effect of innovation offsets was greater than the cost effect, and environmental regulation promoted the innovation performance of such export firms. Owing to cost competition in developing markets, the cost effect is more significant for developing-market-focused firms.
From the perspective of industry heterogeneity, the implementation of the LPCP has weakened the innovation performance of export firms in high and moderate pollution-intensive industries. This may be due to the increased stringency of environmental regulations following the implementation of the LPCP. The compliance and abatement costs in moderately and highly pollution-intensive industries increased relatively faster than in clean industries, as it was more likely for the costs to crowd out investment that may be available for innovative input in export firms. In this case, the cost effect seems to triumph over the innovation offset effect.
From our tests, we find that the main mechanisms of action of environmental regulations affecting the innovation of export firms are the cost and competition effects. On the one hand, an increase in environmental regulation intensity will increase the production cost of enterprises, which will inhibit the innovation of export enterprises, and environmental regulation will affect enterprise innovation through the cost effect. On the other hand, due to the increase in the intensity of environmental regulation, the production cost of enterprises increases, and the international competitive pressure faced by export enterprises in the export market increases, which forces export enterprises to compensate for the cost of environmental regulation by improving productivity through innovation.
In terms of policy implications, we suggest that regulators consider industry and firm heterogeneity when formulating environmental regulations, trade policies, and industrial innovation policies. An increase in the intensity of environmental regulations will generally inhibit innovation by export firms, while for those that are mainly exported to developed countries, an increase in the intensity of environmental regulations will promote innovation. Therefore, when formulating environmental regulatory policies, the heterogeneity of export enterprises should be considered, and different environmental regulatory policies should be formulated for enterprises with different export destination markets. Unreasonable environmental regulatory policies will inhibit the innovation of export enterprises, while reasonable environmental regulatory policies will engender a win–win situation between environmental protection and the innovation of export enterprises.
There are differences in the impacts of environmental regulatory policies on different polluting industries. The impact of environmental regulation on pollution-intensive industries may be greater. Therefore, when formulating environmental regulatory policies, the government should consider the differences in the intensity of pollution in the industry and formulate environmental regulatory policies accordingly.
Furthermore, a large part of the inhibition effect of environmental regulation on the innovation of export enterprises ensues from the rise in production costs of export enterprises brought about by environmental regulation, which has squeezed out the R&D investment of export enterprises. Therefore, the government should consider formulating a corresponding innovation system and giving innovative enterprises a certain amount of innovation subsidies or tax rebates so that export enterprises can increase their innovation investment.
Footnotes
Declaration of Conflicting Interests
The author(s) declared no potential conflicts of interest with respect to the research, authorship, and/or publication of this article.
Funding
The author(s) disclosed receipt of the following financial support for the research, authorship, and/or publication of this article: Teaching Research Project of Provincial Universities in Hubei Province, China. Project number: 2020244. Funded research project by Science and Technology Department of Jiangxi Province, China. Project number: 2021BAA10020.
Data Sharing Statement
The data that support the findings of this study are available from the corresponding author upon reasonable request.