
Abstract
Japan is widely regarded as one of the world’s most developed nations. The country’s electronics industry, in particular, is consistently ranked among the global leaders in innovatiion. Industries such as automotive, construction, electronics, metal, and telecommunications, companies have traditionally leaned more heavily on debt financing for both their day-to-day operations and investment endeavors, rather than relying on equity financing. In Japan, debt financing is favored as cost-effective source of capital compared to equity financing. The study selected 257 automotive, construction, electronic, metal, and telecommunications companies between 2000 and 2021. To find the effect of financial leverage on financial performance, the study used the random effect and the GMM to estimate the effect of the firms’ leverage on financial performance. The study found that interest coverage has a positive and statistically significant effect on ROA, ROE, and Tobin’s Q. The study discovered that cash coverage has a positive and statistically significant effect on ROE. The study found that debt service obligations have a negative and statistically significant effect on financial performance.
Keywords
Introduction
Financial leverage entails companies borrowing money to support their operational activities. Debt financing offers numerous benefits for corporate operations, such as a stable interest rate, enhanced financial maneuverability, and tax deductions (Santos et al., 2023). The appropriate level of debt a company employs to establish an optimal capital structure significantly impacts its financial performance (Akhtar et al., 2021). Also, the traditional capital structure encourages firms to use debt in their capital structure to a specific limit because the use of debt leads to better business performance. Additionally, using debt exposes a company to significant risk because failure to make debt payments results in the transfer of ownership from shareholders to bondholders or creditors (Sahminan, 2021). Therefore, it has become important to study the impact of debt on the financial performance of firms to enable various stakeholders to understand how debt impacts financial performance.
According to Krasnow (1993), using domestic stock issuance as a form of equity financing is a viable option for Japanese companies. Equity financing is an important management tool that can be used to increase shareholders’ equity and get money to invest in the company’s growth and value creation. Common equity financing strategies in Japan include going public, third-party allotments, and rights offer (Kim & Song, 2020). As stated by Hoshi and Kashyap (2004), if a Japanese firm needs debt financing, it typically engages in collaboration with the Japanese government, other domestic firms, and Japanese banks. Japanese businesses have a strong dependence on bank loans to fulfill their operational and capital expenditure requirements (Nobanee et al., 2011). There are three primary categories of loans and banks arrangements in Japan: loans provided by the Bank of Japan to commercial banks, short-term loans extended by commercial banks, and long-term loans from long-term credit banks (Krasnow, 1993). Japanese companies utilize domestic corporate bonds issuances as a means of securing debt financing for Japanese companies. Corporate debt can be broadly categorized into two main types: Straight bonds and convertible bonds.
According to Brealey et al. (2018), the pecking order theory encourages businesses to prioritize their sources of financing by putting internally generated funding first, debt financing second, and equity financing third. Japanese companies have used debt financing, which is easier and cheaper than equity financing (Hoshi et al., 1989; Weinstein & Yafeh, 1998), more than equity financing in the past. Debt financing offered several advantages compared to equity financing, such as tax benefits associated with interest payment and the predictability of fixed monthly interest and principal payment(Frydenberg, 2011; Glen & Pinto, 1994). In line with MM Proposition II, an increase in corporate debt financing leads to a reduction in the weighted average cost of capital (WACC), providing additional rationale for Japanese firms’ preference for debt financing over equity financing (Michalak, 2016). However, no limits are placed on the proportion of debt that can be included in a company’s capital structure. MM Proposition I, a company’s value is unaffected by whether or not it receives funding from a combination of debt and equity (Robichek & Myers, 1966). Whether a company relies more heavily on equity financing or debt financing is a matter left to the discretion of its shareholders and management. The advantages of debt financing make it more beneficial for businesses to use it. However, the more corporations increase their debt in their capital structure, the more they may be unable to make their loan payments and eventually go bankrupt.
There is an inherent risk risk of financial loss associated with debt financing. A significant source of financial risk arises the lack of cash flow needed to meet debt service requirements is a major source of financial risk (Vanacker & Manigart, 2010). If a company has financial difficulties, it cannot pay its debts (Ferris & Lawless, 1999). When a company’s per-unit profits are low, its breakeven point is high, or its sales are vulnerable to economic downturns, it may be highly leveraged, increasing the likelihood of being unable to honor its debt obligations. Before financial institutions approve any debt financing for a business corporation, they must assess its ability to honor the debt obligation. The coverage ratio determines whether a business can pay back its debts. The interest coverage ratio determines if a company can make enough earnings to pay the interest on its debts. The debt service obligation determines if the business corporation can make enough earnings to pay the interest and principal on the debt. Companies pay their debt obligations using their assets and immediate cash.
Numerous studies have investigated the effect of the firm’s financial leverage on financial performance (Akhtar et al., 2021; Ibrahim & Isiaka, 2020; Iqbal & Usman, 2018; Kenn-Ndubuisi & Joel, 2019). Many of these studies employed various proxies for financial leverage, such as the long-term debt-to-total assets ratio, the total debt-to-total assets ratio, the long-term debt-to-capitalization ratio, and the total debt-to-capitalization ratio. These proxies have been utilized to evaluate how financial leverage influences a company’s financial performance. Using these variables to evaluate the impact of financial performance may not offer a comprehensive understanding of how debt financing influence financial outcomes, as they do not account for the methods a corporation intends to employ to fulfill its obligations or assess whether its earnings will suffice for this purpose. The manner in which debt financing is repaid significantly affects financial performance. Coverage ratios serve as a valuable tool for gauging a firm’s capacity to meet its debt obligations through debt financing. There has been a limited number of studies exploring the the application of coverage ratios to assess business risk by determining its ability to service its debt and the subsequent effects of these ratios on financial performance. Also, corporations rely on assets and cash to meet their debt obligations. Therefore, understanding the influence of cash and asset coverage on financial performance can instill confidence in investors and creditors. It assures them that their investments in the corporation or the corporation’s debt financing contribute positively to its performance and enhance its ability to meet debt obligations (Omollo et al., 2020).
This study sought to address these key questions:Firstly, how do asset and cash coverage ratios impactfinancial performance? Secondly, can the use of interest coverage and debt service obligations as indicators of firms’ ability to meet debt obligations shed light on the corporation’s financial performance? Thirdly, to what extent does the economic policy in Japan influence the financial performance of the corporations listed on the Tokyo Stock Exchange? Furthermore, did the COVID-19 pandemic impact the financial performance of these corporations, and lastly, did the global economic policy uncertainty affect the corporation’s financial performance?
The study contributes to the literature in the following ways: Firstly, the study depends on the pecking order theory, which advises firms to consider debt financing as their second priority when choosing or selecting the financial source of obtaining funding to finance business activities, to investigate the effect of financial leverage on financial performance. Secondly, the study used the coverage ratios to assess the ability of the firms to pay off their debt from their earnings and how the coverage ratios affect financial performance, using firms listed in the Tokyo stock market as a sample size. Thirdly, the study contributes to the literature by finding the effect of the COVID-19 pandemic on the financial performance of firms listed in five sectors of the Tokyo Stock Exchange. Moreover, the study found the effect of economic policy uncertainty in Japan and global economic policy uncertainty on financial performance. Furthermore, the study found a moderating effect of the coverage ratio on financial performance.
Literature Reviews and Hypothesis Development
Debt Capital Markets in Japan
Before beginning to solicit investors to purchase debt securities, corporations in Japan are generally required to file a securities registration statement to engage in a public offering of debt securities (Kelley, 1990). Before purchasing debt securities, investors must receive a copy of the prospectus. The Financial Instruments and Exchange Act (FIEA) of Japan places limitations on a variety of transactions that have the potential to undermine the integrity of the country’s financial markets. Insider trading and market manipulation are the two broad categories that these regulations fall under.
The FIEA and related regulations provide several requirements for securities businesses, including those registered with the FIEA as financial instrument business operators, due to the essential role securities firms play in the market. Bonds issued by the Japanese government and conventional bonds make up the majority of the country’s marketable debt securities (McCauley & Remolona, 2000). A public offering is used for transactions when securities are distributed to individual retail investors. When stocks are distributed to professional investors, a public offering or a private placement may be utilized, depending on the particular circumstances and the adherence to specified regulations. It is normal to use shelf registrations concerning the public issue of corporate bonds. In that instance, the issuer will submit a preliminary shelf registration statement to the relevant local finance bureau and provide ongoing disclosure about the issuer and its corporate group. The issuer will subsequently submit a supplement to the shelf registration statement when it is time to issue the securities. On the other hand, when it comes to private placements, debt securities are only made available to a select group of institutional investors or a small group of accredited individual investors. In this particular instance, a shelf registration or a declaration on securities registration is not necessary (subject to certain conditions under the FIEA).
The issuance of bonds alone is the most common method of bond financing, while trust structures are only sometimes employed. Unusual CBOs (collateralized bond obligations) include trust beneficiary rights backed by a pool of many different types of bonds, including one that may be called a garbage bond. Hoshi and Kashyap (2004) and Petry et al. (2023) report that most Japanese debt transactions occur outside the regulated markets of securities exchanges. Japan has always relied on bank loan financing. Hence, the country’s public debt capital markets have expanded more slowly than its public equity capital markets. That is typical of Japan, which relies heavily on bank loans for financing.
Most Japanese debt instruments are traded on the Tokyo Stock Exchange (TSE). This market operates independently from the OTC market. There are fewer debt securities listed on the TSE than equity instruments. The Japanese government and convertible bonds are among the instruments traded on the TSE (Greiner et al., 2002; Mollemans, 2002). The Financial Services Agency of Japan (FSA) regulates the debt securities markets in Japan. The FSA’s regional finance office oversees the bulk of this work. The TSE oversees the debt securities market and regulates listed securities. The Financial Institutions and Exchange Act primarily governs the debt securities markets. The exchange’s rules bind all securities listed on the Toronto Stock Exchange.
Financial Leverage
Leverage in the financial markets occurs when a borrower uses borrowed funds to purchase an asset, expecting a larger return than the cost of the loan itself (Adenugba et al., 2016). Therefore, financial leverage is an investment strategy that promotes business expansion and growth. Financial leverage is borrowing debt to expand one’s asset base. Leverage is a way to get a higher rate of return on money that has been invested (Demiraj et al., 2023). There is a higher chance of failure if too much financial leverage is used, as servicing the loan becomes more challenging. The financial leverage formula is a valuable indicator of a company’s borrowing capacity as a ratio of total debt to total assets. The debt-to-assets ratio is a standard indicator of financial leverage. Financial leverage is beneficial when interest payments are less than the profits from the debt’s utilization (Nissim & Penman, 2003). Instead of selling new shares of stock to raise money, many companies use financial leverage, which can lower the value of each current shareholder’s stake (Ghosh & Jain, 2000). Debt financing makes the most sense when stable cash flow is expected. This makes it much easier to budget for debt repayment. Cash flow stability is typical in markets with few competitors, considerable entry barriers, and few game-changing product innovations.
There are two main benefits to using financial leverage. It can improve a company’s profit margin (Js Ramalho & da Silva, 2009). Second, interest is tax deductible in many tax systems, lowering the borrower’s debt cost (Cole, 2017). However, financial leverage also carries the risk of disproportionate losses, as the resulting interest expense can be prohibitive if the borrower cannot generate adequate returns to cover it. This becomes a severe issue when interest rates increase, or asset returns fall. A similar dilemma faces an investor considering taking on debt to boost his or her purchase of assets. An investor could lose all of their money if the security’s market price drops and the lender demands repayment of the lent funds.
Financial Performance
How well a company can profit from its primary business activity is a gauge of its financial performance (Gofwan, 2022). The financial performance of a company over a specific time period can be seen as a broad indicator of its overall financial health. Trade creditors, bondholders, investors, employees, and management are all stakeholders interested in the business. All of these stakeholders keep an eye on the company’s bottom line. Its financial performance shows how well a company makes money and uses its resources to meet the needs of its investors and other stakeholders (Man & Wong, 2013). There are a number of indicators that can be used to assess the financial health of a business. Cash flow from operations, operating income, and other similar metrics can all be employed. The number of units sold could also be used (Griffin & Mahajan, 2019). The analyst or investor also wishes to dig further into the financial statement to find information that leads to higher profits or declining debt.
Hypotheses Development
Asset Coverage Ratio
The asset coverage of a company can indicate its financial health. The ratio quantifies how well an organization can pay its obligations (Okunev, 2022). Asset coverage ratios provide helpful insight into a company’s capacity to meet its financial obligations to creditors, investors, and analysts (Ogachi et al., 2020). Lending organizations and creditors look for a minimum asset coverage ratio when choosing whether or not to extend credit. Creditors and investors can gauge the safety of their investments in a company by comparing the asset coverage ratio to the debt-to-equity ratio (Nini et al., 2009). Once the coverage ratio is calculated, industry averages can be compared. When seeking financing, companies that issue stock or equity have a moral or legal obligation to return the funds they raise. When a business issues bonds or takes out a loan to pay for its operations, it must pay back the principal plus interest to its investors (Christie et al., 2021).
Therefore, debt holders such as banks and investors are concerned with whether or not a company is making enough money to pay off its debts and what will happen if earnings fall short of projections. One example of a solvency ratio is the asset coverage ratio. Asset coverage determines whether or not a corporation has sufficient assets to satisfy its current short-term debt obligations. Even if a company is not making enough money to pay its debts, a high asset ratio reassures a creditor that it will be repaid (Hernandez-Canovas & Martinez-Solano, 2006). The frequency with which a company’s income can cover its debt is measured using asset coverage. A company with a high asset coverage ratio can pay off its debt quickly. According to the research of Alessi et al. (2022), businesses with a higher asset coverage ratio are safer than those with a lower ratio. If the company’s earnings are insufficient to meet its financial commitments, it may be forced to liquidate some or all of its assets to raise the necessary capital. Creditors and investors commonly look at a company’s asset coverage ratio to see how reliably its assets cover its debt. Asset coverage determines if the company’s earnings are insufficient to cover its debts.
H1: Asset coverage has a statistically significant effect on financial performance.
Cash Coverage Ratio
A company’s liquidity and ability to meet its debt commitments using cash on hand can be evaluated using the cash coverage ratio (Berrada, 2022). The cash coverage ratio is a way to determine if a company has enough cash flow to pay its interest payments. The cash ratio measures a company’s liquidity, determining how quickly it can pay its current liabilities using cash (Faruk & Habib, 2010). Due to its stricter nature, many creditors check the cash ratio rather than the current or quick ratio (Ertugrul & Karakasoglu, 2009). This is because only cash may be utilized to pay off current debt. Investors care about a company’s solvency since they have debts to pay. The creditor also likes it if inventories and accounts receivable are not included in the cash ratio calculation because these assets are not always reliable for paying off debt. Collecting receivables could take a few weeks, whereas selling stock could take months or years.
The cash coverage ratio is the ratio of the available cash to the interest that needs to be paid. It gives organizations a fundamental notion of how their businesses will pay off their obligations, which is helpful. When a company calculates its cash coverage ratio, it can see where there are gaps in its operations and where there is potential for improvement. Most of the time, the shareholders use these ratios to predict how the company’s finances will be in the future.
H2: Cash coverage has a statistically significant effect on financial performance.
Interest Coverage Ratio
A company’s ability to make interest payments on bank loans is evaluated using a ratio known as the interest coverage ratio (Strahan, 1999). It is also sometimes referred to as interest earned over time. The ratio determines how often a company’s operating income can cover the interest costs on its debts. This information is used to make financial decisions. The interest coverage ratio measures a company’s ability to meet its interest payments out of earnings generated by the business. It indicates how much of a buffer the company has available to pay its interest expenses, which are a fixed obligation. The ratio can proxy the company’s ability to meet its interest obligations and remain in operation. The fact that the rating reflects the company’s capacity to meet its repayments gives rise to the significance of interest coverage in assessing a firm’s creditworthiness (S. Kim et al., 2013). The company must generate sufficient revenue to cover its interest payments. Companies are more likely to be able to meet their obligations if their interest coverage ratio is high (Palomino et al., 2019; Suhaila & Wan Mahmood, 2008). The business’s profitability, level of gearing, and cost of borrowings all play a role in determining whether or not the company can meet its interest expenses. When it comes to companies with an inherently low-profit margin level, a high-interest burden may negatively affect their rating. This high-interest burden could result from a high gearing level, a high cost of financing, or both of these factors.
H3: Interest coverage has a statistically significant effect on financial performance.
Debt Service Coverage Ratio
A company’s ability to meet its debts with operating cash flow is measured by the debt service coverage ratio (Delele, 2021; Okunev, 2022). The payment covers both the interest and the principle of the loan. When a corporation obtains a loan from a bank or other financial organization that provides loans, the computation is performed at the time of acquisition. The debt service coverage ratio (DSCR) is a crucial measure of a company’s financial health, accounting for interest payments, principal payments, and dividend payments (Firouzi & Meshkani, 2021). The debt service coverage ratio indicates a company’s financial health (Toton, 2002). Bankers and investors extensively use it to assess a company’s creditworthiness and prospects because it helps analyze its potential to finance future expansion. Lenders look to the ratio as a primary indicator of whether a company can fulfill its interest and principal payment obligations (Yenni et al., 2021).
Shareholders, potential investors, and buyers of a firm use the ratio to gauge the company’s financial health and dividend prospects before deciding whether to purchase the business. It displays the amount of money that is available for shareholders or investors. Companies can use the ratio to assess their capacity for expansion and their potential to secure further funding. If all the money were to go toward repaying the firm’s debt, there would be no funds left for the company to reinvest. If the DSCR calculation exceeds 1, it suggests there is just enough operational revenue to pay the annual debt obligations. In contrast, less than one calculation indicates that there may be possible concerns with solvency (Vishwanath, 2009).
H4: Debt service obligations have a statistically significant effect on financial performance.
Debt-to-Equity Ratio
As a measure of leverage, the debt-to-equity ratio looks at how much debt and financial liabilities equal how much equity shareholders have invested in a corporation (Ofulue et al., 2022). This ratio shows how much debt versus equity financing is in a company’s capital structure. Companies that are stable and generate substantial cash flow benefit from a high debt-equity ratio (Dirman, 2020), while a declining company should aim for a lower ratio (Dirman, 2020). However, when the ratio decreases, it indicates that the company is using less leverage and moving closer to being entirely equity-financed. A high debt-to-equity ratio might be beneficial if the company can pay its debts on time and leverage to increase equity returns. A high debt-to-equity ratio indicates that a firm may struggle to repay its debts in the event of a fall in business performance.
When the D/E ratio is high, the business is more precarious. Companies that are just getting started or businesses that want to expand rapidly may have a higher D/E ratio. However, they may also have more potential upside if everything goes according to plan. The debt-to-equity ratio is a standard that investors refer to when evaluating the risk associated with an investment (Witkowska et al., 2019). D/E is very important for a company when that company employs creditor financing. Lenders and investors generally prefer that a company maintain a low debt-to-equity ratio. However, a low debt-to-equity ratio might signal that the company may need to leverage its assets more adequately, limiting its profitability.
H5: Debt to equity has a statistically significant effect on financial performance.
Methodology
Sample and Data
The study focused on non-financial institutions listed on the Tokyo stock market, encompassing diverse sectors such as automobile, construction, electronic, metal, and telecommunications companies. Japan, chosen as the study’s backdrop, merits attention as one of the world’s most advanced nations. Its prominence extends from its sizable and highly educated labor force to its extensive consumer market (Rodrik, 2014). Notably, the bedrock of Japan’s economic prowess lies in manufacturing (Johnson, 1982).
Within the domain of manufacturing, Japanese firms have honed their strengths globally, spanning optical and precision equipment, electrical and electronic goods, machinery tools, automobiles, ships, chemicals, and food and agricultural products (Dore, 2013; Farrell, 2008 ). These enterprises play a vital role in Japan’s economic landscape by employing its citizens, contributing to national tax revenue, and attracting foreign capital (Posen, 1998). Some established and emerging businesses in Japan have grown in recent years due to globalization and intense competition (Zysman, 1996). Japanese companies are very active in expanding overseas for several reasons, such as taking advantage of global demand, making products that fit the needs of specific markets, and taking advantage of economies of scale (Castley, 2016; Ohno, 2016). The expansion allows firms to increase their presence at their overseas bases. While some companies could finance their expansions internally, most looked to outside sources. To finance their growth and expansion, Japanese corporations rely on equity and debt financing (Chang, 2003; Jarallah et al., 2019).
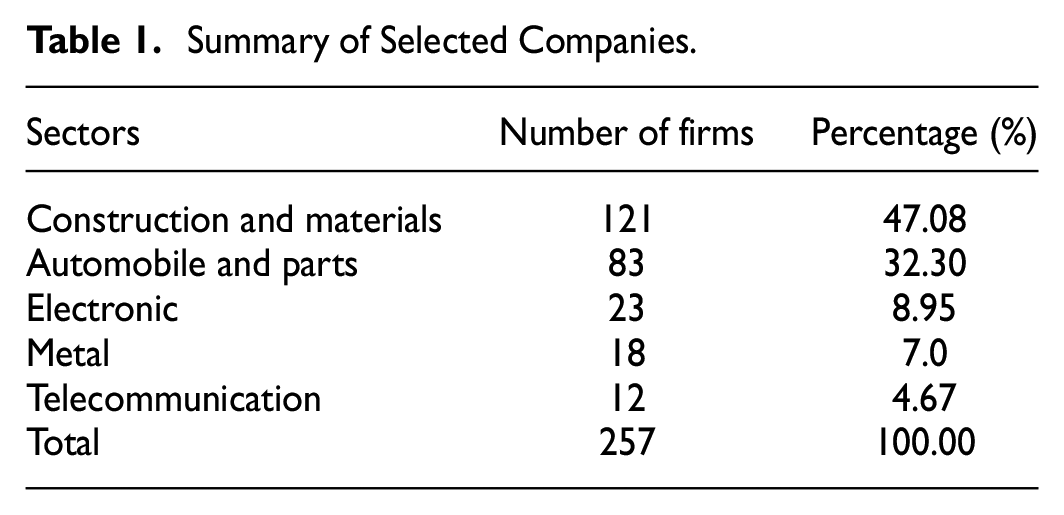
We sourced our data from Thomson Reuters Eikon DataStream, a reputable data provider widely utilized for similar research purposes (Amin & Cek, 2023; Arhinful & Radmehr, 2023; Mensah & Bein, 2023). Data from DataStream is renowned for its reliability and accuracy. For our study, we examined data from 257 companies operating in various sectors including automotive and parts, construction and materials, electronic, metal, and telecommunications. Our dataset spans a substantial period, encompassing the years from 2000 to 2022, amounting to 22 years and yielding a total of 5,654 firm-years of observations. To ensure a representative sample, we employed the purposive sampling method, as not all firms had data available in Thomson Reuters Eikon for the entire 22-year period.
Our selection comprised 121 companies from the construction and materials sectors, 83 firms from the automobile and parts sectors, 23 from the electronic sector, 18 from the metal sector, and 12 from the telecommunications sector. It is essential to note that our study relied solely on secondary data sourced from publicly available annual reports of the selected companies. As our research did not involve the study of human subjects, we did not seek Institutional Review Board (IRB) approval. Table 1 provides a detailed overview of the companies and their corresponding data.
Summary of Selected Companies.
Variables (Dependent, Dependent, and Control Variables)
Dependent Variables
The study used three dependent variables as proxies for financial performance. The first dependent variable was the return on assets (ROA). ROA reveals to shareholders how efficiently a business turns its assets into net capital (Bansal, 2014), making it a crucial metric for any organization. As a result, the higher the percentage of ROA, the better it is for the business’s management. When a company’s return on assets (ROA) index is poor, it could be due to a number of factors (Alexopoulos et al., 2018). Managers can use this metric to assess internal performance and spot where the company’s investments may be lacking so that they can be improved. The ROA was calculated as net profit after tax/total assets × 100.
The second dependent variable was return on equity (ROE). ROE is a profitability indicator used to calculate the return on shareholders’ investment in a company (Wahjudi, 2019). It demonstrates the efficiency with which shareholders’ funds have been used. ROE is determined by dividing net income by total equity. The company’s low ROE means the shareholders’ funds could be better used. ROE is a vital indicator of a company’s success. A higher value indicates that the company effectively turns fresh investment into profit. Before investing, investors look at the ROE of various companies in the market.
The final dependent variable was Tobin’s Q. Tobin’s Q ratio calculates a company’s worth by dividing its total assets by market value (Tahir & Razali, 2011). The market value of a company should be equal to its replacement cost, according to Tobin’s Q ratio. Tobin’s Q ratio assesses how close an asset’s current market price is to its replacement price. Tobin’s Q ratio describes how market value compares to the actual value of an asset. This ratio makes it simple to determine whether a company, sector, or market is priced appropriately (Setyawan, 2011). It also quantifies the gap between a company’s replacement cost and market value. The stock of a corporation is considered overvalued if its market price exceeds the cost of replacing the company’s assets. When a company’s or market’s Tobin’s Q ratio is greater than one, the market is considered overvalued.
Independent Variables
The study used five independent variables, which are proxies for financial leverage. The variables measure the leverage of the firm. The variables were cash coverage, asset coverage, interest coverage, debt service obligation, and debt-to-equity ratio. The cash coverage, assets coverage, interest coverage, and debt service obligation were outliers, and we used the winsor2 command in Stata to Winsor them at their 10th and 90th quantiles. The variables and their definitions are summarized in Table 2.
Variable and Measurements.

Controlling Variables
The firm’s size was obtained by logging total assets, and its age is the number of years the firm has been on the stock market since its year of incorporation. The COVID-19 pandemic is a dummy; the financial reports reported by the firms during the COVID-19 pandemic were used as a base. If the corporation reported a financial report during the pandemic outbreak, it was marked “1” and otherwise marked “0.” The COVID-19 pandemic affects financial performance (Santos et al., 2023). Economic policy uncertainty for Japan and global economic policy uncertainty are macroeconomic variables that reflect financial, price, and economic stability and can also affect the financial performance of firms.
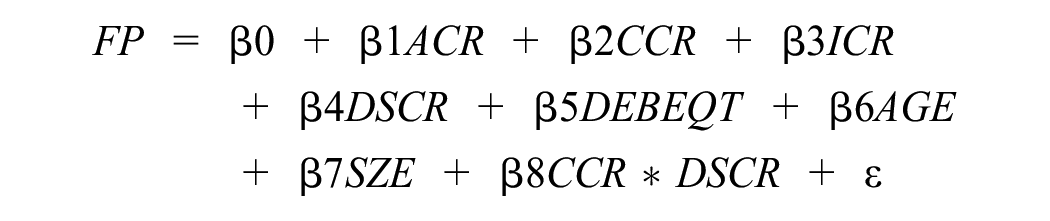
Model Specification
We used eight model models to find the effect of financial leverage on financial performance and tests for the hypotheses formulated.
Model 1

Model 2

Model 3

Model 4

Model 5

Model 6
Model 7

Model 8

Where “FP” is the financial performance, which is ROA, ROE, and Tobin’s Q. “ACR” denotes asset coverage ratio, “CCR” denotes cash coverage ratio, “ICR” denotes interest coverage ratio, “DSCR” denotes debt service obligation, “DEBEQT” denotes debt to equity ratio, “AGE” denotes the ages of the firm, “SZE” denotes the size of the firm, “COVD19” denotes the COVID-19 pandemic, “EPUJ” denotes economic policy uncertainty for Japan, “GEPU” denotes global economic policy uncertainty, and “ã” denotes an error term.
Estimation Method
We employed both the random and the fixed effect models to estimate the effect of financial leverage on financial performance. To ensure the robustness of our findings, we conducted Hausman specification tests, which allowed us to determine the consistency of the results
The results from the Hausman specification tests show that the random effect model is inconsistent under the alternative hypothesis (p > .05) but efficient under the null hypothesis. Therefore, our results were discussed based on the random effect models. We also dealt with the endogeneity problem using the robust two-step Generalized Method of Moments (GMM). We chose two-step over one-step GMM because the one-step GMM subtracts the current value from the past, and it will result in a problem if some of the values are missing (Roodman, 2009). The two-step robust GMM, instead of subtracting the current values from the past values, instead found the average of the future available observations and subtracted it from the past values, which gives efficient results (Roodman, 2009).
Empirical Results and Discussions
Table 3 shows the descriptive statistics for all the variables (dependent, independent, and control variables). The dependent variables are used as proxies for the firm’s financial performance in Japan: ROA, ROE, and Tobin’s Q. The average return on using the corporation’s assets was 2.311%, while the average return on using shareholder equity was 5.204%. The average TOB was 0.036, indicating that the firms are undervalued (Humphery-Jenner, 2014; Vuong, 2022). The ACR was 1.472, meaning the firm can use its assets to pay off its debt since it is greater than 1. The CCR was 1.506. The results for the average CCR show that the firm could use its available cash to pay off its debt obligations. The average ICR shows that the firm can make enough earnings to pay off the interest component of its debt. The average DSCR shows that the company does not earn enough to pay the interest and principal on its debt financing.
Descriptive Statistics.

The average DEBEQT ratio shows that the firm is highly leveraged; it uses more debt in its capital structure than equity (Welch, 2011). Each firm’s average age was 64 years old, and the average size of the firm was 7.773. Out of the total firm observations of 5,654, of which the firms report their annual financial reports for 22 years, 769 years of the observations were for the period where the firms reported the annual report during the COVID-19 pandemic, which is 0.136; the average EPUJ was 102.94%, and the average GEPU was 136.64%.
Table 4 presents the outcomes of the matrix correlation analysis, a critical step in examining the assumptions of multiple regression analysis. One fundamental assumptions is that the independent and controlling variables should not exhibit strong correlation. To rigorously assess and mitigate the issue of multicollinearity, our study employed both matrix correlation analysis and the Variance Inflation Factor (VIF). The findings stemming from the correlation analysis reveal that the financial leverage variables do not exhibit strong correlations, as evidenced by coefficients between these variables not exceeding the threshold of 0.80. This aligns with the findings of prior studies (Arhinful et al., 2023; Detthamrong et al., 2017; Elshabasy, 2018).
Matrix of Correlations.

Moreover, we scrutinized the VIF results, as illustrated in Table 5 for each variable. Importantly, none of the VIF values surpassed the critical threshold of 10, consistent with the guidelines outlined by J. H. Kim (2019) and Senaviratna and Cooray (2019). The results confirmed that the dataset is not suffering from the problem of multicollinearity.
Variance Inflation Factor.

Table 6 shows the results for the cross-sectional dependence. We also used a method Pesaran (2015) proposed for dependent cross-sectional tests. The alternative hypothesis for all the variables is accepted, indicating the presence of cross-sectional dependence among the variables.
Cross Sectional Dependence Test.

Table 7 shows the results of the random effect estimation. The study used the random effect estimation method to find the effect of financial leverage, the COVID-19 pandemic, EPUJ, and GEPU on ROA. The study relied on the Hausman specification tests to see which results for the random and fixed effect models were consistent. The results from the Hausman specification tests show that the random effect estimation is inconsistent under the alternative hypothesis but efficient under the null hypothesis (p > .05).
The Effect of Financial Leverage on Financial Performance (ROA).

p < .01. **p < .05. *p < .1.
In terms of specific findings, the study revealed that ACR exerts a negative and statistically insignificant effect on ROA. This suggest that increasing the ACR of the firms is associated with a decrease on ROA, signaling potential financial distress, in line with the findings of Kuncoro & Agustina (2017) and Mesak & Imade (2019). On the other hand, the study found that the CCR has a positive and statistically significant impact on ROA, consistent with the research by Rehman et al. (2015) and supporting Miller and Orr’s (1966) trade-off theory, which emphasizes the optimization of cash holdings to balance the benefits and costs of maintaining liquid assets. Businesses use cash to finance initiatives if alternative funding is unavailable or expensive (Stulz, 2000). The results imply that higher CCR is linked with increased ROA.
Additionally, the study found that the ICR has a positive and significant effect on ROA, aligning with prior research by Ong and Phing Phing (2012) and Enekwe et al. (2014). This suggests that firms utilizing external debt financing are better positioned to meet interest obligations and enhance their performance (Aziz & Abbas, 2019; Pham & Nguyen, 2020). The findings support M&M proposition II: as a firm increases its debt, its financial performance improves (Miller, 1995). The study found that DSCR has a negative and statistically significant effect on ROA. According to Jensen (2019), a firm must be able to pay off its debt and provide a good return to equity owners. After the firm pays off all its debt, nothing remains for the equity owners, which would create an agency problem (DeAngelo & DeAngelo, 2007). The results of DSCR indicate that the excessive use of debt poses a risk to the firm as they may struggle to repay it, potentially leading to a loss of ownership to creditors (Hansmann & Kraakman, 2000).
Furthermore, the DEBEQT ratio exhibited a positive and significant effect on the ROA of Japanese firms consistent with previous research by Amanda (2019), Hertina and Saudi (2019), and Hertina (2021). This implies that an increase in the DEBEQT is associated with higher ROA. The study also identified a negative and statistically significant impact of COVID-19 pandemic on ROA, supporting previous studies (Jin et al., 2022; Katusiime, 2021; Rahmi & Sumirat, 2021). The results show that EPUJ has a negative and statistically insignificant effect on ROA, which matches previous studies’ findings (Akron et al., 2020; Demir & Ersan, 2017; García-Gómez et al., 2022). Conversely GEPU has a positive and statistically significant effect on ROA, and the results align with a study by Quddus et al. (2022) but contradict the findings by W. Li et al. (2022). The results imply that the improvement in GEPU will result in a positive ROA for the firms. The moderating effect of DSCR on the relationship between ACR, CCR, and ICR shows a negative and statistically significant effect on ROA.
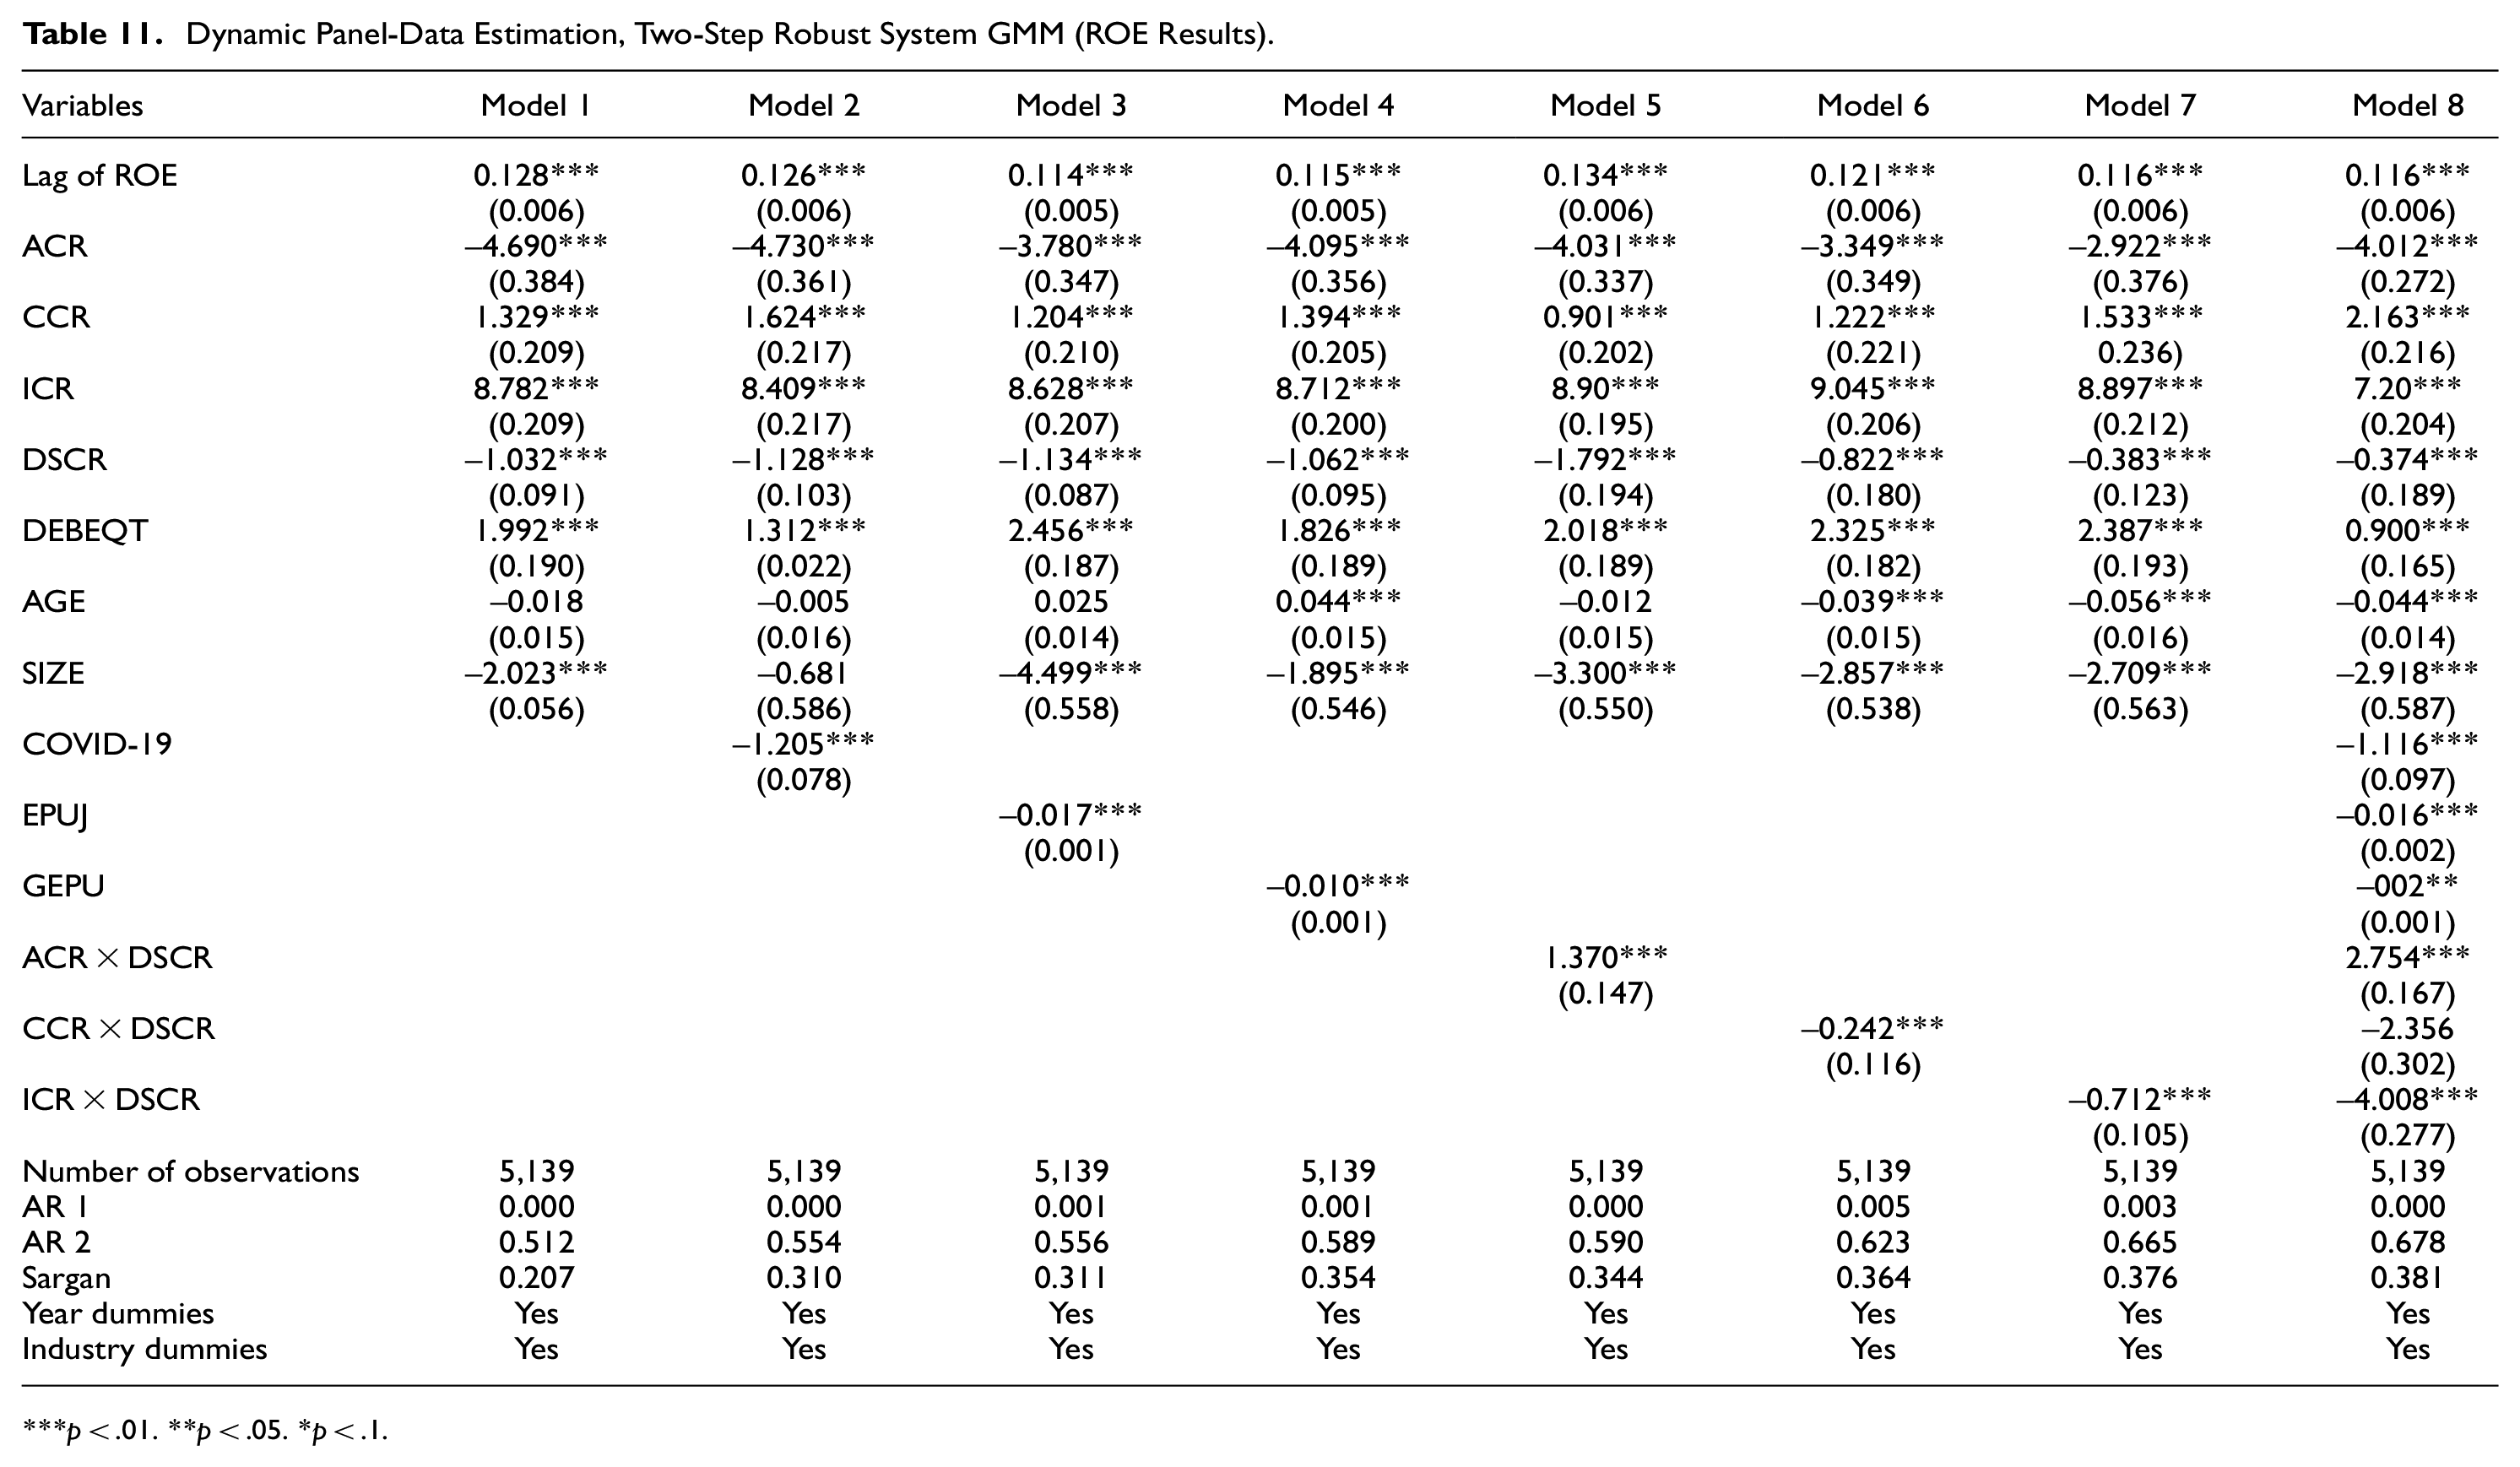
Table 8 provides an overview of the impact of financial leverage, the COVID-19 pandemic, EPUJ, and GEPU on ROE. The study revealed several noteworthy findings. Firstly, ACR exhibited a negative and statistically significant effect on ROE. This negative impact aligns with the arguments put forth by Han Kim et al(1979) and Salehi et al (2017), suggesting that an aversion to debt arises due to the increased likelihood of bankruptcy and the associated costs. Consequently, an increase in ACR is associated with a decrease in ROE, consistent with the findings of Restianti and Agustina (2018).
The Effect of Financial Leverage on Financial Performance (ROE).

p < .01. **p < .05. *p < .1.
Secondly, the results unveiled a negative and statistically significant effect of CCR on ROE, indicating that an increase in the CCR of the firms leads to a decrease in ROE. This outcome contracts with the findings of Amahalu and Beatrice (2017), who suggested that holding cash for business activities positively impacts ROE. Thirdly, ICR was found to exert a positive and statistically significant effect on ROE, consistent with prior research (Ayoush et al., 2021; Capraru & Ihnatov, 2014; Kirimi et al., 2017). This implies that firms using external debt financing are well-positioned to meet their interest obligations and enhance their ROE.
Fourthly, DSCR had a negative and significant effect on ROE, indicating that the firms with higher leverage are under constant pressure to repay debt, and have an elevated likelihood of defaulting on their obligations. This scenario may lead to panic or even a disruption in the financial market, in line with the perspectives ofBean (2010) and Holmstrom (2015). The study also examined the DEBEQT ratio’s impact on ROE, revealing a positive and statistically insignificant, consistent with the findings by Efendi et al. (2019) and Marito and Sjarif (2020). This suggests that an increase in DEBEQT has the potential to enhance ROE if the firm chooses to leverage it further.
Moreover, the study found that COVID-19 pandemic had a negative and statistically insignificant effect on ROE, consistent with previous research by Amnim et al. (2021) and Jin et al.(2022). EPUJ displayed a negative and statistically significant effect on ROE, commensurate with the previous studies’ findings (García-Gómez et al., 2022; Iqbal et al., 2020). On the other hand, GEPU had a positive and statistically significant effect on ROE, suggesting that if GEPU is improved, it will lead to better ROE for the firms. The study’s findings that GEPU has a positive and statistically significant impact on ROE support the results of Matousek et al. (2020) and Athari (2021). The moderating effect of DSCR on the relationship between ACR, CCR, and ICR shows a negative and statistically significant effect on ROE.
Table 9 presents the effect of financial leverage, the COVID-19 pandemic, EPUJ, and GEPU on Tobin’s Q. Firstly, the study found that ACR has a positive and statistically significant effect on Tobin’s Q. An increase in the firm’s ACR by 1%, results in a higher Tobin’s Q of 0.006%, indicating that a higher cash reserve contributes to greater firm value.
The Effect of Financial Leverage on Financial Performance (Tobin’s Q).

p < .01. **p < .05. *p < .1.
Secondly, CCR exhibited a negative and statistically significant effect on Tobin’s Q. When the firm increases its CCR by 1%, Tobin’s Q experiences a decline of 0.011%. This implies that holding excess cash for business activities may not be conducive to enhancing firm value, in contrast to the positive impact on ROE.
Thirdly,ICR demonstrated a positive and statistically significant effect on Tobin’s Q. Thispositive relationship is attributed to the availability of funds after servicing debt interest, which can be used to acquire additional assets, thereby expanding the firm’s earnings base (Miller, 1988; Myers, 2001). A 1% increase in ICR by the firm contributes to a 0.011% rise in Tobin’s Q.
Moreover, DSCR had a positive and statistically significant effect on Tobin’s Q, indicating that firms with stronger debt service capabilities tend to have higher Tobin’s Q values, reflecting their higher market value relative to book value. This aligns with the notion that well-managed debt can be value-enhancing for a company. On the other hand, DEBEQT exhibited a negative and statistically significant effect on Tobin’s Q, consistent with the findings of Setiyawati et al. (2018) and Ibrahim and Isiaka (2020). This suggests that an increase in the DEBEQT ratio is associated with a decrease in Tobin’s Q, implying that excessive equity financing may not always lead to higher firm value.
Regarding the external factors, the study found that the COVID-19 pandemic had a negative and statistically insignificant impact on Tobin’s Q, aligning with prior research (Bose et al., 2021; Phang et al., 2023). Similarly, EPUJ displayeda negative and statistically significant effect on Tobin’s Q, consistent with findings by Iqbal et al. (2020) and Suh and Yang (2021). This implies that elevated economic policy uncertainty in Japan negatively influences Tobin’s Q.
Lastly, GEPU was found to have a negative and statistically significant effect on Tobin’s Q, in line with the findings of Suh and Yang (2021). This indicates that improvements in GEPU could lead to a higher Tobin’s Q for firms. The moderating effect of DSCR on the relationship between ACR, CCR, and ICR showed a negative and statistically significant effect on Tobin’s Q, suggesting that DSCR can influence how these liquidity and financing metrics relate to Tobin’s Q.
Dealing With Endogeneity
One of the primary concerns in our analysis pertains to addressing the issue of endogeneity among the explanatory variables. Failing to adequately address this with endogeneity problem can lead to biased estimations within our regression model (J. Li et al., 2021; Zaefarian et al., 2017). Our aim in tackling the endogeneity problem was to render the independent variables exogenous by introducing lags to those variables previously considered endogenous (Ullah et al., 2021). In the existing literature, both internal and external instruments have been employed to mitigate the problem of endogeneity. In our study, we applied the robust two-step GMM to address this concern. The GMM facilitates the identification of endogenous variables and employs instrumental variables to transform them into exogenous variables through the introduction of lags.Furthermore, the GMM methodology is effective in dealing with issues such endogeneity, heteroskedasticity, and autocorrection problems (Le & Tran, 2021; Nguyen et al., 2021).
Our GMM results, presented in Tables 10 to 12, are robust and corroborate our main findings outlined in Tables 7 to 9. The study used AR (2) and Sargan tests to check the validity of the GMM model. The null hypothesis for AR (2) test suggests the absence of autocorrelation and the statistically insignificant results for the Sargan tests underscores the validity of our GMM findings. Consequently, we can confidently assert that our GMM model results are valid.
Dynamic Panel-Data Estimation, Two-Step Robust System GMM (ROA Results).

p < .01. **p < .05. *p < .1.
Dynamic Panel-Data Estimation, Two-Step Robust System GMM (ROE Results).
p < .01. **p < .05. *p < .1.
Dynamic Panel-Data Estimation, Two-Step Robust System GMM (Tobin’s Results).

p < .01. **p < .05. *p < .1.
The results show that our results for the GMM model are valid.Examining Table 10, our analysis reveals that the dynamic panel, representing the lag of ROA, exhibits a positive and statistically significant impact on ROA. The outcomes in Table 11 indicate that the dynamic panel, representing the lag of ROE, similarly exerts a positive and statistically significant influence on ROE. Lastly, the results presented in Table 12 highlight that the dynamic panel, representing the lag of Tobin’s Q, also displays a positive and statistically significant impact on Tobin’s Q.
Conclusions
The primary objectives of this study was to investigate the effect of financial leverage on the financial performance of firms listed in the Tokyo stock market. Our sample consisted of 257 companies from the automotive, construction, electronic, metal, and telecommunications sectors during the period spanning from 2000 to 2021. To assess the effect of financial leverage on financial performance, we employed both the random effect model and the GMM to estimate the effect of leverage on various financial performance indicators. The study used three dependent variables: ROA, ROE, and Tobin’s Q. The study used five independent variables: CCR, ACR, ICR, DSCR, and the DEBEQT ratio. In addition, we included five control variables: the size of the firms, age, the COVID-19 pandemic, EPUJ, and GEPU.
Our findings revealed that CCR and ICR exerted a positive and statistically significant effect on ROA, whereas ACR exhibited a negative and statistically insignificant effect on ROA. In terms of ROE, we observed that ACR, CCR, and DSCR had a negative and statistically significant influence, while ICR had a positive and statistically significant impact. Regarding Tobin’s Q, ACR, ICR, and DSCR demonstrated a positive and statistically significant effect, while CCR and DEBEQT had a negative and statistically significant impact.
Furthermore, our analysis indicated that the COVID-19 pandemic had a detrimental effect on ROA, ROE, and Tobin’s Q. EPUJ was found to negatively impact these financial performance metrics as well. Conversely, GEPU had a positive effect on ROA, ROE, and Tobin’s Q. Finally, we identified that the interaction between DSCR, ACR, CCR, and IVC had a negative and statistically significant effect on ROA, ROE, and Tobin’s Q, underscoring the complexity of the relationships among these variables.
Managerial Implications
This study offers valuable managerial insights concerning the utilization of debt financing within a firm’s capital structure, highlighting the associated risks.We examined several key financial ratios, including DSCR, ACR, CCR, and IVC were used to assess the risk of debt financing and its impact on financial performance. The corporation’s management faces a higher risk of using debt financing. The firms can make enough earnings before operating expenses, which the ICR shows. However, the deduction of the operating expenses from the earnings before interest and tax shows that the earnings cannot pay for the debt service obligation, and it is possible that the rights of the shareholders would be lost to the corporation’s creditors. However, management should consider reducing their operating costs to have enough earnings after tax to pay for their debt service obligation and give a good return to the shareholders. Management should also rely heavily on the corporation’s assets to generate enough earnings to be added to its earnings, allowing them to service all its debt obligations.
The study also suggests to the managers that they should reduce the percentage of debt financing used in their capital structure, which would reduce the amount of interest and principal that they are supposed to pay on the use of debt financing. Reducing the percentage of debt financing would lead to better earnings in the future by enabling the corporation to pay for all its debt and reducing the risk of financial distress and bankruptcy.
Footnotes
Declaration of Conflicting Interests
The author(s) declared no potential conflicts of interest with respect to the research, authorship, and/or publication of this article.
Funding
The author(s) received no financial support for the research, authorship, and/or publication of this article.
Ethics Statement
Not applicable.