
Abstract
Innovation strategies form the bedrock of sustainable business development in semiconductor firms. Using dynamic network data envelopment analysis (DN-DEA), the performance of the main global semiconductor firms during 2015 to 2019 was evaluated and the effects of intangible assets within their innovation strategies were explored. Operating efficiency (OPE) was found to be greater than R&D efficiency (RDE), and the average overall efficiency of Asian firms was found to be higher than that of American & European (AMEU) firms. A low intangible asset efficiency (ISE) indicates greater operating risks (2017 showed the highest value and 2015 the lowest). Establishing four regions, Region A showed innovation ability, but lacked business performance. Region B showed lack of both progress and operating performance. Region C showed good innovation ability and good operating performance. Region D showed innovation ability, but lack of progress. Thus, innovation achievements and intangible assets are key indicators of global semiconductor companies’ business sustainability.
Introduction
KPMG’s (2019) 14th annual global semiconductor industry outlook reports that in 2019 there were 69 firms with less than US$100 million in terms of annual revenue and 54 firms with over US$100 million. Since semiconductor companies overall typically invest in research and development (R&D) for growth, small firms can take advantage of open-source platforms that make R&D more accessible and affordable if they do not have the same resources as established semiconductor leaders. Examining the R&D investments of global semiconductor companies that responded to the KPMG survey showed that rising R&D costs also ranked as the number one industry issue, and that 78% of companies expect their R&D spending to increase in the next fiscal year, while nearly 30% of the respondents reported that their companies plan to invest more than one-quarter of the year’s revenue in R&D. Among the companies, only 17% showed an R&D spending approaching zero, while the inefficient or very inefficient R&D spending is only 9% in global semiconductor companies. The Internet of Things (IoT) and the connected world ecosystem are poised to propel this industry’s growth further, with more than 26 billion devices already connected via the Internet. Peng (2019) notes that sales of semiconductor products in all major categories grew in 2018, with the main categories being dynamic random access memory (DRAM) and NAND Flash. The global semiconductor market size has shown continuous growth: US$4.022 trillion in 2017, US$4.779 trillion in 2018, and US$4.901 trillion in 2019, respectively. According to the World Semiconductor Trade Statistics (WSTS, 2019), the global semiconductor market grew by 13.7% in 2018 to US$468.8 billion but then decreased by 13.3% in 2019 to US$406.6 billion. However, the forecast still shows a growing trend for 2020 in all groups. These data-points show how the semiconductor industry is still an important technology industry.
From the above industry analysis, clearly the semiconductor industry has a great impact on overall economic development, and therefore, the business performance and business risks of semiconductor firms are worth studying. The DEA is a good tool for assessing business performance by considering single or multiple periods or multiple stages (divisions) and multiple input and output items. Mardani et al. (2017) state that the DEA approach applied to evaluate operating efficiency has been published in 45 high-ranking journals from 2006 to 2015 and found that the DEA is an effective tool to evaluate business performance issues. Studies by Yang et al. (2012) and Hung et al. (2014) have used the traditional DEA approach to evaluate the performance of the technology industry while Hong and Chu (2011), Liu et al. (2013), Li et al. (2019), W. M. Lu and Hung (2010), and L. Y. Y. Lu (2011) have used the dynamic DEA, dynamic network DEA (DN-DEA), two-stage, and three-stage approaches for the same.
R&D performance is an important aspect of the technology industry, but the impact of R&D input and output on business performance is difficult to evaluate, especially considering the output of intangible assets. Radenovic and Krstic (2017) state that it is difficult to identify and measure intangible assets or understand how knowledge management of technological innovation can be applied as the input and directly connected to the output as the final output. Intangible assets contain many aspects; Awano et al. (2010) measured six categories of intangible assets: employer-funded training, software, R&D, reputation and branding, design, and business process improvement. Chen et al. (2018) explored the relationship between intangible assets and technical efficiency and found that intangible assets show a positive association with technical efficiency.
From a previous review, it has been found that the DEA approach is a good tool for assessing business performance and that innovation strategy and intangible assets are important factors positively affecting the business performance of global semiconductor firms. However, the multiple inputs and outputs of most research focus on operating costs, fixed assets, operating incomes, net profit, and earnings per share (EPS). Separate studies have also examined the effects of intangible assets on operating performance. However, integrated research on the interactions among business performance, R&D performance, and intangible asset efficiency are limited. Although defining the relationship between intangible assets and operating performance is difficult, we propose the following hypotheses and examine whether the findings support them:
(1) R&D efficiency and intangible asset efficiency have a positive impact on operating performance.
(2) Business efficiency of semiconductor firms is affected by the region in which they are situated.
In the technology industry, especially the semiconductor industry, investment in R&D and innovation has a decisive impact on operating performance. This study aims to explore the relationship between continuous R&D results and operating performance and risks. The main input and output variables of R&D efficiency include R&D expenses, patent number, and intangible assets, while operating efficiency includes investment in fixed assets, operating expenses, etc. input variables, and outputs of operating income, net profit, and earnings per share. Therefore, the research framework of this study uses the dynamic network DEA (DN-DEA) approach, which is divided into the two stages of operating efficiency and R&D efficiency with intangible assets as good carry-over. These operating data are taken from the annual financial reports published by each semiconductor firm, and the patent data are taken from Espacenet patent research conducted between 2015 and 2019. We are thus able to obtain overall efficiency, stage efficiency, and term efficiency of each DMU, which can be used as a relative comparison, and provide suggestions for discussing business strategies and estimated business risks.
This research (1) provides an integrated discussion dividing business performance into the two stages of operating efficiency and R&D efficiency, using intangible assets as good carry-over to assess business performance under the DN-DEA approach; (2) explores the relationship between innovation and operational risk based on R&D efficiency (RDE) and intangible asset efficiency (ISE); and (3) examines regional differences using the meta-frontier approach. The findings are then used to prove the hypotheses proposed earlier. The results can be used as an important reference for global semiconductor firms to determine their business strategy.
Literature Review
The DEA approach is a good tool for assessing business performance by considering single or multiple periods or multiple stages (divisions) and multiple input and output items. Many studies, such as Yang et al. (2012), have evaluated business performance of the top ten TFT-LCD manufacturers in South Korea, Taiwan, and Japan during 2002 to 2007 using the traditional DEA model. Since the evaluation of the operating performance of the technology industry is mostly affected by cross-year impacts, dynamic or dynamic network DEA approaches are most often used. Studies that have explored the efficiency of innovation and R&D are explained as follows.
(1) Dynamic or dynamic networks DEA approaches
Hung et al. (2014) used dynamic DEA to explore the business performance of Taiwan’s semiconductor industry for the period 2006 to 2012. Hong and Chu (2011) used the dynamic network DEA (DN-DEA) to assess the performance of TFT-LCD firms in Taiwan and South Korea during 2004 to 2008, focusing on the perspective of financial crises and business risk. Studies have also applied two- or three-stage model DEA, such as Liu et al. (2013) and Li et al. (2019). Multiple input and output variables during single or multiple periods can be processed using the DEA approach and reasons for efficiency, or lack of it, as well as adjustments to the efficiency goals for the input/output variables can be extracted. Studies such as W. M. Lu and Hung (2010) and L. Y. Y. Lu (2011) have evaluated the business efficiency of technology industries by calculating the business performance of 48 semiconductor firms in Taiwan and integrated circuits (IC) separately. Hsu (2015) combined DEA and improved grey relational analysis (IGRA) to explore the operating performance of listed semiconductor companies in Taiwan, noting that business performance evaluation is not only an important issue but also a reference index when determining an investment strategy. Hung et al. (2014) used dynamic DEA to evaluate performances in Taiwan’s semiconductor industry from 2006 to 2012 and found that integrated circuit (IC) design companies are more efficient than others, and that companies with high-level efficiency generally operate better than those with low-level efficiency. F. Lin et al. (2018) combined the Analytic Hierarchy Process (AHP) and Network DEA to measure sustainable performance in Taiwan’s semiconductor industry, showing that its semiconductor manufacturing sector has exhibited a steady increase in its overall trend of sustainable performance.
(2) R&D and intangible assets issues
The semiconductor industry is a technology industry. R&D investments, R&D output, and intangible assets are key factors in its business performance and business risks. Haskel (2012) proposed that costs can be understood by examining firms’ spending on R&D scientists; however, firms find this information difficult to provide as it requires considering all product development efforts that might contribute to long-term idea-building, such as designers and market researchers. In addition, the output of intangible assets must be greater than the output of human and tangible assets. Chen et al. (2018) observed a positive association between intangible assets and technical efficiency, especially considering employee training programs and marketing expenses, although R&D and software and database expenses can cause short-term inefficiency due to their longer payback period. Therefore, since the business performances of global semiconductor firms significantly affect the development of technology industries and the global economy, the relationship between R&D and intangible assets and its impact on business performance is worth further exploration. To understand the importance of innovative R&D and intangible assets to the technology industry, especially in terms of intangible assets efficiency, a more in-depth discussion is necessary, which is a gap that this study serves to address.
The International Financial Reporting Standards Foundation (IFRS, 2010) defines an intangible asset as an “identifiable non-monetary asset without physical substance.”Petković et al. (2020) explore the evaluation methods of intangible assets and state that intangible assets are the fundamental generators of companies’ advantage. They form the companies’ most important resources from the past and help determine their current business success. St-Pierre and Audet (2011) explore the linking of intellectual capital with a business strategy and the performance of small- and medium-sized enterprises (SMEs). When attempting to link intellectual capital components to performance, then it is strategy specific, just like another variable that influences performance.
Chun and Nadiri (2016) examine how the the change in intangible investments in South Korea had an impact on the country’s economy by demonstrating that intangible-intensive industries have significantly greater aggregate labor productivity growth. Seo and Kim (2020) explored the effects of intangible assets on the operating performance of SMEs and showed that business managers can strategically use investments in intangible assets to accomplish their managerial goals. Therefore, the impact of the formation of intangible assets on business performance needs exploration. H. L. Lin and Lo (2015) examined the effects of intangible assets on operating performance in Taiwanese manufacturing firms and found that intangible investments have a positive impact on operating performance.
(3) Cross-regional impact issues
The business strategies of the semiconductor industry are global, cross-regional, and greatly affected by the business environment. Chiu et al. (2014) utilized dynamic DEA to evaluate Taiwan’s semiconductor industry performance based on a meta-frontier approach, and found that the European debt crisis in 2011 had an impact on integrated circuit (IC) design companies and IC manufacturing companies, but that there was no influence on IC packaging and testing companies when measuring static efficiency. Fang (2020) used two-stage to explore operational and environmental efficiency in the semiconductor industry and found that an efficient company does not necessarily mean that it plays a key role in the entire industry. This reveals how the business performance of semiconductor firms is greatly affected by the environmental regions in which they are situated.
The above literature review demonstrates a significant positive relationship between the R&D results of innovation and operating performance. To explore the relationship between R&D efficiency and operating efficiency and overall efficiency, the DN-DEA method is used in this study. We regard the two stages as the two departments of operating efficiency and R&D efficiency, using net profit as a link within Stage 1 and Stage 2, and to better understand the impact of intangible assets efficiency, use it as a cross-year carry over. In the DEA approach, the dynamic cross-year impact research usually uses 3 to 5 years as the appropriate interval, because performance evaluation is to review the past and predict the future. This study intends to collect the complete data and avoid the market impact caused by the research results, and hence, the selected period is 2015 to 2019, and the evaluation results do show a similar trend as the operating performance ranking of 2019 to 2020, thus demonstrating that the method is appropriate.
Research Method
Since there are numerous global semiconductor firms, not all of them can be examined in this study. We chose the decision-making units (DMUs) from the top 30 global semiconductor rankings (IC Insights, 2019) and China’ main semiconductor firms. Therefore, the present study divides semiconductor firms into two groups: Europe & America (AMEU) and Asia, as shown in Table 1.
Global Semiconductor Firms in This Research.

Source. Authors’ compilation.
We used the dynamic network DEA (DN-DEA) approach to evaluate the business performance of global semiconductor firms. The methodology flow chart is as shown in Figure 1, step by step, depicting how the final results are derived from data collection, running the program, estimating efficiency, deriving the Malmquist product index (MPI) results, empirical results, discussion, etc. The entire process is divided into two stages: Stage 1 (operating efficiency) and Stage 2 (R&D efficiency). Using the dynamic network DEA (DN-DEA) approach, we consider intangible assets as the carry-over variable from periods t to t + 1. Figure 2 represents the framework. The input items in Stage 1 are fixed assets (FA), employee numbers (EN), and operating expenses (OE). The output items are operating income (OI), shareholders’ equity (SHE), and EPS. In Stage 2, the input is R&D expenses (R&D), and the output is patent number (PN). Net profit (NP) is the link between Stages 1 and 2, and the period is from 2015 to 2019. (NP) is a link between Stages 1 and 2, the periods cover 2015 to 2019.

Methodology flow chart of the DN-DEA approach in this study.

Structure of the DN-DEA approach in this study.
For assessing business performance, the DN-DEA approach utilizes company data to evaluate operating efficiency in Stage 1 in this study. Although the number of patents is not necessarily related to key technologies, patent litigation cases still cause controversy in the technology industry. Bekkers et al. (2011) explore the determinants of essential patent claims in compatibility standards and propose that ownership of such patents is a valuable bargaining tool in cross-license negotiations, while for non-producing firms such patents may result in a substantial stream of licensing revenues. Jeong and Kim (2014) state that patents on a new technology (a technology not yet commercialized and in an early stage of its life cycle) provide many benefits. We thus use R&D and PN as the input and output to assess the R&D division efficiency (Stage 2) and then utilize intangible assets as a carry-over between periods t and t + 1 and NP as a link between Stages 1 and 2.
DEA methods employ linear programming (LP) and the Pareto optimal solution to evaluate the relative efficiency of each decision-making unit (DMU) and to form an efficiency frontier with the input and output variable data (Farrell, 1957). Charnes et al. (1978, called the CCR model) and Banker et al. (1984, called the BCC model) use a single-stage and single-period DEA model to assess operating efficiency. Färe et al. (2007) use the network DEA model to explore the operating performance of divisions comprising individual sub-processes. Tone and Tsutsui (2009) use weighted slack-based measures for network DEA and then propose dynamic and network DEA (DN-DEA) and Malmquist product index (MPI; Tsutsui & Tone, 2013). Tone and Tsutsui (2014) utilize the DN-DEA model to calculate efficiency with a link between divisions 1 and 2 and a carry-over between periods t and t+1. Multiple-stage or multi-division frameworks have also been used, such as Mostafa (2009), Yu (2010), and Chiu et al. (2014). Mardani et al. (2017) propose DEA as a good evaluative tool for business performance issues.
In assessing the business performance of global semiconductor firms using the DN-DEA approach, we refer to Tone and Tsutsui (2009, 2014) and Tsutsui and Tone (2013) to propose a dynamic network slacks-based measure (DNSBM) that utilizes operating data to explore operating performance in Stage 1. We take R&D and PN to calculate R&D performance, where NP is the link between Stages 1 and 2, and intangible assets are the carry-over from periods t to t + 1. We use DEA-Slover-PRO version 14.0 to calculate the overall efficiency


They indicate i of input and output of DMUj for division k in period t.

This is z linking the intermediate of DMUj from division k to h in period t.

This is a carry-over of division k for DMUj from period t to t+1.

Here,
We note that

Here,
Intangible assets are a carry-over good. In equation (7), the symbol “α” stands for the good.

The period efficiency


The Malmquist product index (MPI) is used to calculate the efficiency change of a DMU within two different periods. It contains catch-up and frontier-shift terms. Färe et al. (1994) calculated the MPI of total factor production (TFP) changes with the distance function and divided it into technical efficiency change (TEC; catch-up effect) and technological change efficiency (TCE) (frontier-shift effect). TEC indicates the degree of improving efficiency over periods t and t + 1, while TCE is the change of the efficient frontiers between the two time periods. TEC, TCE, and MPI show the tendency of progress, status quo, and regress with >1, =1, and <1, respectively. Equation (10) shows the period-division efficiency


Here,

The overall Malmquist index (OMI) can be obtained as the geometric mean of the divisional Malmquist indices, evaluated by:

Here,
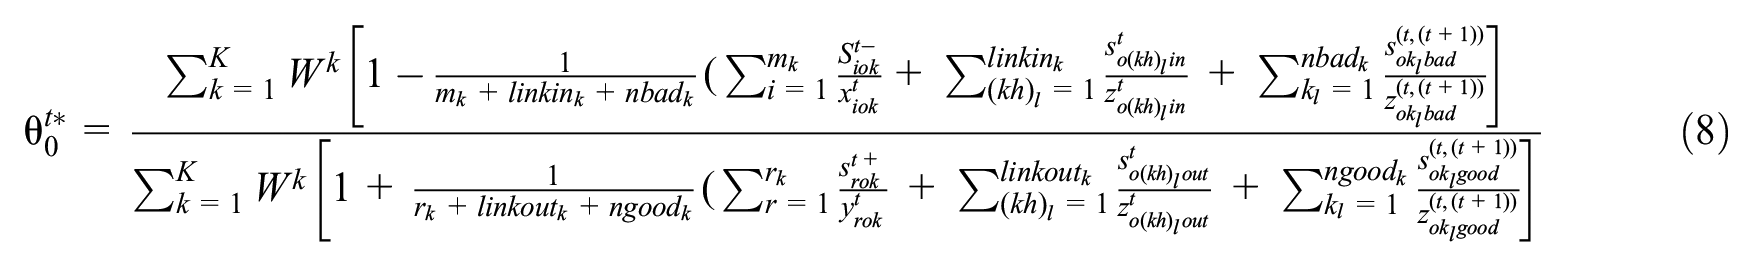
The business performance of semiconductor firms is continually challenged by the changing global operating environment. Ruttan et al. (1978) define a meta-frontier to allow different groups measure efficiency across a common basis. O’Donnell et al. (2008) propose a meta-frontier model to explore group and meta-frontier technical efficiencies. This study is based on Tone and Tsutsui’s (2009, 2014) SBM D-DEA and DN-DEA models and the meta-frontier model of O’Donnell et al. (2008) to modify the Meta-frontier DN-DEA (MF-DN-DEA) approach. As mentioned earlier, global semiconductor firms are divided into two groups, America and Europe region (AMEU) and the Asia region (Asia), to evaluate the technical efficiency of the meta-frontier (MFTE) and the group frontier (GFTE). Equations (8) to (10) solve the MFTE and GFTE of the DMUs that contain the term efficiency, division efficiency, and overall efficiency.
As the meta-frontier is contained in the group frontier of g groups, the technical efficiency of meta-frontier (MFTE) ρ is less than the technical efficiency of group frontier (GFTE)

The inputs and outputs are fixed assets (FA), employee numbers (EN), operating expenses (OE), operating income (OI), earnings per share (EPS), and shareholders’ equity (SHE) in Stage 1 and are R&D expenses (R&D) and patent number (PN) in Stage 2. Net profit (NP) is a link between Stages 1 and 2, and intangible assets are the carry-over between periods t and t + 1.
Table 2 lists the descriptive statistics and definition of global semiconductor firms for the period 2015 to 2019. We find that the maximum (Max) and minimum (Min) values of the inputs and outputs present a significant difference. The Max value of EN is IBM’s 380,300 persons in 2016, while the Min value is GSI’s 142 persons in 2015. The Max value of FA is Apple’s US$246.674 billion in 2017, while the Min value is GSI’s US$2.34 million in 2019. The Max value of OE is Apple’s US$161.782 billion in 2019, while the Min value is GSI’s US$1.66 million in 2019. The Max value of SHE is Apple’s US$375.319 billion in 2017, while the Min value is GSI’s US$9.95 million in 2019. The Max value of OI is Apple’s US$265.595 billion in 2018, while the Min value is GSI’s US$4.26 million in 2017. The Max value of EPS is Samsung’s US$265.12 in 2017, while the Min value is Broadcom’s US$-4.86. The Max value of R&D is Huawei’s US$18.721 billion in 2019, while the Min value is GSI’s US$1.21 million in 2015. The Max value of PN is Samsung’s 30,243 in 2016, while the Min value is GN’s 6 in 2018. The Max value of NP is Apple’s US$98.392 billion in 2019, while the Min value is Qualcomm’s US$-4.864 billion in 2018. The Max value of intangible assets is Samsung’s US$17.764 billion in 2019, while the Min value is GSI’s US$ 0.25 million in 2019. These statistics show the different operating scales of the DMUs, which require sustainable business strategies to face operating risks.
Variables’ Descriptive Statistics and Definition in This Study for the Period 2015 to 2019.

Source. Authors’ compilation.
Empirical Result and Discussion
Table 3 shows the empirical results of the overall and period efficiencies for global semiconductor firms during the period 2015 to 2019, these results are calculated from the aforementioned equations (8) to (10). We find that the average overall efficiency of Asia (0.38) is greater than that of AMEU (0.37). The best overall period efficiency for global semiconductor firms is seen in 2018 (0.52), and the worst in 2017 (0.31). AMEU’s best period efficiency is seen in 2018 (0.55), and its worst in 2015 (0.33). Asia’s best period efficiency is seen in 2016 (0.59), while its worst is in 2017 (0.31). These results show similar trends as do the global semiconductor production values presented in the World Semiconductor Trade Statistics (WSTS, 2019), shown in Table 4. Although the trends do not match perfectly, the best performance completely matches for 2018, proving that the research methods, research structure, and variables are sufficient to understand and compare the business performances of the DMUs in this study.
Results of Overall and Period Efficiencies for 2015 to 2019.

Source. Authors’ compilation.
Comparison of Statistical Data from the WSTS and DN-DEA Results in This Study.

Source. Authors’ compilation.
We find that the 2017 global semiconductor production value (US$412.2 billion) is greater than that in 2016 (US$339 billion), but the average period efficiency in 2017 is less than that in 2016. This could be because 17 DMUs have a period efficiency value of less than 0.1, indicating that operating efficiency is different in that year. DMUs with poor performance must focus on innovating and thus reduce the risk of their sustainable business.
We compare the period efficiencies in AMEU and Asia and find that Asia performed better in 2015 and 2016, while AMEU performed better in 2017, 2018, and 2019. These results of these period efficiencies show that AMD, Teradyne, and ON must change their business strategy; otherwise, operational risks may arise, as their operating efficiencies are relatively poor in 2015 to 2019. Some DMUs, such as Qualcomm (2018); Broadcom (2016); Marvell (2015, 2017); Sharp, NovaTEK, RealTEK, Macronix, Winbond, SHA, and CJET (2017); UNIS (2017, 2019); and UMC (2017, 2018, 2019), show poor operating efficiency in a certain year due to a certain business strategy. These DMUs must realize that the key to sustainable business strategies in the semiconductor industry lies in technological innovation. The best overall and period efficiencies are seen in Apple, Samsung, and IBM, as their business performances are equal to 1 in 2015 to 2019. These DMUs continue to maintain stable growth in innovation and business strategies, which is conducive to corporate sustainability.
In this study, we use the DN-DEA approach and divide the process into two divisions: Stage 1 (operating efficiency, OPE) and Stage 2 (R&D efficiency, RDE). The results of the stages’ efficiency appear in Table 5. We find that OPE is greater than RDE in 2015 to 2019. R&D expenses and patents are used as the input and output, respectively. Although the number of patents is not directly related to key technologies, it is still related to the degree of innovation and even directly affects business risks. Some DMUs must strategically cooperate with others to share patent rights so that they do not incur high business risks, for instance, DMUs like STM, AMD, Infineon, Broadcom, Teradyne, ON, GSI, IDT, Agilent, NovaTEK, and UNIS. Their average RDE is less than 0.1 for 2015 to 2019. The best division efficiency of OPE is in 2016 (0.82), while the worst division efficiency of OPE is in 2017 (0.55). The best division efficiency of RDE is in 2017 (0.37), while the worst division efficiency of RDE is in 2019 (0.32).
Stage Efficiencies via DN-DEA in This Study for the Period 2015 to2019.

Source. Authors’ compilation.
The semiconductor industry is a technology sector. Thus, in addition to the issue of patent rights, another important factor is the value of intangible assets, which are a carry-over good in this study. To understand the difference between the actual data of intangible assets and the projected value by the DN-DEA approach, we define intangible asset efficiency (ISE) as equal to the original data/the projection values from the DN-DEA approach. The results are as shown in Table 6. This value indicates the gap between the actual and ideal, which may have a key impact on sustainable operations. If the gap is too small, it may lead to greater operating risks.
Results of This Study after Defining Intangible Asset Efficiency for 2015 to 2019.

Source. Authors’ compilation.
We find that the best overall average value of ISE is in 2017 (0.62), and the worst performance is in 2015 (0.56). More DMUs have fluctuating conditions in different years during the period 2015 to 2019, and those that can continue to maintain a stable and large value have relatively good operating performance. Therefore, we set the overall average value (0.59) as a key reference value. DMUs with a value smaller than this must focus on business risks and have a corresponding business strategy to face such problems to maintain stable and sustainable operations. These include STM, Texas, AMD, Teradyne, Nvidia, Marvell, Dialog, GSI, IDT, KLA-Tencor, Lam, Xilinx, Toshiba, Rohm, UMC, NovaTEK, RealTEK, Macronix, Winbond, and SHA. Apple, Samsung, and IBM have the best ISE, indicating that their performance is stable in the period 2015 to 2019.
The Malmquist product index (MPI) can detect the efficiency change of a DMU between two different periods and show the tendency of progression, status quo, and regression using >1, =1, and <1, respectively. The results are as shown in Table 7. Here, Y1 shows the changes in performance from 2015 to 2016, Y2 from 2016 to 2017, Y3 from 2017 to 2018, and Y4 from 2018 to 2019. “G-Mean” is the geometric mean of Y1, Y2, Y3, and Y4, and “Overall” is the geometric mean of R&D MPI and Operating MPI. These results present the tendency of progression, status quo, and regression for 2015 to 2019.
The Results of MPI by Using DN-DEA in This Study for the Period 2015 to 2019.

Source. Authors’ compilation.
We find that 15 DMUs showing a tendency of progression are Intel, Texas, STM, Apple, AMD, Micron, IBM, ASML, Analog, Nvidia, Lam, Samsung, TSMC, Hynix, and MediaTEK. This indicates that these DMUs have more effective sustainable business strategies to achieve the trend of continuous progress and therefore have relatively low business risk. These results are quite consistent with the results of the top 15 global semiconductor rankings. Among them, DMUs that differ greatly from the results are NXP, Infineon, Qualcomm, Broadcom, Toshiba, and Sony. This is because NXP’s R&D MPI and Operating MPI have regressed significantly in Y3 and Y4, respectively; likewise, Infineon’s R&D MPI has regressed significantly in Y4; Qualcomm’s R&D MPI and Operating MPI have regressed significantly in Y3; Broadcom’s R&D MPI has regressed significantly in Y1, Y2, and Y3, and its operating MPI has regressed significantly in Y4; Toshiba’s R&D MPI has regressed significantly in Y1, Y2, Y3, and Y4, and its operating MPI has regressed significantly in Y2; Sony’s R&D MPI has regressed significantly in Y1, Y3, and Y4, and its operating MPI has regressed significantly in Y4. These DMUs must be careful in adopting sustainable business strategies to avoid possible business risks.
The semiconductor industry is known for high levels of technological innovation; however, in addition to the current period’s operating performance, this industry also needs to consider the trend of progress or regress in a given current year. Therefore, this study is similar to the BCG matrix model, using the efficiency and MPI are calculated by the above equation as the coordinate axis, these can be used to explore the progressive trend of global semiconductor firms in operating efficiency and whether they have competitiveness in the future, which can be divided into four areas A, B, C and D. We set the X-axis as the period efficiency, and the Y-axis as the MPI of each DMU’s business risk. The efficiency value is between 0 and 1 in this study; therefore, we use 0.5 as the point of separation between good and no-good operating efficiency. An MPI equal to 1 indicates that status quo is maintained, while and MPI >1 indicates a progression trend and <1 indicates a regression trend; therefore, MPI is divided by 1. Thus, the center point is (0.5, 1), which helps ascertain whether efficiency reaches the upper-middle level and whether there is a trend denoting progress.
We set up four regions: A, B, C, and D. Region A has a period efficiency of less than 0.5 and an MPI greater than 1, which means that although it has the ability to make progress, effective performance is lacking. This is an indication of sufficient innovation ability, but a lack of business performance; thereby, the business strategy should be improved to make progress. Region B is a period efficiency of less than 0.5 and an MPI less than 1. There is lack of both innovation ability and operating performance. The firm should commit to enhancing both. Region C is a period of efficiency greater than 0.5 and an MPI greater than 1, illustrating the ability to make progress and produce effective performance, wherein both innovation ability and operating performance are good. Region D is one with a period efficiency greater than 0.5 and an MPI less than 1, which implies that although business performance is indicated, the ability to make progress is lacking. Therefore, such firms need to develop the ability to innovate, else will be at a greater business risk.
From the results of the overall efficiency and overall MPI shown in Tables 3 and 7, we find no DMUs in region A, but many DMUs (27) in region B, such as STM, AMD, Infineon, Qualcomm, Broadcom, Teradyne, Analog, Nvidia, ON, Western, Dialog, GSI, IDT, Agilent, KLA-Tencor, Xilinx, Marvell, Sharp, Renesas, UMC, NovaTEK, RealTEK, Macronix, Winbond, SHA, CJET, and UNIS (>60%). The relatively good DMUs (11) are in region C: Intel, Texas, Apple, Micron, IBM, ASML, Samsung, Toshiba, TSMC, Hynix, and MediaTEK. Region D has six DMUs: NXP, Lam, Sony, Panasonic, Rohm, and Huawei. These results can be used as a reference for each DMU in formulating innovation and business strategies.
We compare the technical efficiency gap ratio (TGR) between the AMEU and Asia groups. The results are as shown in Table 8. A larger value indicates a smaller difference between the technical efficiency of the meta-frontier and group-frontier performances. We find that the overall TGR difference between AMEU (0.73) and Asia (0.71) is small for 2015 to 2019. AMEU’s TGR is better than Asia’s TGR in 2018 (0.82) and 2019 (0.78), while Asia’s TGR is better than AMEU’s TGR in 2015 (0.74), 2016 (0.83), and 2017 (0.64). AMEU’s best TGR is in 2018. Moreover, 19 DMUs (> 70%) have a TGR greater than 0.7, and no DMU is less than 0.1. The best TGR of Asia is in 2017, with 10 DMUs (> 50%) exhibiting a TGR greater than 0.7. These results are consistent with those for the period efficiencies shown in Table 4. They indicate that operating efficiency has a significant impact on the regional environment; thus, the hypothesis that previous operating performance is affected by the region is confirmed. They also show that utilizing DN-DEA and the selected input-output variables, and then using intangible assets as the carry-over, can indeed explain the operating performance of global semiconductor vendors. In a global market, there will always be differentiated innovation and business strategies for sustainable development.
Results of TGR Utilizing DN-DEA in This Study for 2015 to 2019.

Source. Authors’ compilation.
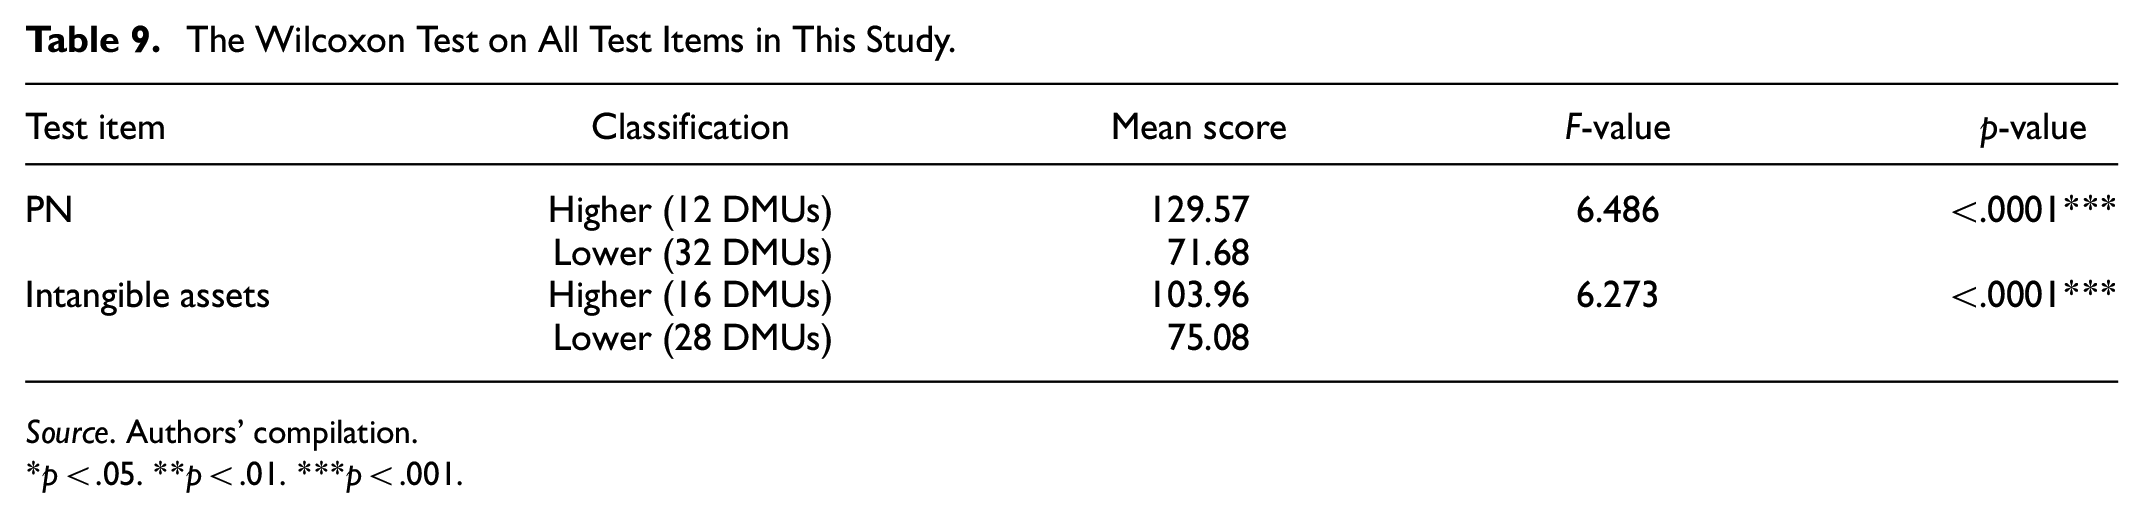
This research aims to further explore whether innovation issues such as the number of patents and intangible assets have a direct impact on business performance. Thus, we use the non-parametric statistical Wilcoxon test to find the average value as a reference point to distinguish between higher (>average) and lower (<average) groups. The average value of PN is 3,417, and the average intangible assets are US$1.861 billion. The results are as shown in Table 9. We find that higher and lower values of PN and intangible assets present significant differences in performance (p < .0001). They show that innovation achievements and an increase in intangible assets are indeed key indicators of whether global semiconductor firms can have a sustainable business; thus, the previous hypothesis that R&D efficiency (RDE) and intangible asset efficiency (ISE) tend to have a positive impact on business performance is confirmed.
The Wilcoxon Test on All Test Items in This Study.
Source. Authors’ compilation.
p < .05. **p < .01. ***p < .001.
Conclusions
The global semiconductor industry comprises important technology and knowledge firms, and each firm’s innovation ability can directly affect its business performance. The research method and variables chosen in this study have proven to be suitable for explaining the operating status of global semiconductor firms, and most of the actual ranking data are consistent with the reports of KPMG and WSTS for the period 2015 to 2019. The average overall efficiency of Asia is greater than that of AMEU. the hypothesis that previous operating performance is affected by the region has been supported. Moreover, the best overall period efficiency for global semiconductor firms is 2018, while the worst period efficiency is seen in 2017. AMEU’s best period efficiency is seen in 2018, while its worst period efficiency is in 2015. Asia’s best period efficiency is in 2016, while its worst is in 2017. These results show similar trends as global semiconductor production values found in WSTS.
The period efficiencies of Asia were better in 2015 and 2016, while those of AMEU were better in 2017, 2018, and 2019. AMD, Teradyne, and ON must change their business strategies, as their operating efficiencies are relatively poor in 2015 to 2019. Some DMUs have poor operating efficiency in a certain year due to their business strategies, such as Qualcomm (2018), Broadcom (2016), Marvell (2015, 2017), Sharp, NovaTEK, RealTEK, Macronix, Winbond, SHA, and CJET (2017), UNIS (2017, 2019), and UMC (2017, 2018, 2019). These DMUs must realize that the key to sustainable business strategies in the semiconductor industry lies in technological innovation. Intangible asset efficiency (ISE) indicates the gap between the actual and ideal values, which may have a key impact on sustainable operations. We find that the best overall average values of ISE are in 2017, and the worst in 2015. Some firms must pay attention to business risks and develop a corresponding business strategy to maintain stable and sustainable operations. They include STM, Texas, AMD, Teradyne, Nvidia, Marvell, Dialog, GSI, IDT, KLA-Tencor, Lam, Xilinx, Toshiba, Rohm, UMC, NovaTEK, RealTEK, Macronix, Winbond, and SHA during 2015 to 2019 in the research results we derived.
This study explores whether efficiency of firms has touched the upper-middle level and whether the trend is one of progress. This would demonstrate the relationship between a firm’s R&D and innovation capabilities and operating efficiency. Intel, Texas, Apple, Micron, IBM, ASML, Samsung, Toshiba, TSMC, Hynix, and MediaTEK showed relatively good performance. This study also explores whether innovation issues have a direct impact on business performance and uses the non-parametric statistical Wilcoxon test to prove the differences in performance. We find that both higher and lower PN as well as intangible assets exhibit significant differences in performance. The hypothesis that R&D efficiency (RDE) and intangible asset efficiency (ISE) will have a positive impact on business performance is supported by our findings. This means that innovation achievements and an increase in intangible assets are key indicators of global semiconductor firms’ sustainable business. From the results of this study, it is clear that global semiconductor firms must continue to invest in innovative research and development to generate more key technologies for sustainable development in future, improve their business performance, and reduce operational risks.
The results obtained are relatively efficient due to the DEA approach. Thus, the study has two main limitations: (1) This study can only compare the selected DMUs with each other, and the selected methods and input-output variables may have different results using other DEA approaches. (2) This study does not include all global semiconductor firms, and therefore, the results may be different from those using other DEA methods. However, the current results and the literature show a similar trend, indicating that these research methods and results can provide global semiconductor firms an important reference for formulating business strategies. Future research may be to further analyze those patents that can create value. These may be closely related to business performance, but it is difficult to obtain with systematic evaluating performance model. It should be a very meaningful topic to analyze and discuss the impact of these patents and intangible assets on business performance in the future.
Footnotes
Acknowledgements
Declaration of Conflicting Interests
The author(s) declared no potential conflicts of interest with respect to the research, authorship, and/or publication of this article.
Funding
The author(s) received no financial support for the research, authorship, and/or publication of this article.