
Abstract
The use of mobile phones is ubiquitous around the world. Alongside the usage of mobile phones has been the rapid growth of related electronic waste, mainly aided by the very low rates of recycling of used phones. This study investigates the reasons behind the low rates of recycling of mobile phones in the United Arab Emirates, one of the heaviest users of mobile phones and one with very high e-waste generation. The study also has an important practical dimension in view of the policy initiative of the government in moving toward a circular economy. A significant contribution of this study is that we report the responses of phone users with respect to their usage patterns and factors that inhibit or enable them to recycle their phones. Our results show that environmental awareness about recycling and knowledge of the environmental consequences of improperly disposed of phones encourage recycling. However, personal, and external barriers prevent responsible disposal. We recommend strong government intervention, especially in school education, to enhance awareness about recycling. Further, the infrastructure for recycling needs to be made more user friendly and incentives should be offered to overcome personal barriers to recycling.
Keywords
Introduction
Electronic equipment in general and mobile phones, in particular, have become ubiquitous worldwide. Mobile phone subscriptions have increased from 76 per 100 persons in 2010 to 109 per 100 persons in 2019 (World Bank, n.d.a). Rapid technological advances and growth, specifically in the cell phone industry, have led to a massive increase in global sales for this product. Among mobile phone owners, a significant number own smartphones. The Pew Research Center (2019) estimated that 76% of those surveyed in advanced economies owned smartphones. Gartner (2022) reported that, despite a steep decline in sales of smartphones during 2020, there had been a recovery in 2021. In some markets, smartphones are constantly in high demand, and rapid growth has been forecasted in the near future (Deloitte, 2019).
Alongside the growth of mobile phones has been the equally rapid growth of mobile phone e-waste, which is a significant component of electronic waste. Forti et al. (2020) report in the Global E-waste Monitor of 2020 that the world generated 53.6 metric tons (Mt) of e-waste in 2019, growing at 9.2 Mt per year since 2014. Of the total e-waste generated in 2019, only 9.3 Mt was collected and recycled (Forti et al., 2020).
Apart from its rapid growth, e-waste is a problem because of its impact on the environment. Although e-waste contributes only 2% of the total waste in America, it is the source of 70% of the total toxic waste (Noman & Amin, 2017) and 70% of heavy metals found at landfill sites come from improperly discarded mobile phones (Thomas, 2012). The primary reason for this is the number of hazardous and toxic materials, such as mercury, flame retardants (BFR), and chlorofluorocarbons (CFCs), that leach out of improperly disposed of phones (Dasaklis et al., 2020). The growing quantum of e-waste coupled with low collection and treatment poses significant environmental and human health risks (Forti et al., 2020). Goyer (2004), in a study submitted to the U.S. Environmental Protection Agency, pointed out that even limited exposure to toxic metals can produce adverse health impacts on any human organ.
It is also important to note that smartphones disposed of carelessly have adverse environmental and human consequences and represent economic waste in the sense of lost precious salvageable components. Smartphones have a very high recycling potential since “15% of Glasses and Ceramics, 40% of Plastics, and 15% of Copper are recyclable” (Noman & Amin, 2017). According to the U.S. Environmental Protection Agency, “For every million cell phones we recycle, 35 thousand pounds of copper, 772 pounds of silver, 75 pounds of gold, and 33 pounds of palladium can be recovered.” (US EPA, n.d). If all the used smartphones, which are “hibernating” in households in the European Union, were to be collected and recycled, this would amount to almost 700 million devices and “approximately 14,920 tonnes of gold, silver, copper, palladium, cobalt, and lithium with a value of over €1 billion could be recovered” (European Economic and Social Committee, 2019).
The discussion so far indicates that there is much value to be recovered from the recycling of mobile phones in the form of precious metals that lie embedded in them when they are disposed of either in landfills or remain hibernating in people’s homes (Ackah, 2017). Hibernating rates range from over 40% in Korea to almost 85% in Finland (Inghels & Bahlmann, 2021). Numerous studies (mentioned in a later sub-section) have investigated the poor response of mobile phone owners to recycling while identifying some inhibiting and some encouraging factors in the recycling of phones and e-waste in general. Many of the impediments to recycling phones have also been observed in the adoption of green technology (see Ikram et al. (2021), who present suggestions on how these may be removed by appropriate policy formulation), and lessons learned from that may have relevance here.
Focus of the Study
The present study seeks to investigate the phenomenon of low rates of recycling of mobile phones in the United Arab Emirates (UAE), where smartphone penetration is as high as 97%, according to a Deloitte (2019) study. Our concern with the low rates of recycling of mobile phones leads us to our research question as follows:
The UAE is a small country with a population of just under 10 million, and yet it is number 3 in the number of phones per 100 persons after Macao and Hong Kong (World Bank, n.d.b). The UAE has witnessed a year-on-year growth of 16% in 2019, particularly for smartphones (Sharma, 2019). Our computations show that the elasticity (i.e., percentage increase in cell phone subscriptions with respect to a 1% growth in GDP) of total cell phones with respect to GDP in the UAE over the period 1996 to 2019 is 4.63 as compared to 4.51 in the USA and 2.32 in China. As of 2019, the value of the UAE smartphone market stood at USD 9.32 billion (TechSciResearch.com, 2019). The average smartphone utility period in the UAE is just 2 to 3 years (Kumar, 2020), after which users replace their older device with a new one. Such short utility periods for smartphones indicate a significant amount of e-waste generated only from this source. The average amount of e-waste generated by the UAE is high at 15 kg per capita in 2019, which is well above the average of 8.6 kg per capita for 180 countries whose consumption has been documented in the Global Waste Monitor 2020 (Forti et al., 2020). This issue is further compounded by the fact that there are no widespread, consolidated reverse logistics processes in place for the country’s end-of-life (EOL) smartphone handling.
There is an important practical dimension to this research, and it ties in well with an important policy of the UAE government. The UAE economy recognizes that, while it has achieved tremendous economic and social development, it has also led to a dramatic increase in the demand for resources (Government of the UAE, 2021). The UAE’s Circular Economy Policy envisions moving away from a degenerative linear (take, make, use, dispose) economy…toward a regenerative circular economy where consumption and production operate sustainably within environmental limits…” (Government of the UAE, 2021, p. 3). The policy seeks to examine how financial incentives could be used to encourage sustainable production and consumption. These are issues of tremendous practical importance for the country and the present study seeks to contribute to this move toward a circular economy.
This present study makes an important contribution to the literature in this area by focusing on a country that is one of the heaviest users of mobile phones in the world and one with very high e-waste generation per capita. A couple of recent studies (Siddiqua et al., 2022; Yahya et al., 2022) have explored the problem of recycling mobile phones in the UAE. A further significant contribution of this study is that we report the responses of phone users with respect to their usage patterns and factors that inhibit or enable them to recycle their phones. We also believe ours is one of the few studies in this area that implements a rigorous econometric approach to understanding recycling behavior. Dhir et al. (2021) is one of the few earlier studies that used statistical estimation approaches to modeling the recycling of e-waste. Our results show that an overwhelming number of mobile phone users in the UAE use smartphones, 70% of such users use their phones for at most 3 years, and almost 45% of users negligently dispose of their phones, that is, throw them in a landfill or leave them in the drawer. Prior studies in this area of research have identified environmental awareness as an essential determinant of recycling behavior (Li et al., 2012; Baxter & Gram-Hanssen, 2016; Inghels & Bahlmann, 2021; Welfens et al., 2016). From our survey results and the estimation of our logistic model, we have also found that environmental awareness about recycling and knowledge of the environmental consequences of improperly disposed of phones discourages negligent disposal behavior. However, barriers exist which prevent responsible disposal, and users might require incentives in the form of convenient recycling options or discounts to encourage them to recycle (see Baxter & Gram-Hanssen, 2016; Kollmuss & Agyeman, 2010, and Welfens et al., 2016 for prior work on this aspect of recycling). Among the characteristics of the users, such as age, gender, and education levels (discussed in Islam et al., 2020; Saphores et al., 2006), we found that an increase in age and education bring about more responsible disposal behavior.
The paper is organized as follows: Section 2 provides an overview of the literature in this area and helps us to put forward our hypotheses; section 3 describes, in brief, the essential elements of the Theory of Planned Behavior and Norm Activation Model; section 4 describes our methodology covering questionnaire design as well the statistical techniques used, namely logit and multinomial logit; section 5 presents our findings and recommendations, and section 6 concludes.
Literature Review
Issues in Sustainability
We begin our literature review by first looking at the broad theme of environmental sustainability. Vehmas et al. (2018) note that preserving the limited natural resources the earth is endowed with and avoiding climate change requires increasing emphasis on sustainable consumption and production. Sustainable consumption involving increased reuse and recycling appears to be vital to reducing environmental impacts compared to the “linear, take-make-waste economy” (Awan & Sroufe, 2022). In this context, Awan and Sroufe (2022) emphasize the circular economy model that reuses and recycles material in consumption and production systems. The connection of the circular economy model to the consumption of smartphones being studied in the present paper should be obvious: the circular economy, which emphasizes increased reuse and recycling, is also essential for smartphones.
Closely allied with the issues of sustainability and circular economy are topics in green technology, which is understood as the “primary approach to easing the contradiction between economic growth and environmental sustainability” (Wu & Hu, 2020). Ikram et al. (2021) note that implementing green initiatives run into impediments that need to be addressed by strategic planning. On the consumption side, Awan and Raza (2012) seek to understand the attitudes, behavior, and factors that can influence consumers in their decisions to move toward more green options. For green initiatives to succeed, it is not enough that consumers adapt their consumption patterns; the onus also lies on businesses who might need to adopt green marketing strategies to help consumers change their preferences (Awan, 2011).
Recycling/Repair/Reuse of Smartphones
As mentioned in the introduction, the mountain of e-waste has been growing globally with a significant contribution from improperly discarded smartphones. Currently, smartphone consumption patterns follow the “linear, take-make-waste” description of Awan and Sroufe (2022). For many countries, including the UAE, the challenge is to change this linear pattern into a circular pattern where mobile phones are safely disposed of, limiting their hazardous impact on the environment. The challenge is to understand the behavior of users of mobile phones, their understanding of the environmental impact of inappropriately discarded phones, their reluctance to move to green behavior, and the factors which might enable this move.
Studies that have examined the mobile phone disposal behavior have employed two theoretical approaches, namely, the Theory of Planned Behavior (TPB) and the Norm Activation Model (NAM) (both of which are discussed in more detail in the next section). Here, we cull out the essential aspects of mobile phone disposal behavior which will allow us to set up our hypotheses.
Environmental Awareness
Research shows that most old smartphones are simply stored at home (Suckling & Lee, 2015) or disposed of carelessly. Such behavior is most likely due to a lack of awareness of the hazardous consequences of throwing phones in the landfill and being unaware of the loss of precious components by hibernating phones in the drawer. Hence, the first step in recycling or reusing mobile phones is for users to overcome their urge to hold on to their phones.
One of the most critical factors in the sustainable management of e-waste is users’ knowledge of e-waste collection and recycling (Islam et al., 2020). As noted by Kumar (2019), awareness of consequences is expected to help the intention to recycle e-waste. A similar point is made by Welfens et al. (2016), who state that inadequate awareness may hinder recycling. Other studies that stress the relevance of awareness are Li et al. (2012), Tanskanen (2012), Baxter and Gram-Hanssen (2016), Islam et al. (2020), and Inghels and Bahlmann (2021). The large amount of literature on this aspect of user behavior allows us to articulate our first hypothesis.
H1: Awareness has a positive impact on the intention to dispose of mobile phones responsibly
Economic/Financial Incentives
Lack of incentives is seen as an important inhibitor of recycling behavior (Noman & Amin, 2017). Maheswari et al. (2018) discovered that most customers feel unfairly treated in the valuation of their old smartphone when opting for a “trade-in” scheme where they trade in an old smartphone for a new one to offset some of the cost of the purchase. These customers feel entitled to an incentive because they have already paid a recycling fee through taxes when first buying the phone and expect better incentives, especially since they are aware that their phones will be sold on the secondary market (Maheswari et al., 2018).
Welfens et al. (2016) note that economic incentives play an important role in encouraging users to recycle their phones. They report a variety of incentives that have been given to users; for example, in Germany, €2 is given per returned phone, and donations are given to charities. Inghels and Bahlmann (2021) have shown that financial incentives offer the most effective way to encourage recycling. Borthakur and Singh (2021) report that, in India, consumers always expect certain kinds of financial rewards when discarding their e-waste. In experiments run by C. Wang et al. (2021), monetary and non-monetary incentives were equally effective in getting users to recycle their phones. Dixit and Vaish (2015) list a few categories of incentives for India, such as financial incentives and charity donations, and report that financial incentives are the most effective. It may be noted that incentives by encouraging users to return their phones will ease the burden on reverse logistics of recycling used phones.
The widespread support in the literature for the important role that incentives play allows us to state our following hypothesis:
H2: Economic/financial incentives encourage users to recycle their phones
Barriers to Recycling
We consider two kinds of barriers to the recycling of phones. The first one is related to what Welfens et al. (2016) call personal factors that act as inhibitors to recycling. The second is related to external factors such as the infrastructure for recycling.
A significant barrier against recycling is data privacy concerns of the consumers. Consumers have deep concerns regarding how secure their data are since their old phones, which have gone for recycling, may still be linked to some of their accounts. Hence, theft of personal information may occur even after recycling (Litchfield et al., 2018). Rates of recycling are further reduced by customers’ preference who often use two phones because of a personal choice or the need to use a separate phone for different purposes, such as business and personal. Additionally, Litchfield et al. (2018) discovered that some consumers retain an older but still functioning smartphone when they might lose or damage their regular phone, such as during nights out or on foreign holidays.
Similarly, some consumers save their old phones as digital albums of memories that include photographs and text messages (Litchfield et al., 2018). Dasaklis et al. (2020, p. 2) also state that this is an issue for firms involved in the repair and refurbishing activity as the data remaining on the phone need to be handled according to the General Data Protection Regulation (GDPR) laws. Another critical barrier to recycling is what Y. Wang et al. (2020) call “nostalgia,” which creates an attachment to the product and encourages the user to keep the used phone instead of disposing of it responsibly. Since these barriers are likely to inhibit the recycling of phones, we state our next hypothesis as follows:
H3: Personal barriers discourage the recycling of mobile phones.
Infrastructure of Recycling
Reverse logistics is defined as: “the process of planning, implementing, and controlling the efficient, cost-effective flow of raw materials, in-process inventory, finished goods, and related information from the point of consumption to the point of origin for the purpose of recapturing or creating value or proper disposal” of products that have reached the end of their useful life due to damage, expiry or product failure (Rogers & Tibben-Lembke, 2001). The reverse logistics process of smartphones is often considered unimportant or too complex (Chan & Kai Chan, 2008), and hence firms tend to not indulge in it. Thus, although some original equipment manufacturers (OEMs) have a reverse logistics process in place, there is not enough investment or attention paid to this, leading to a higher level of e-waste being generated, which the current recycling technologies could easily avoid. The second set of barriers is thus related to the absence of infrastructure for recycling.
Li et al. (2012) noted that consumers believed that recycling costs should be shared by all stakeholders involved. Kollmuss and Agyeman (2010) found that consumers look for comfort and convenience as the main factors influencing their recycling decisions. It has also been noted that proximity to recycling points can significantly increase collection volumes (Tanskanen, 2012). Since the collection of old smartphones is the primary and most crucial step in the repair/reuse/recycle process, many initiatives emphasize the availability of many drop-off locations to enhance customer convenience and encourage recycling (Ding et al., 2018; Sidique et al., 2010). High collection rates will likely improve the viability of a reverse logistics system that requires high capital investment (Zufall et al., 2020). Thus, a well-developed infrastructure and recycling system, it is expected, would reduce discomfort, and enhances convenience, consequently leading to consumer recycling behavior. Thus, we can state our fourth hypothesis:
H4: Convenient infrastructure encourages the recycling of used mobile phones
Demographic Factors
Demographic variables also have an impact on consumer recycling behaviors. Saphores et al. (2006, p. 191) found that younger and more educated consumers have a greater awareness of recycling and are motivated by sustainable initiatives. A study focusing on mobile phones’ usage and recycling behavior among residents of Liverpool, UK discovered a strong relationship between age and gender with various factors that affect the usage of mobile phones (Speake & Yengke, 2015). Specifically, women are thought to be more willing to engage in recycling behaviors (Darby & Obara, 2005; Saphores et al., 2006). However, Welfens et al. (2016) feel that demographic variables may not be reliable factors for recycling. We state our demography related hypotheses as follows:
H5: Young users are more likely to participate in the recycling of mobile phones
H6: Women users are more likely to participate in the recycling of mobile phones
H7: Users with a higher level of education are more likely to participate in the recycling of mobile phones
A Model for Smartphone Disposal
Two theories have been employed in the area of modeling environment-related behavior of individuals, especially related to the disposal of smartphones. The first is the Theory of Planned Behavior (TPB), one of the most widely used approaches to studying individual behavior, and the second is the Norm Activation Model (NAM). While we will be using concepts from the TPB quite extensively in our research, we will also highlight some elements of the other approach.
In the context of TPB, Ajzen (1991) explains the key factors which determine an individual’s decision to perform a particular behavior. As far as this research is concerned, the behavior in question relates to the disposal of the used smartphone when the individual purchases a new one. As Ajzen and Kruglanski (2019) elaborate, behavioral intention is determined by three behavior-centered factors: attitude toward the behavior, subjective norms concerning the behavior, and perceived control over the behavior.
Attitude toward a behavior is assumed to be a function of readily accessible beliefs regarding the behavior's likely consequences and these are termed behavioral beliefs (Ajzen, 2020). Yuriev et al. (2020) explain that the advantages and disadvantages of performing a certain behavior are termed behavioral beliefs. In the context of this research, the users’ understanding and knowledge that responsibly disposing of their used smartphones will help the environment is likely to beneficially affect the individual’s attitude toward responsible behavior. From the perspective of NAM, behavior is influenced by internal and external factors, which may act as barriers or drivers (Welfens et al., 2016). The internal norms of NAM are relevant here, especially the factor of “knowledge,” which may help or hinder a person’s awareness of recycling smartphones. We have labeled this awareness as ENVIRON in our later discussion.
The subjective norm construct in the TPB distinguishes between injunctive and descriptive norms (Ajzen & Kruglanski, 2019). Injunctive norm refers to the expectation that the individual’s group (friends, family, etc.) approve or disapprove of the behavior in question, while descriptive norms refer to the beliefs of whether the members of the individual’s group perform that behavior. The subjective norm relates closely with the internal factors of NAM, especially those related to personal and social norms. Welfens et al. (2016) make an important point in this context: approval or disapproval by others of one’s behavior is unlikely to matter since others rarely see the recycling of mobile phones. Further, one’s peer group members are unlikely to see how many used mobile phones one has hoarded in one’s drawer.
Finally, perceived behavioral control refers to factors that may encourage or discourage the behavior of interest (Yuriev et al., 2020). These factors may include the individual’s skills and abilities, availability or lack of time, money and other resources, and cooperation from other people (Ajzen & Kruglanski, 2019). In a later discussion, we have labeled the factor that discourages responsible disposal of mobile phones as BARRIERS. In the context of NAM, these are referred to as external factors. Two of these are particularly relevant (Welfens et al., 2016): economic incentives that compensate smartphone owners if they recycle their phones and infrastructure that eases the burden of recycling phones. These two factors have been called INCENTIVES and LOGISTICS in our empirical exercises.
Methodology
As stated in the introduction, our research is located in the UAE. We carried out primary data collection to elicit information about consumers’ awareness regarding e-waste and recycling as well as opinions and preferences regarding the usage and disposal of their used phones. A questionnaire-based survey was chosen as the data collection method because it is one of the primary methods used for descriptive research (Saunders et al., 2019) and helps collect a large amount of data. Additionally, surveys naturally lend ease to quantitative data analysis due to standardized responses (Saunders et al., 2019).
Questionnaire Design and Distribution
The questionnaire consisted of five major sections. The first section sought information on demographic factors such as the emirate in which the respondent lived (there are seven emirates in the UAE, and respondents were asked to indicate their emirate of residence), respondent’s age (four age groups were considered: 18–25, 26–35, 36–65 and 66+ years), gender (male or female) and highest education level (four levels were considered: High School Diploma, Undergraduate Degree, Postgraduate Degree, Doctorate or higher). Findings from the literature have indicated that these demographic factors are associated with recycling attitudes and behaviors.
The second section of the questionnaire examined current behaviors in smartphone usage (whether respondents own a smartphone or not; whether they own a second-hand phone or not; whether they own a repaired phone or not, how frequently they replaced their smartphones). The most important question in this section asked what the respondents did with their smartphones when they bought a new one. The options given were: leave it in a drawer, throw it away with my regular garbage, recycle it, exchange it, sell it, pass it on to a friend or family member or donate it.
The third section contained questions designed to gauge awareness of the importance of recycling smartphones. This included questions regarding awareness of the possibility of recycling, environmental consequences of incorrect disposal of smartphones, knowledge of e-waste, and health effects of e-waste. The options to these questions were on a five-point Likert scale ranging from agree strongly to disagree strongly.
The fourth section included questions to determine what kind of reverse logistics facilities would encourage users to recycle their phones. The options to these questions were also on a five-point Likert scale ranging from agree strongly to disagree strongly. Finally, the fifth section contained questions on the personal barriers customers face with respect to their recycling behaviors. Questions in this section were also on a five-point Likert scale as in the previous section.
Approval for our data collection was obtained from the Research Ethics Committee of the institution to which the authors belong. The questionnaire was created using Qualtrics and distributed using social media.
Statistical Analysis
An important step toward carrying out statistical analysis is whether the questionnaire that has been used to elicit information from respondents allows us to measure and create variables or factors that may be used in the analysis. The questionnaire was created to measure the attitudes, concerns, barriers, and incentives toward the disposal of used phones. In this context, the validity of the questionnaire needs to be examined. The validity of a questionnaire is concerned with examining whether the questionnaire measures what it is intended to measure (Tsang et al., 2017). Exploratory Factor Analysis (EFA) may be used for this purpose. EFA is a statistical approach to identify the smallest number of theoretical constructs that parsimoniously explain the covariation observed among the variables measured by the questionnaire (Watkins, 2018). We will be following what Knekta et al. (2019) have called validity based on the internal structure of the questionnaire. According to them, investigating the internal structure of an instrument is essential to combine several variables to represent a construct, which can be accomplished using factor analysis. Subsequent to our factor analysis exercise, we used Cronbach’s alpha to measure the reliability of including specific questions in a factor. Cronbach’s alpha is quite commonly used as a measure of scale reliability or internal consistency (Taber, 2018). The alpha is expected to lie between 0 and 1 and a high value is generally desirable. Many studies have reported results where the alpha is greater than 0.7 (Taber, 2018).
Logistic Regression
An essential step in our statistical analysis is the estimation of logistic regression to explain the mobile phone disposal behavior of users. A logistic model is employed when the dependent variable is binary. The logistic regression is a non-linear model that forces the dependent variable’s predicted values to lie between 0 and 1. The model is presented in Equation 1 (Cameron & Trivedi, 2005)

Where, Pr denotes probability and, in the simplest case,
Denoting Pr (Yi = 1) as p,


p/(1−p) is called the odds ratio and gives the probability that Yi = 1, relative to the probability that Yi = 0.
Multinomial Logistic Model
The logistic model is used when there are two options, that is, when the dependent variable is binary. Computing probabilities when there are more than two options is a little more complicated (See Borooah, 2002; Greene, 2012).
Given M options, it can be shown that for a random variable Yi, whose values indicate the choice (m) of respondent i is given by:

Because these probabilities add up to 1, only (M− 1) of the probabilities can be determined independently. Hence, there is indeterminacy since the multinomial model has M equations. The indeterminacy is solved by setting one of the M choices (say, the first) as the base category (Cameron & Trivedi, 2009).
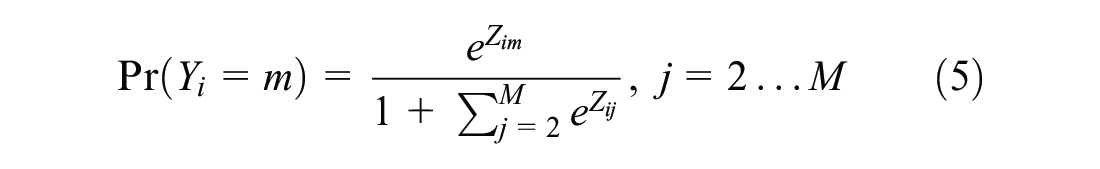
As in the case of the logistic model discussed earlier, the relative risk of choosing alternative j instead of alternative 1 is given by

This specification permits the computation of the relative risk ratios (RRR). We elaborate on this in sub-section 5.2.
Results and Discussion
Convenience sampling approach was used to disseminate the survey during the period May–June of 2020. The questionnaire was designed using the software Qualtrics. It may be mentioned that primary data collection occurred during the summer of 2020 when the UAE was under a lockdown due to the coronavirus Covid-19 pandemic. Given the circumstances, convenience sampling approach worked best since it allowed us to tap into a pool of respondents that was available to use through social media. Our survey was primarily disseminated through the social networking medium of LinkedIn. Though the survey was distributed through online means, no personal or identifiable data such as I.P. addresses were collected, thereby ensuring the anonymity of the respondents.
A total of 410 survey responses were collected. However, some surveys were not fully completed and could not be used. Three hundred thirty-nine surveys were considered usable and form the basis of the analysis of the UAE, which had a population of 11.1 million in 2020 (IMF, n.d.). The sample size that we use is comparable to Saphores et al. (2006), who used a sample of 357 respondents for California, which had a population of 35.6 million in 2004 (United States Census Bureau, 2010). Also, Inghels and Bahlmann (2021) used a sample of 296 respondents for the Netherlands, which had a population of 17.4 million in 2019 (CBS, 2020).
Profile of Respondents
Out of the 339 respondents, the overwhelming majority belonged to the emirate of Dubai, followed by Sharjah and then Abu Dhabi. Two other emirates—Ajman and Fujairah—contributed only eight respondents. Other demographic characteristics of our sample are given in Table 1.
Demographic Characteristics of the Sample.

The distribution of males and females is reasonably balanced. Dividing the sample into two groups—those below the age of 40 and those above—we had 68% of the respondents in the younger age group and the remainder in the older age group. Finally, 57% of the respondents had an undergraduate degree or lower level of education, while 43% had a Postgraduate degree or higher.
Phone Ownership Characteristics
We next look at the sample’s phone ownership characteristics, which are listed in Table 2.
Phone Ownership Characteristics.

Table 2 tells us that everyone, barring one individual, owns a smartphone. Twenty-three percent of respondents reported using a repaired own. The modal replacement time is 3 years, with 36% reporting this value. Overall, 93.5% of the respondents used the phone for at least 2 years. From the point of the research in this paper, the last characteristic—disposal of the old phone—is very important. Numerous surveys have reported rates of hibernation of old phones in different countries, but international data are hard to come by. Inghels and Bahlmann (2021) report hibernation rates from 18 studies for about 15 countries, ranging from a high of 84% in Finland to a low of 40% in South Korea. The average hibernation rate is seen to be 56%. From Table 2, the rate of hibernation for the UAE (“leaving the phone in the drawer”) works out to 44%, which, though less than the average rate reported in Inghels and Bahlmann (2021), is still very high and represents a significant loss.
Extracting Factors From the Questionnaire
Before we extract factors from our questionnaire, one must guard against the problem of Common Methods Bias (CMB). Tehseen et al. (2017) point out that in self-reported questionnaires, one variable’s estimated impact on other variables is at risk of being biased. The single-factor Harman’s test is used to check for the CMB. The test involves loading all measures of the questionnaire into exploratory factor analysis. If a single factor emerges or a dominant factor accounts for most of the variance in the measures, a CMB exists. For our questionnaire, more than one factor was identified, and the most dominant factor accounted for just 17% of the variance in the measures.
Having satisfied ourselves that we do not face the CMB, we proceeded to extract the constructs required for our model. As stated earlier, this is an important step in examining what has been called validity based on the internal structure of the questionnaire (Knekta et al., 2019). To begin with, we permitted the SPSS software to determine the number of factors that could be extracted from the items in our questionnaire. SPSS estimated the presence of six factors, but the fifth and sixth factors were composed of only two items and one item. It was also not possible to provide a meaningful interpretation for the fifth and sixth factors. In view of this, we carried out the factor analysis restricting the number of factors to four. Table 3 shows the rotated component matrix, which reports the Pearson correlations (factor loadings) between the items and the factors.
Rotated Component Matrix.

Jenssens et al. (2008) note that the assignment of items to factors is subjective and depends on the researcher’s judgment. However, they do indicate a minimum value of factor loading for various sample sizes (Jenssens et al., 2008, Table 7.2, p. 261). The minimum factor loading for our sample size of 339 would be 0.30. Based on this guideline and our judgment, we have identified four factors that we plan to use in the later analysis. We will further conduct a reliability analysis to examine if the items identified in Table 3 can be combined into a factor.
Construct: ENVIRON
The construct ENVIRON relates to environmental awareness and beliefs. These, as per the TPB, are likely to affect the individual’s attitudes toward the behavior of interest. Table 3 lists this as Factor 1. Awareness of the adverse consequences of incorrect disposal of used phones and the awareness of the possibility of reusing and recycling phones is likely to be an important first step toward more responsible behavior. Table 4 reports responses to the various dimensions of ENVIRON.
Environmental Awareness About Smartphones.
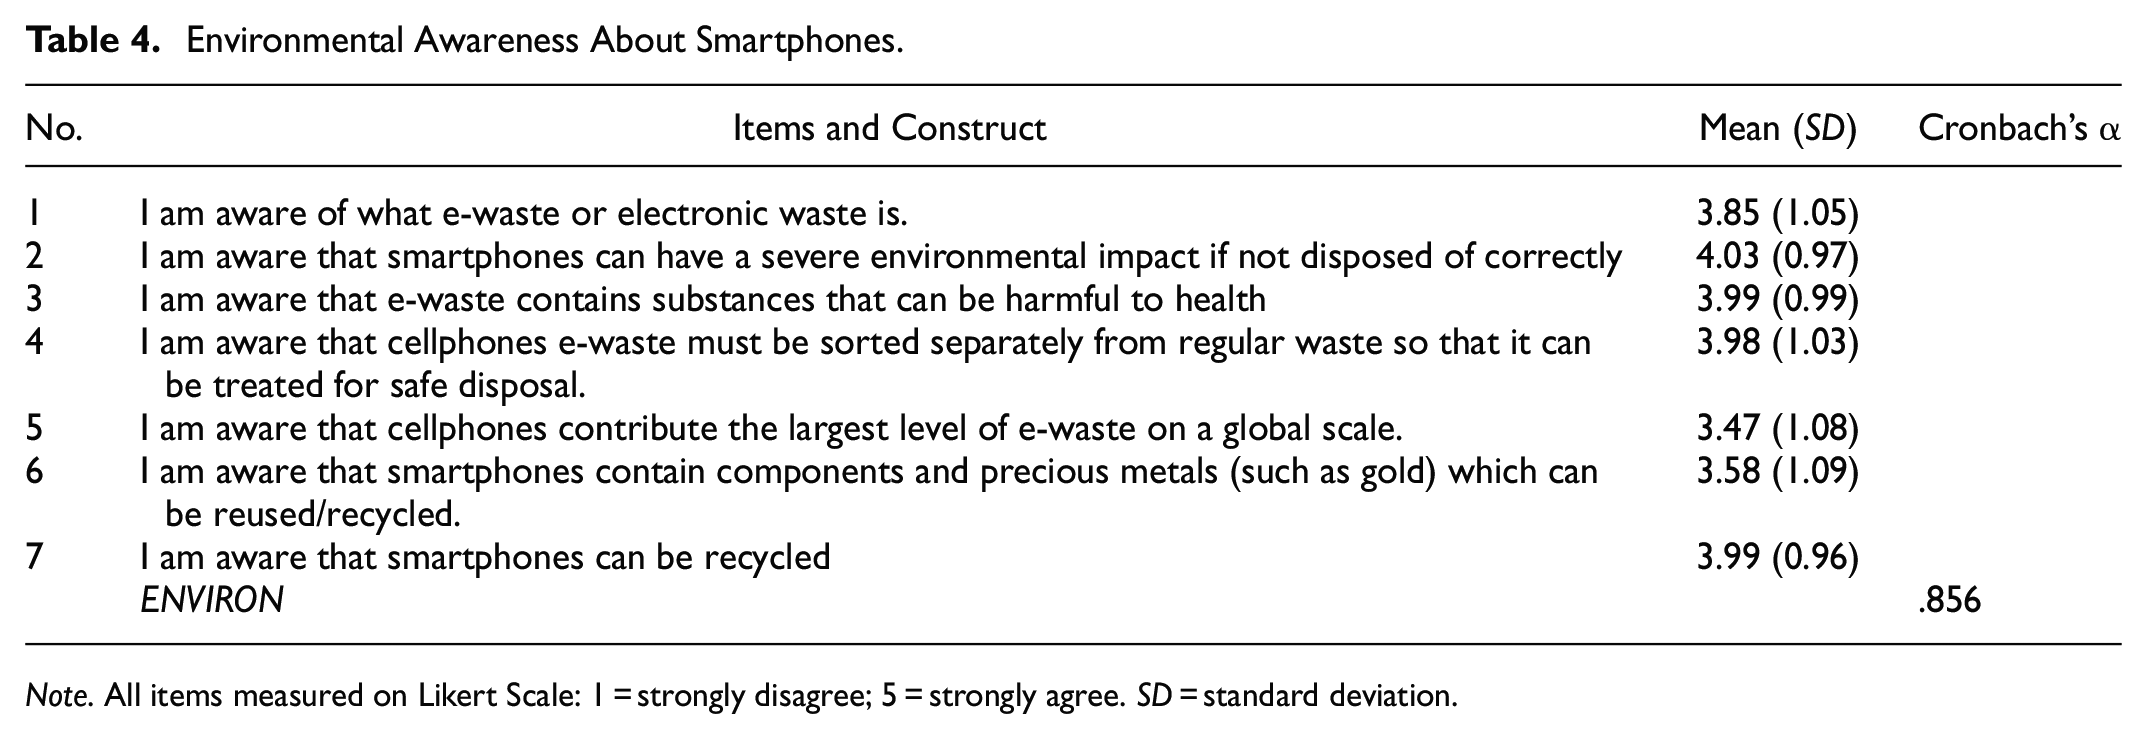
Note. All items measured on Likert Scale: 1 = strongly disagree; 5 = strongly agree. SD = standard deviation.
The average value for each of the seven items listed in Table 4 is significantly above 3 (the value at which the respondent neither agrees nor disagrees). This indicates that respondents display a high degree of environmental awareness of the various dimensions regarding the disposal of phones. As reported earlier, we carried out a detailed factor analysis to examine if the seven items listed in Table 4 could be attributed to a factor called ENVIRON. The factor was tested for internal consistency using Cronbach’s α, which had a value of .856. This reliability analysis gives us the confidence that these items can be included under the factor ENVIRON.
Having established that the factor ENVIRON encapsulates the various items listed in Table 4, we investigate whether differences in Gender, Age, and Education Levels are relevant in determining environmental awareness. Table 5 reports these results.
ENVIRON According to Gender, Age and Education Levels.

Notes. T-statistics derived for Independent Samples T-test.
Significant at 1% level. **Significant at 5% level. *Significant at 10% level.
Considering the differentiator Gender first, we find that the mean of ENVIRON for females is 3.705 compared to that for males, which is 4.003. The difference between the two is significant at the 1% level of significance. Males seem to display a much higher degree of environmental awareness regarding smartphones and their disposal.
Age as a differentiator throws up a result that shows the older age group to be more aware of the disposal of smartphones than the younger group. The mean of ENVIRON of the older group is almost 5% higher than the other group, and the difference is significant at the 5% level.
Finally, the differentiator Education throws up an intuitively appealing result, with those having a Postgraduate degree or above displaying a higher degree of environmental awareness than those with lower education. The mean of ENVIRON for the Postgraduate and above group is over 6% higher than the other group and is significant at the 5% level.
Construct: ECONOMIC
The NAM approach considers economic incentives an important internal factor affecting recycling behavior (Welfens et al., 2016). The items covered under the construct ECONOMIC look at elements that would encourage the user to recycle his or her phone and are listed as Factor 3 in Table 3. The three items that make up this construct focus on some rewards for recycling. Table 6 gives details of the various dimensions of ECONOMIC.
Economic Incentives for Recycling Smartphones.

The average values in Table 6 are significantly above 3 (in fact, they are significantly above 4). Including all the three factors in creating the ECONOMIC factor yields a Cronbach’s alpha value of .919, which is a strong indication that these factors can be combined into one factor.
Having created the factor ECONOMIC, we investigate whether differences in Gender, Age, and Education Levels are important for economic incentives. Table 7 reports these results.
ECONOMIC According to Gender, Age and Education Levels.

Note. See note to Table 4.
The mean value of ECONOMIC does not differ among the groups differentiated by Gender or Education, but it does according to Age. Those individuals aged less than 40 years show a significantly higher mean value than those 40 years or older.
Construct: BARRIERS
The third set of items we look at are labeled as BARRIERS to reuse or recycling behavior and are listed as Factor 2 in Table 3. These barriers include a variety of reasons why users do not reuse or recycle their phones, ranging from sentimental value attached to the phone to concerns about privacy. Welfens et al. (2016) have noted that users get to be very fond of their phones and are also concerned about information stored on the phone which cannot easily be erased. These barriers are part of Perceived Behavioral Control, a vital part of TPB and based on accessible control beliefs (Ajzen & Kruglanski, 2019). As noted above, these beliefs are related to factors that may help or hinder the behavior of interest. Table 8 lists these items.
Barriers to Recycling Smartphones.

The average values of the items in Table 8 are much lower than those obtained in Table 5. Nonetheless, barring two, all the items have a mean value above 3, indicating a reluctance or a barrier to recycling phones. Including all the three factors in creating the BARRIERS factor yields a Cronbach’s alpha value of .747. Table 9 examines BARRIERS with respect to Gender, Age and Education Levels.
BARRIERS According to Gender, Age and Education Levels.

Note. See note to Table 4.
The construct BARRIERS seems to differ only for the differentiator Age. Those less than 40 years have a mean value that is almost 10% higher than that for the older age group.
Construct: LOGISTICS
Reverse logistics infrastructure has been found to be an important external factor that motivates responsible disposal of smartphones (Welfens et al., 2016). This factor will include ease of collection points for returning used smartphones. As per the TPB approach, this construct will be one of the factors that will help or hinder responsible behavior (Ajzen & Kruglanski, 2019). The items included under this construct are listed under Factor 4 in Table 3. Table 10 lists these items along with their means and standard deviations.
Logistical Issues in Recycling Smartphones.
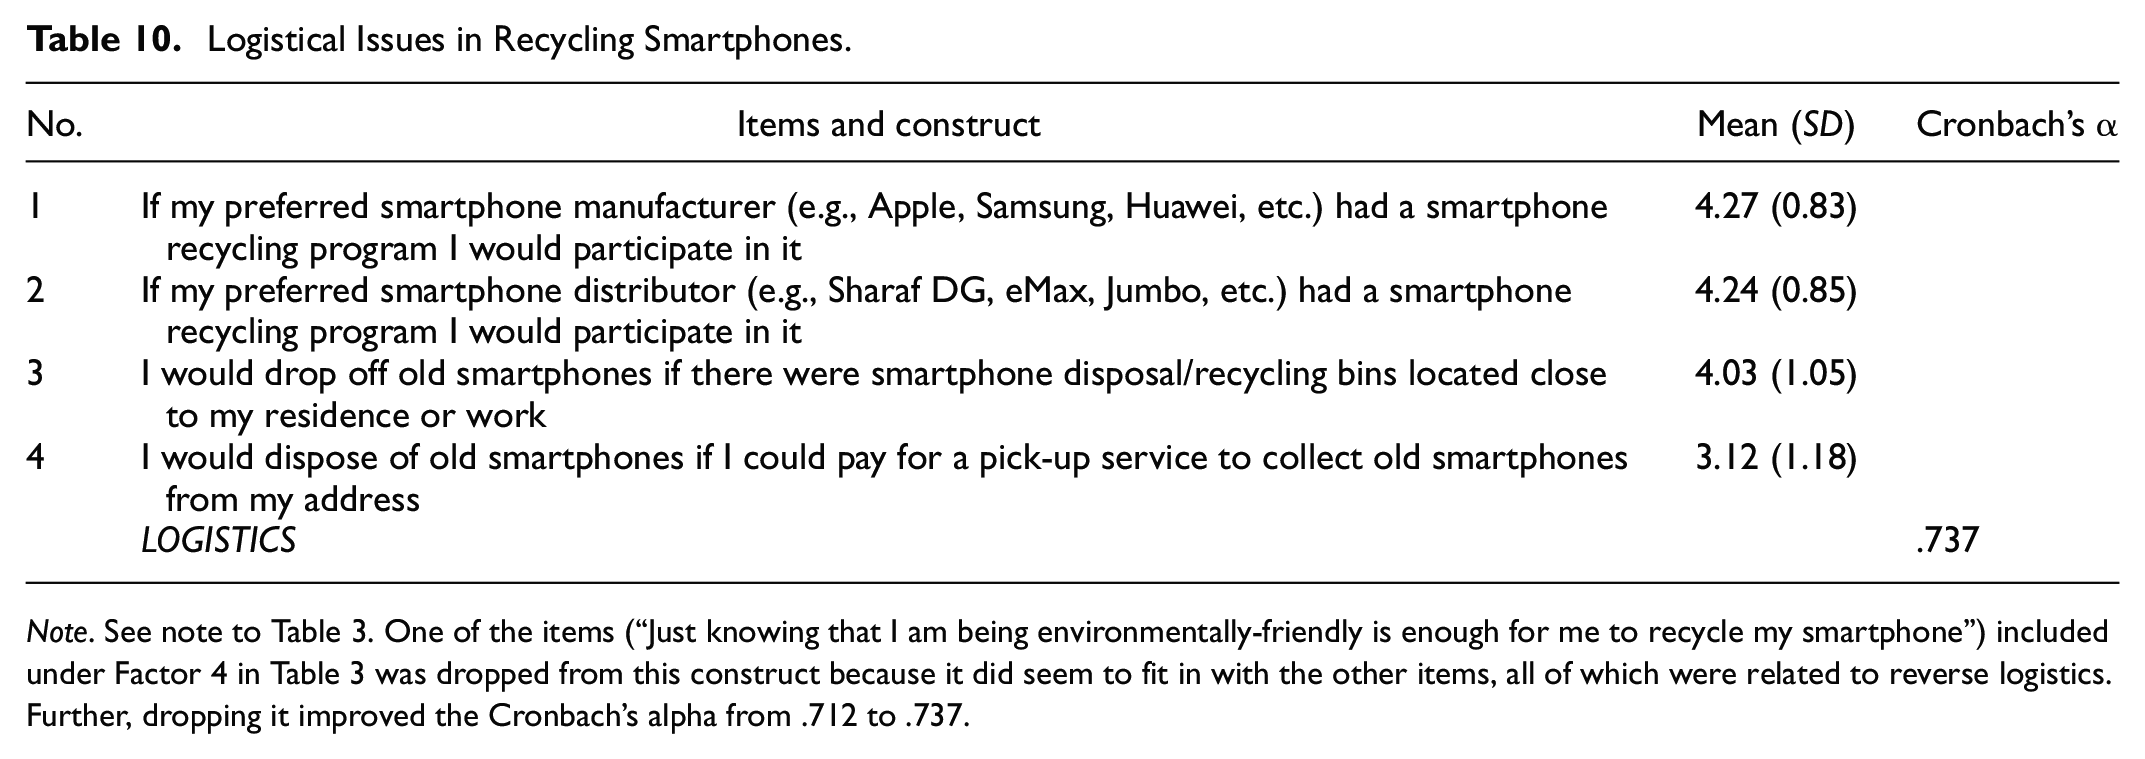
Note. See note to Table 3. One of the items (“Just knowing that I am being environmentally-friendly is enough for me to recycle my smartphone”) included under Factor 4 in Table 3 was dropped from this construct because it did seem to fit in with the other items, all of which were related to reverse logistics. Further, dropping it improved the Cronbach’s alpha from .712 to .737.
The average values of the items in Table 10 are significantly above 3 (in fact, they are significantly above 4) except for the last one. Including all the four items to create the LOGISTICS factor yields a Cronbach’s alpha value of .737.
The construct LOGISTICS is further examined with respect to Gender, Age, and Education Levels. Table 11 reports these results.
LOGISTICS According to Gender, Age and Education Levels.
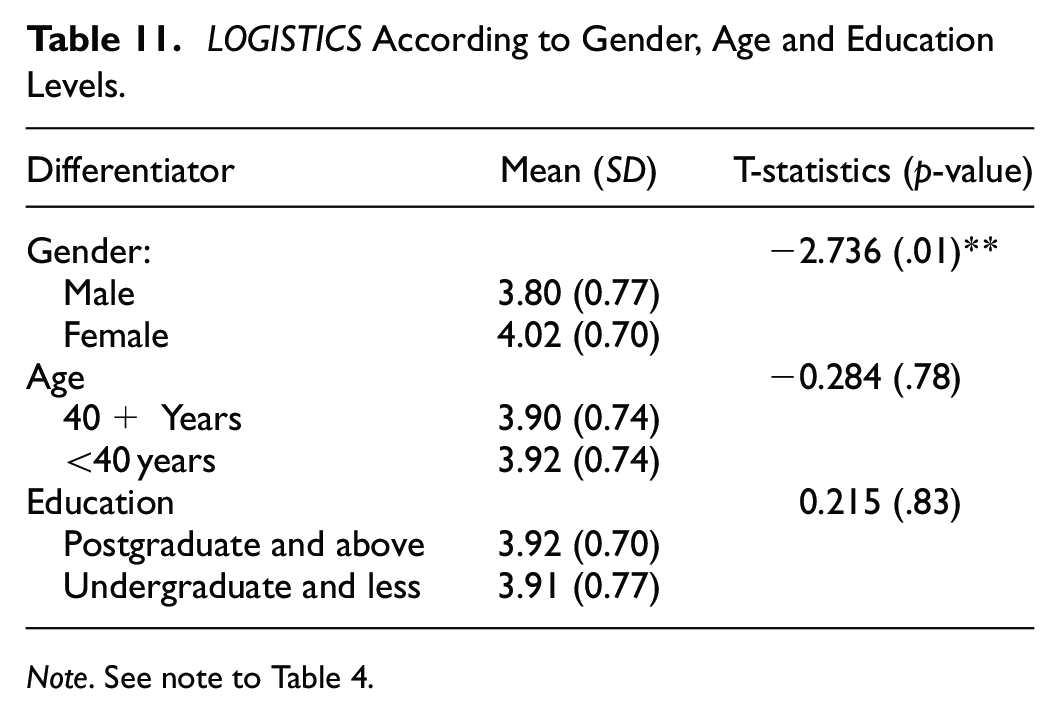
Note. See note to Table 4.
The construct LOGISTICS shows a significant difference considering Gender as a differentiator but not when considering Age or Education.
Estimating the Phone Disposal Model
A phone that a user has stopped using is disposed of in two ways. It is either (a) disposed of responsibly by being recycled or reused, or (b) disposed of irresponsibly, ending up either in a landfill or in a drawer. The second option, labeled hibernation, represents a dangerous addition to e-waste and loss of precious components with significant economic value. Which of these two behaviors will an individual choose? And importantly, from the point of view of research in this area, which factors will encourage one type of behavior as opposed to the other?
Logistic Models
Our discussion of the insights from the Theory of Planned Behavior and Norm Activation model in the previous sections has enabled us to identify four constructs that may be used to explain phone disposal behavior. In this section, we investigate the importance of various factors that encourage responsible disposal of phones as well as factors that work against such behavior. We will be estimating a logistic model for this purpose. The logistic model (as given in Equation (1) earlier) is written in the specific form as follows:

Where,
RECYCLING = 1, if a user disposes of a used phone responsibly by recycling/donating/exchanging/selling it
=0, if a user discards the phone in a landfill or stores it in a drawer
Writing the above model as a ratio of the log odds yields:


ENVIRON, ECONOMIC, BARRIERS, and LOGISTICS are the constructs we created earlier in the paper. AGE, GENDER, and EDUCATION are the demographic variables.
α1, α2, α3, α4, α5, α6, and α7 are the log odds (i.e., log[p/(1-p)]) of RECYCLING = 1. It should also be noted that exp(αi) will yield the odds ratio of disposing of a phone responsibly to not doing so.
Table 12 reports our estimated equations. Equation 1 is a parsimonious model with only the four factors—ENVIRON, ECONOMIC, BARRIERS, and LOGISTICS—included. Equation 2 extends this by adding the three demographic variables.
Estimated Logistic Equations.

Notes. a This gives the correct classification of the estimated values of RECYCLING that is, when estimated RECYCLING (1 or 0) equals the actual RECYCLING (1 or 0). It may be noted that when the estimated probability of RECYCLING > .5, it is classified as 1.
Hosmer-Lemeshow is a test of goodness of fit for logistic models. A low p-value (less than .05) indicates a poor model, The null hypothesis for this test is that the model has a good fit.
Beginning with a summary evaluation of our models, we find that our models are satisfactory. The L.R. ratio being significant shows that our models fit the data well. The measure of correct classification (please see the note to Table 12) shows a good percentage of more than 62%. Finally, the p-values of the Hosmer-Lemeshow goodness-of-fit test are greater than 0.05, indicating a good fit of the models. We now carry out a detailed discussion of our models.
In Equation 1, we find that ENVIRON has a strongly significant and positive coefficient indicating that an increase in environmental awareness increases the log odds in favor of responsible disposal. The factor ENVIRON continues to display a positive and significant coefficient even in the presence of AGE, GENDER, and EDUCATION (Equation 2). The odds ratio for the estimated Equations 1 and 2 is the same, namely, 1.79 (=e0.5842), implying that the odds of responsible disposal of the phone is 1.79 times that of throwing it away or hibernating it. Our results related to ENVIRON accord with those reported by Tanskanen (2012), who pointed out that “consumer convenience and awareness are the key points that will encourage them [consumers] to start recycling.”Islam et al. (2020) also report that awareness of e-waste collection and recycling programs is considered one of the critical success factors for sustainable e-waste management. The importance of environmental awareness has also been noted by Li et al. (2012), Baxter and Gram-Hanssen (2016), Welfens et al. (2016), and Inghels and Bahlmann (2021), among others.
The factor ECONOMIC, related to economic incentives for promoting responsible behavior, does not seem to significantly affect RECYCLING in any of the equations. The fact that the coefficients of ECONOMIC are virtually zero indicates that the log odds of responsible disposal are no different from hibernating/throwing the phone. This result is at odds with the results reported in Table 6 in which each item in the construct ECONOMIC had an average response value above 4, indicating that respondents unambiguously agreed that economic incentives would encourage them to shift toward responsible disposal of phones. However, these responses do not translate into action in the absence of actual incentives. Inghels and Bahlmann (2021) report that their respondents would have been more inclined to recycle their phones if they were offered more discounts on the purchase of new phones. Similar survey results have been reported by Borthakur and Singh (2021) and Islam et al. (2020). C. Wang et al. (2021) is a noteworthy exception in that they have carried out experiments to examine the impact of monetary versus non-monetary incentives on recycling behavior and found that both are equally effective. While many studies have reported survey results concerning incentives, very few have sought to estimate an equation to explain disposal behavior using incentives as an explanatory variable as we have tried to do.
The coefficients of BARRIERS are negative and significant in Equations 1 and 2 but only weakly so in Equation 2. The negative coefficient indicates that the log odds of responsible phone disposal decrease with the rise in BARRIERS. The odds ratio in Equation 1 is 0.698 (=e-0.3592), indicating that the odds of responsible disposal are roughly 0.70 (0.72 in Equation 2) times that of hibernating or throwing it away. Our results clearly show the role that barriers play in discouraging responsible behavior. Even though Kollmuss and Agyeman (2010) do not estimate the quantitative effect of barriers, they also clearly state that such barriers are responsible for the wedge between environmental attitudes and pro-environmental behavior. Welfens et al. (2016), in their discussion of NAM, have noted the internal and external factors that may inhibit the responsible disposal of phones and our results confirm their expectation. Baxter and Gram-Hanssen (2016) suggest that it is not so much ignorance of the process of recycling that is a barrier to responsible behavior as the need to keep used phones as spares and concerns about security.
The coefficient of LOGISTICS is negative but not significant in either of the equations in Table 12. Kochan et al. (2016) find that the perceived convenience of e-waste recycling relates positively to the intention to recycle, which in turn relates positively to recycling behavior. Convenience is understood as numerous drop-off points for e-waste as well as the proximity of recycling points. This understanding of convenience maps closely with the four items that are used to create the construct LOGISTICS (Table 10). We also found that the average response to three of those items was more than 4, indicating agreement with the statement. Yet, the factor LOGISTICS is not significant in our estimated logistic equations.
Saphores et al. (2006) have investigated the importance of demographic variables in the willingness to recycle e-waste. Our first demographic variable AGE has a positive coefficient in Equation 2 and is seen to be significant. The positive coefficient in Table 12 suggests that the log odds in favor of responsible disposal increase as AGE increases. This result is similar to the effect of age reported by Saphores et al. (2006), wherein older persons were more prone to recycling behavior. Similar results are also reported by Islam et al. (2020).
The coefficient of GENDER, though positive, is seen to be not significant and hence the odds in favor of responsible disposal to hibernating/throwing are equal. This result is surprising since quite a few studies have found that women are much more willing to undertake the recycling of e-waste (Saphores et al., 2006). Inghels and Bahlmann (2021) found a difference between genders and intention to recycle though Islam et al. (2020) did not find any association between gender and method of disposal of mobile phones.
Finally, the coefficient of EDUCATION provides a counter-intuitive result in that it is negative and weakly significant. The odds ratio in Equation 2 is 0.6863 (=e-0.3764) indicating that the odds of responsibly disposing of the phone are roughly 0.69 times that of hibernating/throwing it. Saphores et al. (2006) report a more expected result of the effect of education, namely, higher education improves the likelihood of recycling. A possible explanation for our results is that those with higher education may also be more acutely aware of data privacy concerns (see item number 2 in Table 8) which works against their incentive to recycle. Further, in the absence of a systematic collection of phones for recycling, the more educated might see storing their phones in their drawers as the lesser evil.
Robustness Check
In this sub-section, we carry out two robustness checks. In the first instance, we estimate logistic equations once again but confine our attention to the emirate of Dubai only. It may be noted that 63% of our usable surveys were from Dubai. Table 13 reports the equations.
Estimated Logit Equations: Dubai.
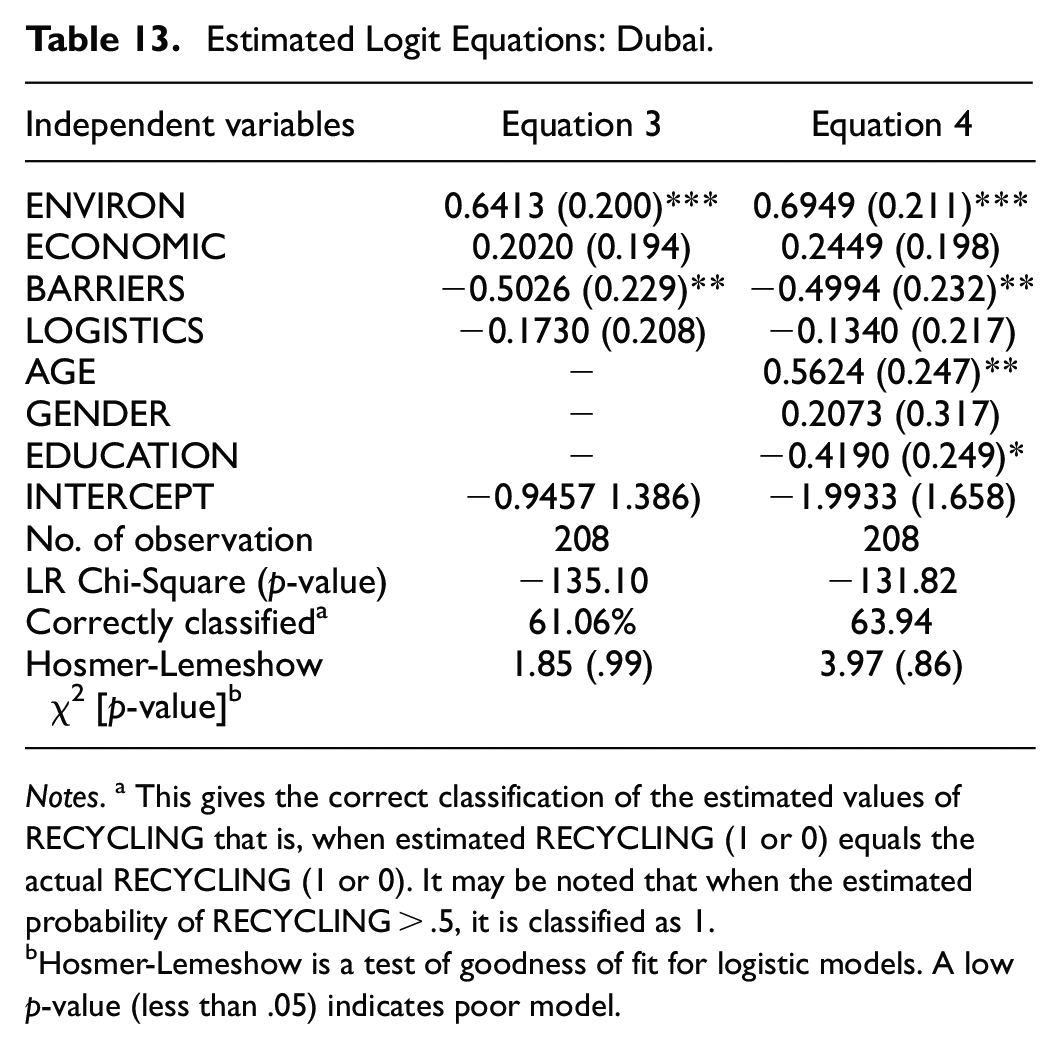
Notes. a This gives the correct classification of the estimated values of RECYCLING that is, when estimated RECYCLING (1 or 0) equals the actual RECYCLING (1 or 0). It may be noted that when the estimated probability of RECYCLING > .5, it is classified as 1.
Hosmer-Lemeshow is a test of goodness of fit for logistic models. A low p-value (less than .05) indicates poor model.
We do not carry out a detailed discussion of the models estimated in Table 13. Suffice it to note that both the equations display satisfactory values for the L.R. Chi-square test, correct classification of RECYCLING, and the Hosmer-Lemeshow test. Considering the performance of the explanatory variables, we can see that the coefficients estimated for the two equations are by and large very similar to those reported in Table 12. This gives us the confidence to claim that the results obtained for our RECYCLING behavior equation are reliable and robust to a change of sample.
For our second robustness check we estimate a multinomial logistic model (see Islam et al., 2020 for such a model). In formulating our logistic model, we had combined the responses (that we had obtained to the question regarding disposal of mobile phones) into a binary variable called RECYCLING. Even though our results were very informative about the behavior of mobile phone users in the UAE, we would like to be sure that we have not lost out on crucial information by creating the binary variable.
In the multinomial logistic model that we will use, the dependent variable takes on four unordered values: 1 = the used phone is recycled; 2 = the phone is donated; 3 = the used phone is exchanged or sold; 4 = the used phone is thrown or kept in a drawer. As required to estimate a multinomial logistic model, we have chosen to make choice number 4 (representing “used phone is thrown or kept in the drawer”) as the base category. Table 14 reports the relative risk ratio (RRR) for each choice of disposal relative to hibernating/throwing the used mobile phone. To explain the RRR, we take the example of column (1) in Table 14, and we write the equation which corresponds to Equation (6) in section 3.2.2:

Estimated Relative Risk-Ratios of the Multinomial Equation.

Note. The number of observations equals 329. The LR Chi-Square [p-value]: 56.48 [.000]***. The overall effect of each of the independent variables is tested in the last column of the table which reports the Chi-Square [p-value]. RRR = relative risk ratio.
Taking logs of the above equation yields:

where Z is as defined above in section 5.1
The relative risk ratios (RRR) =exp(
We can see that the RRR for ENVIRON is greater than 1, indicating that environmental awareness encourages users to recycle their phones instead of throwing or hibernating it. The result is strongly significant for the donating option (column 2) and significant for the sell/exchange option (column 3). The overall effect of ENVIRON (seen in the last column) shows the importance of this variable and reinforces the result we have obtained in Table 12 with the logistic model. The RRR of ECONOMIC is also greater than 1, but it is not significant, which corroborates our results from the earlier logistic exercise. The RRR of BARRIERS is less than 1 and is weakly significant in column 1 but highly significant in column 3. This shows that it is important that barriers to recycling be reduced to elicit responsible behavior from users of smartphones. The RRR of LOGISTICS was not significant in any of the columns. The RRR for AGE is greater than 1, but it is highly significant only for column 2. The results with respect to GENDER and EDUCATION are in consonance with those obtained in Table 12.
Overall, we can conclude that the multinomial logistic exercise has given support to the result obtained with the logistic exercise. The two most important variables in both the exercises have been ENVIRON and BARRIERS. Among the demographic variables, AGE is the most important.
Findings and Recommendations
Before carrying out our econometric exercises in the previous section, we had put forward hypotheses that we had distilled from our literature review. We now examine which of our hypotheses have been validated by our exercises.
Our first hypothesis was:
H1: Awareness has a positive impact on the intention to dispose of mobile phones responsibly
We created the construct ENVIRON to represent the environmental awareness of phone users. Our logistic estimation exercise helps us to accept this hypothesis unhesitatingly. The coefficient for this construct was positive and significant.
The second hypothesis stated:
H2: Economic/financial incentives encourage users to recycle their phones
Despite the importance of this factor, as noted in numerous studies, our results for the construct ECONOMIC were weak. The coefficient for this construct, though positive, was not significant. Hence, we are unable to accept this hypothesis.
The third hypothesis stated:
H3: Personal barriers discourage the recycling of mobile phones.
The coefficient associated with the construct BARRIERS was negative and significant, leading us to accept the hypothesis. The negative coefficient for this construct indicated that an increase in BARRIERS reduces the odds in favor of recycling.
Our fourth hypothesis was:
H4: Convenient infrastructure encourages the recycling of used mobile phones
The coefficient associated with LOGISTICS was not significant, and we could not accept this hypothesis. The items included to create the construct had indicated that the convenience of collection and proximity of used phone collection points would help users recycle their phones.
The last set of hypotheses dealt with demographic factors:
H5: Young users are more likely to participate in the recycling of mobile phones
H6: Women users are more likely to participate in the recycling of mobile phones
H7: Users with a higher level of education are more likely to participate in the recycling of mobile phones
Contrary to received wisdom, we found that increasing AGE increased the chances of recycling, so H5 was rejected. We were unable to accept H6 since the GENDER variable was non-significant. Finally, the variable EDUCATION yielded a weak but counter-intuitive result: more educated persons seemed more reluctant to recycle their used phones.
Having considered the validity or otherwise of our hypotheses, we now put forward some recommendations that would help improve the recycling of smartphones in the UAE.
Our results show some promising avenues for improving the rate of recycling phones in the UAE and in other societies as well. Enhancing awareness is clearly important in the effort to recycle used phones and, possibly, e-waste in general. Governments at various levels but especially at local levels, need to develop community awareness and inculcate responsible behavior in schools (Government of Dubai, n.d). Ikram et al. (2021) put forward the interesting point that growing awareness of the environmental impact of e-waste will likely impose pressure on firms to ease the process of recycling phones. Nanath and Ajit Kumar (2021) examine the effectiveness of communication platforms in conveying the importance of sustainability messages in higher educational institutions and find that written communication works better than visual communication. Kautish et al. (2021) point out that individuals in modern societies are becoming more concerned about nature and feel responsible for natural environmental deterioration. Societies can leverage this growing awareness to get users to dispose of their smartphones more responsibly.
Barriers to recycling can be separated into internal or personal barriers and external barriers related to the infrastructure of recycling. We have found that personal barriers play a significant role in hindering recycling, and these are likely to be difficult to overcome. However, the barriers related to recycling infrastructure can be overcome by enlisting retailers and/or manufacturers to facilitate recycling. This can be done by making available convenient locations to drop off used phones and arranging pick-up service for such phones. Insights put forward by Awan and Sroufe (2022) have relevance in this context. Their research revealed that it is essential to pick up waste without charging for the service and making it convenient for people to dispose of their waste. Clearly, this involves expenditure and is unlikely to succeed without a commitment from governments. Equally relevant is the evidence put forward by Isernia et al. (2019) for Italy. They report that jurisdictions that did not have an e-waste collection system and have not invested enough in setting up an appropriate infrastructure experienced poor collection performance. On the other hand, provinces with many collection centers displayed much better collection performance.
Our survey results as well as findings from the literature tell us that personal barriers, such as privacy issues and attachment to their phones, prevent users from recycling their phones. Evidence from the literature suggests that economic incentives may help overcome this reluctance to recycle. Islam et al. (2020), Borthakur and Singh (2021), Inghels and Bahlmann (2021), and. C. Wang et al. (2021) have all shown that economic incentives have a positive impact on the recycling decision of users. Retailers and manufacturers should be enlisted to provide incentives that will overcome users’ reluctance to recycle their phones. The Circular Economy Policy of the UAE (Government of the UAE, 2021) lays a lot of emphasis on the use of incentives to encourage remanufacture, reuse and recycling of goods materials. The benefits of the use of incentives and penalties to enhance environmental quality has been shown by Khan et al. (2022).
Conclusions
As stated in the introduction, this research has strong practical implications for policy making in the UAE since the Government of the UAE is making salutary efforts to move toward a circular economy. This transition requires the concerted effort not just from the government but also from all the stakeholders in all sectors (Government of the UAE, 2021). The research presented in this paper has sought to contribute to this endeavor by studying the drivers and hindrances to recycling of used mobile phones to suggest practical remedies for overcoming this problem.
The use of mobile phones, especially smartphones, will inevitably increase in the years to come. Along with this, the problem of e-waste is going to rise, putting ever-increasing pressure on the beleaguered environment. Overcoming this problem will require an effective recycling program that prevents the disposal of phones in landfills. Though the collection of e-waste is still rudimentary and informal, the UAE has initiatives in place for proper disposal of e-waste for example, a specialized facility in Dubai Industrial Park that can collect 100 kt of e-waste per year (Forti et al., 2020). There are, of course, limits to what can be done by the government alone since the success of any recycling program depends critically on the willingness of users to recycle their e-waste.
We believe that our research has helped improve our understanding of the disposal behavior of phones users in the UAE. However, more research is required to understand the precise barriers that inhibit this behavior and how users could be encouraged to be more responsible for the disposal of their phones.
Footnotes
Declaration of Conflicting Interests
The author(s) declared no potential conflicts of interest with respect to the research, authorship, and/or publication of this article.
Funding
The author(s) disclosed receipt of the following financial support for the research, authorship, and/or publication of this article: The author(s) received funding from Middlesex University Dubai towards the publication of the article which is gratefully acknowledged. There was no financial support for the research and authorship of this article.
Ethics Clearance
The Ethics committee of Middlesex University Dubai had approved the ethics application of Gayle Patrao for collecting data from human participants. The Ethics Committee does not provide a reference number but a statement from the committee can be submitted if required.