
Abstract
Hu line is the dividing line of Chinese population density, geography, culture, and economy. The areas on both sides of the Hu line are in completely different stages of development, and have development modes. Based on the 3D research framework, and using the panel data of 335 cities in China from 2000 to 2013, our study examines the driving factors and the influence mechanism of productivity in the cities on both sides of the HU line. We find that economic growth in low-density areas depends more on increased density and division, while economic growth in high-density areas depends more on decreases in distance and segmentation. In addition, the mechanism test illustrates the heterogeneous growth mechanism on both sides of the HU line. The cultural diversity in low-density areas promotes economic growth by promoting diversified economy; while the cultural identity in high-density areas promotes specialized economy and thus promotes economic growth. Our study provides new empirical evidence for the informal institutional reasons behind the economic development, and also provides a useful reference for the economic development of the multi-ethnic areas in China.
Introduction
The imbalance of regional economic development is a common phenomenon in the economic development of all countries around the world. To achieve balanced regional development and narrow the regional development gap has become the consensus of all countries to improve the quality of development. Governments or regional organizations have taken the regional spatial development strategy as the core measures to solve the problem of regional coordinated development. For example, both the “EU 2020 Strategy” proposed by the European Commission (2010) and the “Regional 2050 Development Strategy” initiated by the Regional Plan Association (RPA) (2006) are aimed at addressing the problem of unbalanced regional development through regional policies. OECD (2019) has also highlighted the importance of balanced regional development to for regional development potential in several reports. At the same time, regional development imbalance is also one of the prominent problems facing China’s economy (Lee et al., 2012). The Chinese central government has successively implemented the strategy of western China development, the strategy of revitalizing the old industrial bases in northeast China, and the rise strategy of the central region to solve the problem of regional development imbalance. However, reducing imbalance of regional development is still the top priority of China’s territorial space planning strategy in the future.
The Hu line is an important dividing line in China’s economic geography proposed by Hu (1935). The areas on both sides of Hu line show completely different population structure, ethnic distribution, and economic scale. In the northwest of the line, 6.37% of the population lives there, and the areas are defined as low-density areas, minorities in this region account for 24.87% of the entire country and 32.78% of the low-density areas. While in the southeast of the line, there are 93.36% of the population lives there, the areas are defined as high-density areas, and minorities in this region account for 75.13% of the entire country and 6.74% of the high-density areas. In addition, the Hu line is also the dividing line for economic development, which shows a long-term development trend of “The West is weak and The East is strong.” In addition, the economic imbalance between the provinces in the low-density areas is also relatively prominent, forming two obviously different development trends: one is the obvious improvement of regional economic growth, including Inner Mongolia, Chongqing, Sichuan, Guizhou, and Shaanxi; the other is stagnation of regional economic growth, including Yunnan, Guangxi, Xinjiang, Gansu, Qinghai, Ningxia, and Tibet. Thus, the imbalance of regional economic development has posed a severe challenge to China’s sustainable and high-quality China’s economic development. How to further improve the level of regional economic development, to narrow the gap between regional economic growth, has become an important topic in the macroeconomic management for the Chinese government, which is of great theoretical and practical significance for the realization of China’s well-off all-round society and common prosperity.
In the “World Development Report in 2009,” World bank (2009) proposed that economic growth is spatially imbalance. Reshaping economic geography requires following the “3D” geospatial characteristics of density, distance, and division (referred to as “3D” for short). Through the optimal combination of unified institutional arrangements and transportation infrastructure, the gap in living standards between regions can be narrowed, and economic and social benefits can be obtained. Meanwhile, this report summarizes the above three geographical features into urban issues, regional issues, and national issues. As a unified country, China should not have divisions at the regional level, but in fact, the division between regions in China is obvious, and this division is not only a matter of infrastructure, but also a matter of institution (Lu, 2016). More importantly, the division caused by cultural diversity also exists within the city. With the rapid development of transportation and the increasing progress of science and technology, the obstacles of natural geographical features to economic development have gradually weakened, while the influence of informal institution such as language, belief, and values on economic activities has gradually become prominent. At present, many scholars have conducted relevant studies based on the perspective of market division caused by product prices, and summarized the conclusion of the negative impact of market division on economic growth. However, the role of multicultural division on economic growth is underestimated. In particular, as the dividing line, the role of Hu line in term of Chinese ethnic culture has not been fully discussed. Specifically, the regions west of this line is more complex and diverse than that of southeast side about ethnic customs and cultural traditions. Ethnic groups with distinctive characteristics such as Tibetans, Uygurs, and Huis usually live-in small groups in low-density areas, while high-density areas show the phenomenon of multi-ethnic intertwined living.
As a social custom, individual belief (Greif, 1994), and behavioral preference (Akerlof & Kranton, 2000), culture is not only inherited vertically among different generations, but also spread horizontally among groups. Due to its formation and evolution are a slow and imperceptible process, its impact on the economic growth is also often underestimated or even ignored. The discussion about cultural and economic development began with the book “The Protestant Ethic and the Spirit of Capitalism” by the classical economist Webber (1905). This is considered a cornerstone of early research on the interrelationship between culture and economic. But it wasn’t until more than two dozen years ago that such topics have really been revived. Among them, the discussion on the “Africa’s growth tragedy” is an important research milestone, concluding that ethnic diversity is the main reason for hindering Africa’s economic growth (Easterly & Levine, 1997). After that, Scholars have examined the relationship between diversity and economy in various aspects of culture, including language (Bian et al., 2019; Desmet et al., 2018), immigration (Bahar et al., 2020; Ginsburgh et al., 2017), birthplace (Alesina et al., 2016), race (Alesina & Ferrara, 2005; Ayob, 2018), gene (Desmet et al.,2011; Gershman & Rivera, 2018; Spolaore & Wacziarg, 2009), religion (Ayob, 2018; Lee et al., 2012; Lewer & Van den Berg, 2007). Most of these studies have focused on the inter-country level such as Europe and Africa, or on the cultural diversity within countries due to immigration factors, such as western countries such as the United States, Germany, Australia, and Canada. However, there are few related studies on the Oriental culture, especially the cultural powers like China that attaches great importance to interpersonal relations.
Compared with high-density areas, China’s low-density areas are multi-ethnic, multi-lingual, and multi-religious areas with special geopolitics. This is a good experimental field for studying the role of China’s ethnic culture in the economy. The division caused by multiculturalism will inevitably play a very important role in the economic development of low-density. Therefore, this paper uses the Hu line as the boundary to explore the factors affecting the heterogeneity of economic growth on both sides of the line under the 3D framework, and further examines the mechanism of the impact of the division caused by cultural factors on economic growth. We believe that the effective input of production factors, the positive role of the agglomeration economy, and the accurate guidance of the informal institution are bound to be the important tool for promoting regional economic growth.
Compared with previous related research, the contribution of our article is as follows: (1) Different from the recent literature using 3D research framework, our research measures the division within cities from the perspective of cultural diversification, and complements the previous literature of measuring interregional market division from the perspective of product price. (2) Different from other Chinese cultural research perspectives from language dimension (Chen, 2013; Ma & Zhao, 2019; Zhao & Lin, 2017), religion dimension (Chen & Chen, 2018; Ruan et al., 2014; Zhang & Ma, 2017), regional culture (Ding et al., 2018; Zhao et al., 2015), our research explores the role of Chinese ethnic culture in the process of economic development. (3) Different from the literature on relationship between ethnic culture and economic development in recent years, previous studies have partially focused on certain ethnic autonomous areas (Han & O’Mahoney, 2018; Wang, 2018), and the rest used the data of the proportion of ethnic minorities in the census or adopts the form of questionnaire and interview to obtain ethnic culture data for analysis (He & Wang, 2018), which makes the multi-faceted ethnic culture information missing. Our research constructs the comprehensive indicators of ethnic culture diversity from the three dimensions of religion, language, and economic activities that affect the spread of ethnic culture, and makes innovations in the quantitative measure of ethnic culture diversity in China. (4) On the basis of the mature western ethnic group research framework, our research adds the non-institutional factors with national conditions with Chinese characteristics, and discusses the role of cultural diversity and its influence mechanism in economic development. Which provides new empirical evidence for the informal institutional reasons behind the economic development, and also provides a useful reference for the economic development of the multi-ethnic areas in China.
The remaining structure is as follows: the second part is the literature review, the third part is that sorting out the relationship between the 3D and the economic growth by using the NEG model, the fourth part is about the introduction of data and indicators, the fifth part is empirical result and mechanism analysis, and the last part is conclusion.
Literature Review
The new economic geography theory introduces the concept of space into the mainstream economics, and explains the phenomenon of spatial agglomeration and diffusion. The Density-Distance-Division research framework proposed by World Bank (2009) in the “World Development Report of 2009” absorbs the research results of new economic geography, it considers not only the economic effects of agglomeration, but also the two geographical features of distance and division that influence the degree of agglomeration. So the research framework is the integration and expansion of the research results of new economic geography and new trade theory. At present, there is less literature to analyze economic growth using this framework. Dehghan Shabani et al. (2012) proposed an NEG model with endogenous growth and free capital flow to study the relationship between 3D and regional economic growth, which provide the mathematical evidence for the study of the impact of 3D on economic growth. Empirical research on the impact of 3D on regional economic development generally leads to the following similar conclusions, shortening the distance, alleviating division, and increasing density promote the economic growth (Gao, 2021; Rigg & Salamanca, 2011; Scholvin, et al., 2017; Wang et al., 2018; Yan et al.,2020). However, the measurement indicator of division for exiting researches is the market integration index, they ignore the multi-ethnic cultural background, the division caused by culture cannot be ignored (Craig & Habgood, 2018; Falck et al., 2012; Guiso et al., 2009). Especially in the northwest and southwestern regions of China, the impact of division caused by multi-ethnic cultural on economic development still needs more empirical research to explore. Lu (2016) also proposed that the impact of some informal institution on division should be paid attention to as soon as possible, and he pointed out that the division caused by this informal institution has an important impact on the development of regions and countries.
Discussions in academic circles on the impact of cultural diversity on economic growth have two distinct conclusions: On the one hand, cultural diversity promotes consumption, production, and innovation by enhancing the diversification of goods, services, and technologies, thus enhancing potential economic benefits (Alesina et al., 2016). On the other hand, cultural diversity produces potential costs, such as racial discrimination and prejudice, social conflicts and riots (Alesina et al., 2016), suboptimal selection of social public goods (Alesina et al., 2019), etc., which is not conducive to the development of economic activities.
The unfree flow of production factors leads to regional division, especially the unfree flow of labor factors among regions is an important reason for preventing the backward regions from achieving integration with the developed regions, and even exacerbates the economic deterioration of the backward regions (Ding et al., 2018). Easterly and Levine (1997) pioneered the impact of ethnic diversity on regional economic growth, they pointed out that ethnic diversity is the cause of the “tragedy of African growth.” Subsequently, a large number of scholars extend their research objects to other regions, Alesina et al. (2003) used data from 109 countries and Dincer and Wang (2011) used data from Chinese provinces to verify the above view. They both found that diversity did reduce economic growth. Xu et al. (2015) based on the dialect diversity data at the county level in China, they found that dialect diversity had an inhibitory effect on economic growth. They pointed out that cultural homogeneity can positively promote economic growth, because in the case of imperfect markets, individuals prefer to transact with members of their own group. Furthermore, in societies where legal contracts are not easily made or enforced, individuals prefer to transact within their groups because behavior can be monitored within community norms (La Ferrara, 2003). Thus, poorly managed diversity can have significant costs to economic growth.
However, some scholars also hold the opposite view that division caused by this multicultural factor promotes economic growth. They mainly emphasize the heterogeneous knowledge spillover that diversity will bring, and form complementary technologies to form cognitive diversity. That is, people with different cultural backgrounds and different educational experiences have different reserves of information resources. Therefore, organizations with diversity can think about how to better solve the problems and obstacles they face from different ways of thinking (Docquier et al., 2020; Hong & Page, 2004; Momani & Stirk, 2017). Ottaviano and Peri (2005) showed that linguistic diversity has a positive effect on the hourly wage and employment density of Native Americans, they believed that the diversity of workers’ cultural background promotes the diversity of workers’ skills, which helps to improve the local workers’ productivity. In addition, Alesina and Ferrara (2005) also pointed out that in New York and Los Angeles, even if there are many troubles of ethnic relations, production of the certain private goods is increasing due to the diversity of abilities, experience, and culture.
In conclusion, on the one hand, most of the existing researches are based on one of the 3D factors to study its relationship with economic development. Since World Bank put forward the 3D model in 2009, there are still few literatures on the impact of these three factors on economic growth. On the other hand, research using 3D models ignores the important role of cultural factors for division, especially in a cultural country with a history of 5000 years, cultural factors cannot be ignored in the process of economic development. 3D is a research framework designed to convey that unbalanced economic growth and inclusive development can go hand in hand and complement each other. Therefore, it is of great significance to use this framework with the Hu line to study the heterogeneity of economic growth in high-density and low-density areas of China under different cultural backgrounds.
Theoretical Framework and Research Hypothesis
We introduce the framework of a new economic geography model of endogenous growth and free capital flow, and the model of this article has some improvement based on research of Minerva and Ottaviano (2009). Firstly, we add population density to the model by following the method of Klasen and Nestmann (2006). Secondly, we also introduce cultural factors that affect knowledge diffusion into model.
Assumptions
There are only two cities in the country, 1 and 2, with the same number of workers (N), and initial Intellectual Capital
The utility of representative worker in region 1 is,

Where traditional product T is a numeraire product, M is the modern product that it is a composite product is composed of many different kinds of products,

Where N is the total number of modern products produced in region 1 and 2,

Where
Due to the budget constraints, utility maximization means that workers in period t use the αϵ(0, 1) of personal income Y(t) to consume modern products, and the remaining (1 − α) to consume traditional product. For any variety i, the individual demand is as follow (for the derivation process, see formula (4) in the Supplemental Appendix A):

Where
Modern product is produced with monopolistic competition, because the fixed cost and the variable cost, modern products are produced with increasing returns to scale. The production of modern product requires 1 unit of patent (fixed cost) and λ units labor per unit of output (variable cost), and each enterprise produces its own and produce only one kind of modern product, so the global knowledge capital stock (patent) determines the total variety of modern products,

Transport
The iceberg cost is used to represent the product consumption in transit, the enterprise of city 1 need ship products with

The delivered price simply reflects different transport costs,

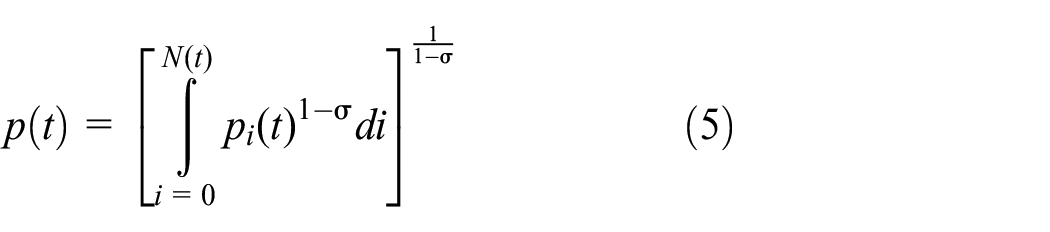
The price index formula (5) is rewritten as,
Where
Knowledge Spillover
Innovation is produced by the research department and is the source of economic growth. We assume that the production of innovation is perfect competition. In the long term, knowledge spillovers support continuous innovation, which increases the productivity of scientific researchers due to increased knowledge accumulation. The production function of the research department is as follows,


Where
Due to the dual theory of the production function in the research department, the marginal cost of the R&D department is,

Where
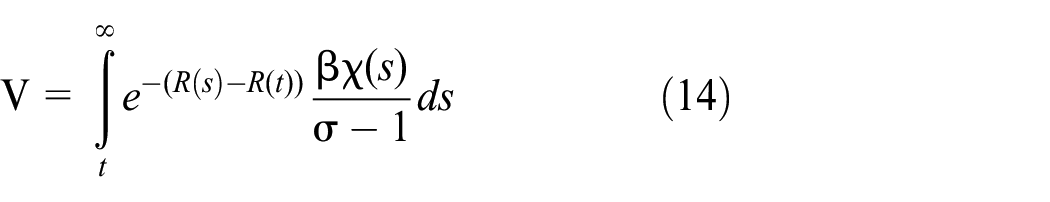
Where R(t) is cumulative discount factor. By differential formula (14), we have,

The Model on Relation Between 3D and Growth and the Hypothesis
We define the growth rate of knowledge capital as

Sorted out as follows (For the derivation process, see formula (16) in the Supplemental Appendix A.):

Formula (13) is introduced above as follows:
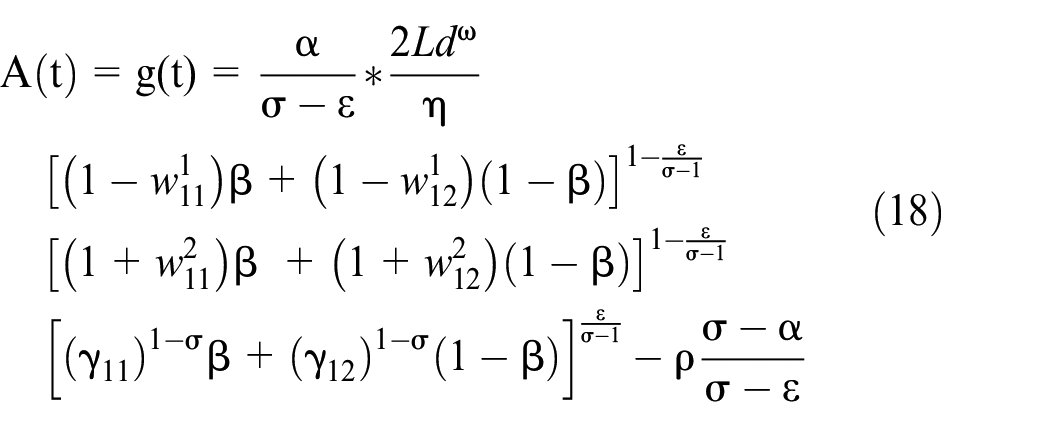
Where
In formula (18), we find that there is a negative correlation between economic growth and the iceberg cost γ that representing distance. Distance reflects the convenience of transportation in this region, having convenient transportation not only shortens the regional transportation distance to meet the needs of travel and cargo transportation, but also it also reduces the operating cost and improves the operating efficiency for the economic system. On the one hand, the transportation infrastructure as an investment in public assets directly promotes growth through the “multiplier effect.” On the other hand, as an unproductive facility, it also promotes the increase of TFP through “external effects.”
Ethnic culture as an informal institution affects individual behavior, including history, language, religion, values. The impact of cultural diversity on economic growth is reflected in the balance between the positive effects of cognitive diversity and production diversity and the negative effects of social management costs and communication costs. On the one hand, the diversity of cognition and production brought about by multiculturalism promotes the diversification of regional industries to meet the needs of various groups, and the diversification of industries promotes knowledge spillover and complementarity to enhance regional economic growth. On the other hand, the identity of national culture leads to high communication and management costs and promotes the industrial model to be a specialized economy. Based on the rapid development of transportation, regional specialization is realized, thereby promoting regional economic growth.
Based on the analysis of the relationship between 3D and economic growth, we propose the following assumptions:
Hypothesis I: Density, distance, and division (3D) have important effects on regional economic growth, and division due to cultural diversity is not always negative.
Hypothesis II: Based on the heterogeneity of development stages and cultural characteristics, there are differences in the driving effects of 3D on economic growth in high-density areas and low-density areas.
Hypothesis III: The effect of cultural diversity on the economic growth of high-density and low-density areas is based on the mechanism of specialization economy and diversification economy respectively.
Variables and Data resource
Estimation of Total Factor Productivity
In order to explore the regional heterogeneity of economic growth under the 3D framework, we use the Total Factor Productivity (TFP) of each region as the dependent variable. We follow Lian and Lu (2012) to measure the regional TFP by the average value of the firm’s TFP. The original data of firm’s TFP estimated by the Levinsohn-Petrin method (LP) comes from the database of Chinese industrial enterprises, and the period is from 2000 to 2013. In order to make the conclusion more convincing, we conduct the following data processing about database with reference to the Brandt et al. (2012), (1) elimination of duplicate data; (2) sample matching; (3) establishment of panel data. Totally, we have obtained valid observations of 3,050,926 firms’ samples, the specific processing methods about the database see the Supplemental Appendix B. Figure 1 reflects the change trend of TFP from 2000 to 2013, we find that the regional TFP has shown an overall upward trend since 2000. In addition, the increase amplitude of TFP in some areas in the central, western and northeastern regions is much higher than that in coastal areas.

Distribution of TFP changes from 2000 to 2013.
Estimation of 3D
Density
Density stands for the population density, which refers to the concentration of population in a specific area, calculated as follows:

Figure 2 reflects the changes in population density from 2000 to 2013, the white areas in the figure indicate the decreasing trend of population density, and other colors show the increasing trend of population density, the darker the color, the greater the increase. It can be found that the population density in the central and northern regions of China show a downward trend, especially the population density in the Inner Mongolia Autonomous Region and the Northeast Region, it shows a large downward trend, while the coastal areas and municipalities are still the places where populations gather, and density shows a high growth trend.
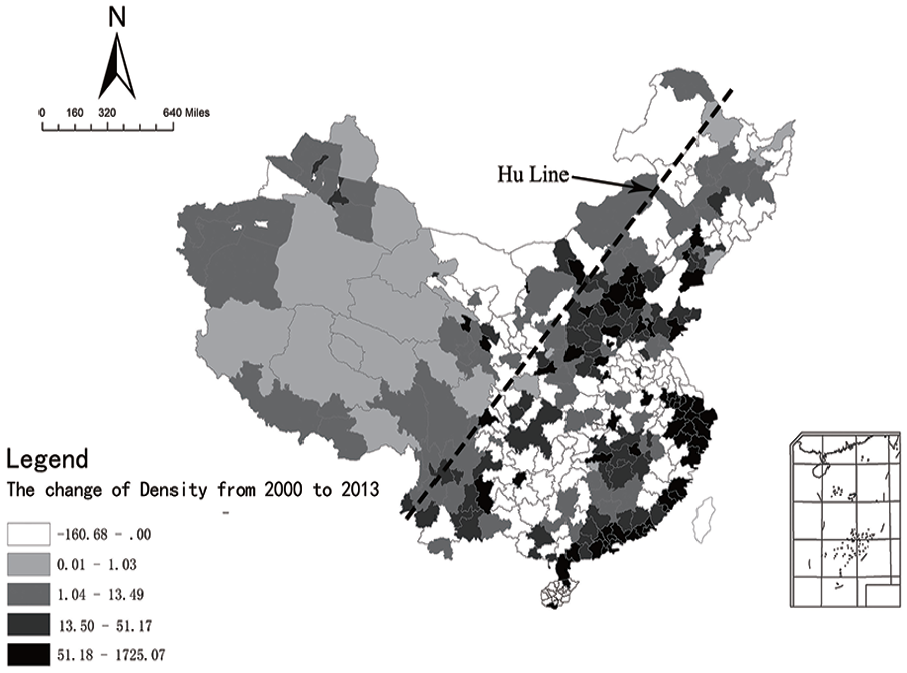
Distribution of density changes from 2000 to 2013.
Distance
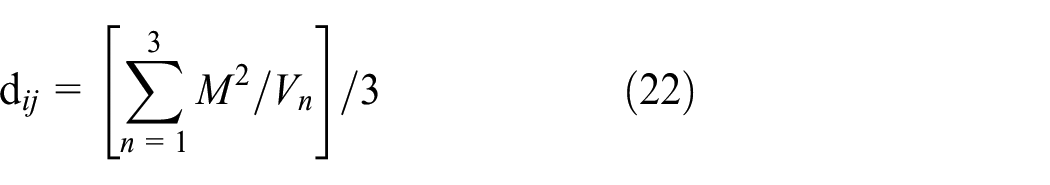
Distance refers to the distance to the big market, because China is a major exporter in the world, and the port serves as a gathering place for export goods, so the big market in this article mainly refers to the transportation distance to the nearest port. Firstly, we refer to Lin et al. (2018) to measure the distance between cities by the actual travel time of the highway, and calculate the shortest time between cities from 2000 to 2013. Then we define the cities where important ports are located as the port cities. Finally, we calculate the average time of the nearest three port cities by using the shortest travel time between cities. The specific measurement method is as follows:

From Figure 3, it can be seen that the average distance to the nearest port show a trend of shortening as whole, and the central region have the largest reduction.

Distribution of distance changes from 2000 to 2013.
Division
Division refers to factors that impede knowledge spillover and free flow of production factors, cultural diversity increases the degree of division and is not conducive to the formation of an integrated market. Therefore, we follow Dincer and Wang (2011), take ethnic culture as the dividing standard among different cultures, and we also absorb Stirling’s (1998) definition of the three characteristics of the cultural diversity, they include quantity, equilibrium, and difference, and finally we used Benhammer Index to construct a comprehensive indicator of cultural diversity

Which,
We refer to the method of Hofstede “cultural distance” to calculate the cultural distance
Figure 4 reflects the changes in regional cultural diversity from 2000 to 2013, the white in the figure represent areas where the degree of regional cultural diversity is decreasing, and other colors represent areas where the degree of regional cultural diversity is increasing, the darker the color, the greater the increase in regional cultural diversity over the 14-year period. We also find that changes in the degree of cultural diversity show the following characteristics: the external regions are increasing, and the internal regions are decreasing, which in the southwestern and northwestern regions of China, the increase is greater, while the central and northeastern regions show a higher degree of weakening.

Distribution of division changes from 2000 to 2013.
Estimation of Mechanism Variables
Specialization
The Krugman’s specialization index is used to measure regional relative specialization, as the formula (23) shown:

Which,

Where,
Diversification
Contrary to the MAR externalities, Jacobs (1969) believes that knowledge can produce spillover effects between complementary industries, rather than between similar industries. In other words, areas with diverse economies grow faster than specialized ones. Therefore, the agglomeration economy is not necessarily related to specialization, and can therefore arise from the overall scale and diversity of economic activities in a particular region (Jones, 2017). The Jacobs externalities is also known as the diversification economy. Our research measures regional diversification according to the relative diversity index proposed by Duranton and Puga (2000), that is, the index is measured by the reciprocal of specialization. Therefore, the relative diversity index is given by the following equation:

Estimation of Other Variable and Descriptive Statistics
In addition to above three factors affecting productivity, in order to better control the accuracy of estimation results, we use the following control variables to exclude the influence of geography, education, technology, and other factors on economic growth. They are latitude and longitude from Baidu map, education and research investment from Longxin Data Research Institute, government expenditure on cultural sector, GDP per capita, FDI, etc. The above city-level data comes from the “China City Statistical Yearbook” and the “Statistical Yearbook” of China’s provinces, and the enterprise-level data comes from the “China Industrial Enterprise Database.”
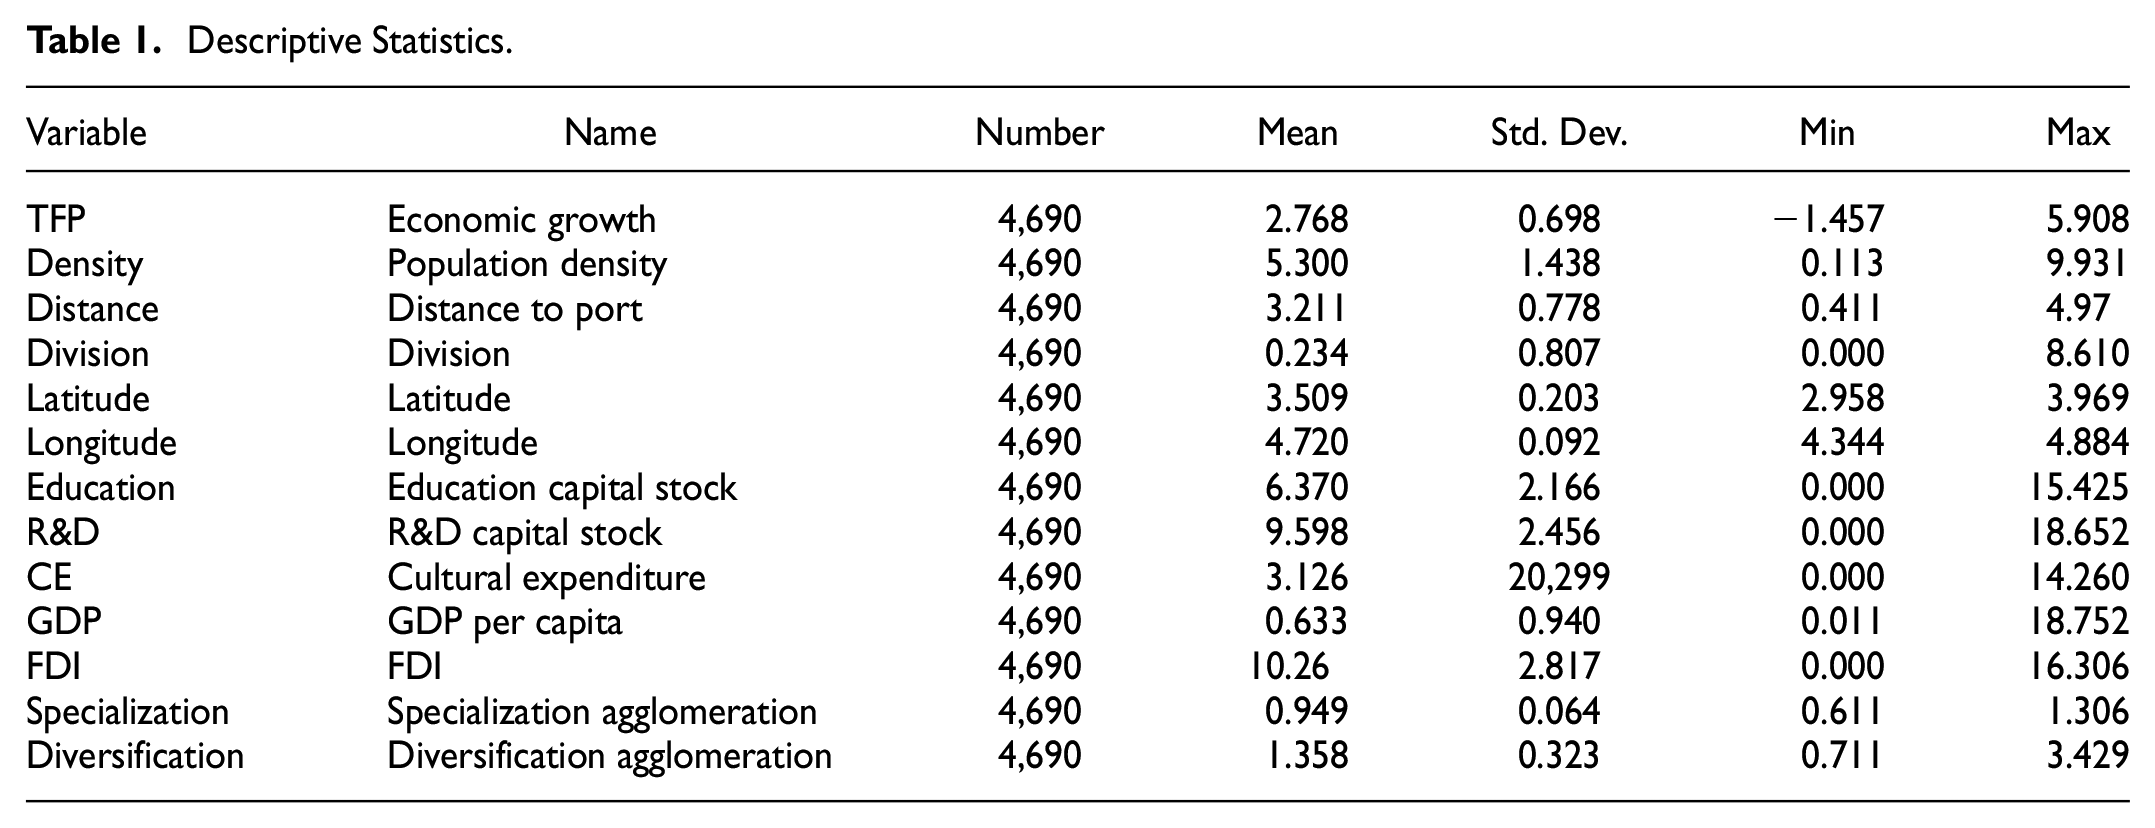
We use the data of 335 prefecture-level cities of China from 2000 to 2013 as the research sample, and divide the heterogeneous areas of high- and low-density by using the Hu line. Although the Hu line is a dividing line of population density, some cities in the west of the line also have regions with population density higher than the national average, such as Hohhot, Lanzhou, Xining, Yinchuan, Urumqi, etc.; while in the east of this line, there are still some regions with low population density due to their special geographical characteristics, such as Lishui, Huangshan, Sanming, Shiyan, Fangchenggang, and other areas. Therefore, there is no problem of sample selection bias by using this line to divide the heterogeneous region. We define the 131 prefecture-level cities in the west of Hu line as samples of low-density areas, and the remaining 203 prefecture-level cities in the east of this line as a high-density areas sample. The descriptive statistics of related variables are shown in the following Table 1
Descriptive Statistics.
Empirical Results
Empirical Model
In order to verify the hypothesis proposed above, we construct the following empirical model:

In the above model,
An Empirical Analysis about the Effect of 3D on Regional Productivity
Results About Basic Regression
The empirical results about the effect of 3D on regional productivity are shown in Table 2 based on the full sample data. Columns (1) to (3) is the influence of density, distance, and division as the separate independent variables on productivity. We found that the impact of density and division on regional productivity both are significantly positive, while the distance to the largest market is significantly negative. Since the relationship between regional growth and 3D is closely related, we cannot consider only the single variable of 3D, so column (4) is that we put density, distance, and division into the model, the coefficient of population density is the largest, followed by the coefficient of division, and then the coefficient of distance. The result shows that increasing density and division, shortening the distance significantly promote regional productivity. So we obtain the following conclusions, firstly, we verify the existence of agglomeration effect caused by density, indicating that the agglomeration effect has a significant positive effect on improving productivity. Secondly, we verify the spillover effect caused by the distance to the large market. Finally, we find that the division caused by culture has a clear promotion effect on productivity, it is contrary to the conclusion obtained by Yan et al. (2020) and Gao (2021), indicating that market division caused by cultural diversity is not necessarily a bad result for the economy. Which shows that the positive effect of the collision of multiple cultures on regional technological innovation is greater than the negative effect of the cost of integration between different cultures on the production efficiency.
The Effects of Density, Distance, and Division on TFP.

Note. Standard errors in parentheses.
Significant at 10%, **significant at 5%, ***significant at 1%, the following table is the same.
In summary, the hypothesis I is confirmed.
Results About Robustness Test
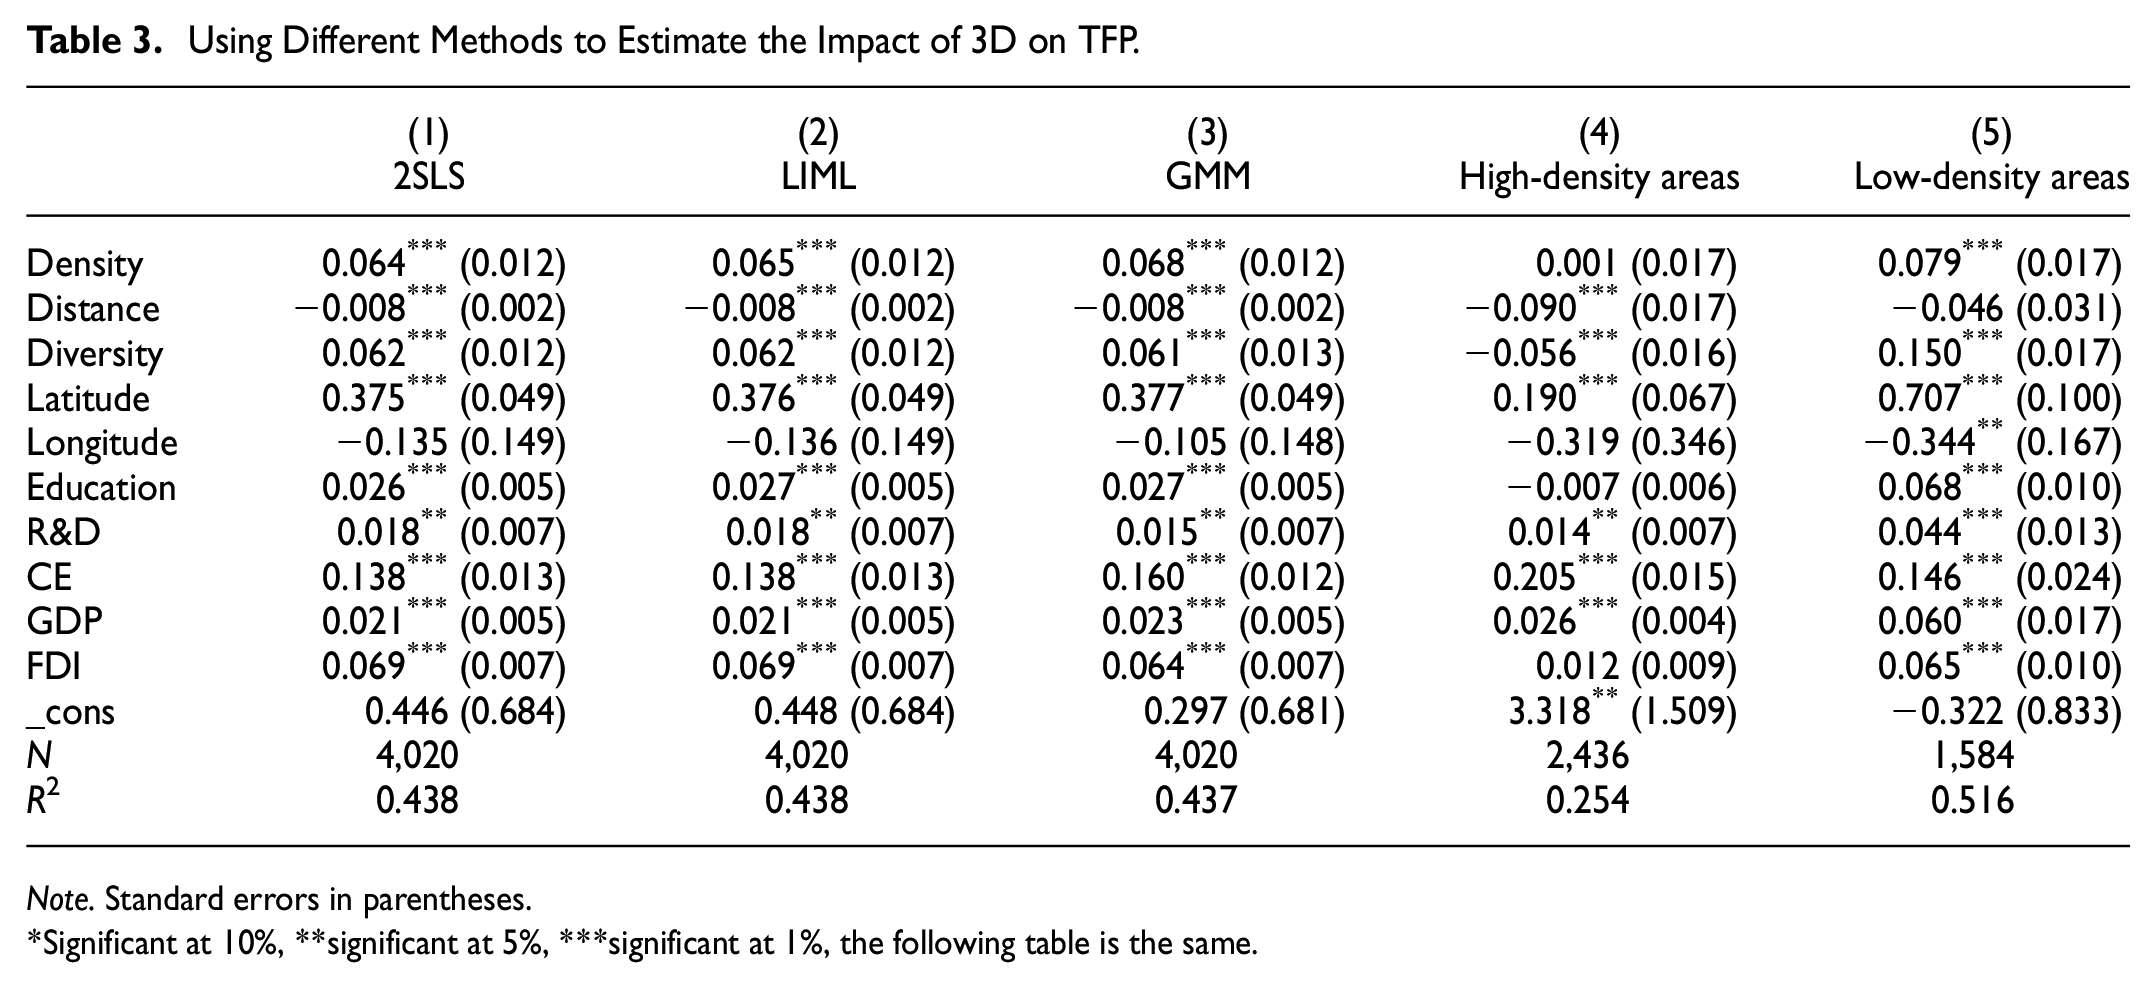
In order to alleviate the endogeneity problem caused by the two-way causality between density and economic growth, we used population density and fiscal expenditure lagging behind two periods as the instrumental variables of population density to regress, and the results are shown in Column (1) of Table 3. In addition, in order to verify the robustness of the results, we use the method about “Limited Information Maximum Likelihood (LMLE),” which is less sensitive to weak instrumental variables to estimate the model (see Column (2)). In addition, we also consider the existence of heteroscedasticity factors, so using the GMM estimation method (see column (3)) is more efficient than 2SLS. For this reason, we finally use the optimal GMM method to estimate the model. The result shows that the coefficient estimation of GMM is very close to that of 2SLS, indicating that the regression result is robust. Therefore, the following empirical equations are estimated by using the optimal GMM method.
Using Different Methods to Estimate the Impact of 3D on TFP.
Note. Standard errors in parentheses.
Significant at 10%, **significant at 5%, ***significant at 1%, the following table is the same.
Results About Sub-sample Regression
We divide it into high-density and low-density areas according to the Hu line. The regression results are shown in column (4) and column (5) of the Table 3, there is the regional heterogeneity for the impact of 3D on productivity in the regression results of sub-samples.
Firstly, in terms of the impact of population density on TFP, we find that coefficient (0.079) of population density in low-density areas is increasing relative to that (0.068) in the whole sample, while in high-density areas, the coefficient (0.001) is increasing relative to the whole sample, but it is not significant. Thus, by increasing population density to promote productivity, low-density areas are more effective than high-density areas. In the low-density areas, higher population density means higher human capital, so population density is still an important factor to increase TFP, while in the high-density areas, human capital investment is no longer the driving force to increase TFP, they often promote productivity through capital accumulation or technological progress. On the one hand, only when the population does not reach the critical point, the increase of urban population can play a positive role in agglomeration economy and promote the productivity. The results verify that the population size in high-density areas is closer to the highest point of the inverted U model than that in the low-density areas, so when increasing the same population density in the different areas, TFP in the low-density areas increase higher than that in the high-density areas. On the other hand, the dispersion power plays a strong role in high-density areas, while the agglomeration power plays a strong role in low-density areas.
Secondly, in terms of the impact of the distance on TFP, the coefficient (−0.046) in the low-density areas is declining compared to that in the full sample (−0.008), but it is not significant. While the coefficient in the high-density areas (−0.009) is increasing compared to that in full sample, and there is a significant negative correlation at the 0.1% level, which is consistent with the research hypothesis and illustrates that shortening distance to the port in the high-density areas is still important to promote TFP. On the one hand, in the low-density areas located in western and northern of China, the distance to the nearest port basically refers to the distance to the border inland port. Since the development of China’s inland ports is relatively late compared to coastal ports, and because of the restrictions of China’s administrative units, there are also conflicts in the distribution of interests between regions, so the inland ports are still poorly regulated. While in the high-density areas located in the eastern and southern of China, where gathering developed city clusters such as Beijing-Tianjin-Hebei, Yangtze River Delta, and Pearl River Delta, there are the most advanced technology and talents in this region. Therefore, the closer the city is to coastal ports, the more likely it is to enjoy the spillover effects of knowledge, technology, and production factors brought by the agglomeration economy, and the more likely it is to share advanced supporting service industry. On the other hand, China is a semi-coastal country, located in the high-density areas in the east and south of China, this region is close to the sea. Shipping is the most important mean of transportation for China’s imports and exports. If a city is close to a coastal port, it is equivalent to being close to a huge foreign market, and the transportation cost of factors and commodities is greatly reduced, as well as the needs of customers can be grasped quickly so as to adapt to the rapid changes in the market. Therefore, the positive effect of distance reduction is more effective in high-density areas than in low-density areas.
Finally, in terms of the impact of the division caused by culture on TFP, the coefficient in the high-density areas and low-density areas show an opposite direction. The coefficient in the low-density areas (0.150) is increasing compared to that in the full sample (0.061), and there is a significant positive correlation at the 0.01% level. While the coefficient in the high-density areas (−0.056) is decreasing compared to that of full sample, and there is a significant negative correlation at the 1% level. It is mainly due to the identity awareness in the low-density areas is stronger than that in the high-density areas. The strong ethnic identity will promote trust and communication between the same cultural groups, so the difference in the impact of culture-induced division on TFP is mainly reflected in whether they are in the same identity background. As we know, in the low-density areas in China, there concentrated areas of ethnic minorities with a single religious belief, and they have a high sense of identity, while in the high-density areas, the ethnic groups with multiple religions, most of them are close to the characteristics of the Han ethnic group and have relatively weak awareness of identity. So when the division increases, under the premise of the same belief, the collision of various ethnic cultures in low-density areas promote regional innovation, realize the benign collision of various ethnic cultures, and promote the TFP. However, in high-density areas, since the awareness of identity is relatively weak, and the ethnic minority groups account for a relatively small proportion, when the division increases, it is difficult to realize the cultural dividend.
In summary, we find that economic growth in low-density areas depends more on the increases in density and division, while high-density areas rely more on the reductions of distance and division. Therefore, the hypothesis II is confirmed.
Mechanism Analysis
Based on the previous theoretical analysis and research assumptions, we further explore the drivers of heterogeneity growth in high- and low-density areas from the perspective of cultural diversity. We use step-by-step regression to empirically examine the different mechanistic roles of specialization and diversification economy in cultural diversity affecting regional economic growth.
Mechanism Analysis of Specialization in the High-Density Areas
In high-density areas of China, regional economic growth depends on the shortening of distance and division. This is due to the mechanism role of specialized economy in high-density areas. Our study uses micro-data from Chinese industrial enterprises to introduce urban specialization variables into the mechanism test model, and the test results are shown in Table 4.
Mechanism Analysis of Specialization in the High-Density Areas.

Note. Standard errors in parentheses.
Significant at 10%, **significant at 5%, ***significant at 1%, the following table is the same.
The benchmark regression results of high-density areas in column (1) show that the coefficient of division is significantly negative at 1%, that is, the division caused by cultural diversity has a negative impact on the economic growth of high-density areas, which means cultural identity promotes the economic growth of high-density areas. In order to test the influence mechanism of specialization in high-density areas, column (2) examines the influence of cultural diversity on specialization economy. The results show that the coefficient of division is negative, meaning that ethnic cultural identity helps to promote specialized concentration in high-density areas. In column (3), specialization economy is added to the model for testing. The coefficient of specialization is significantly positive at the 1% level, which means that the degree of specialization in high-density areas plays a significant positive role in promoting the economic growth of the region. Compared with the size and significance of the division coefficient in column (1), the results in column (3) are reduced, which indicates that specialization economy plays a partial mediating role of cultural diversity in affecting economic growth in high-density areas. In other words, cultural identity (reduced cultural diversity) promotes economic growth in high-density areas by promoting the degree of specialization. Furthermore, the coefficients of the distance are shown as negative, which means that shortening the distance between cities and large markets in high-density regions is conducive to the specialization and transportation transactions of commodities between regions, thus exacerbating the key role of specialization in the economic growth of high-density regions.
Mechanism Analysis of Diversification in the Low-Density Areas
In low-density areas of China, regional economic growth depends on increased density and division. This is due to the role of diversification economy in low-density areas. Similarly, we use the micro-data of Chinese industrial enterprises to introduce the urban diversification economy variables into the mechanism test model to test the intermediary effect of diversification, and the test results are shown in Table 5.
Mechanism Analysis of Diversification in the Low-Density Areas.

Note. Standard errors in parentheses.
Significant at 10%, **significant at 5%, ***significant at 1%, the following table is the same.
Column (1) of is the regression results of 3D elements on economic growth in low-density areas. The results showed that the coefficient of division is significantly positive at the level of 1%, indicating a positive effect of division due to cultural diversity on economic growth in low-density areas. Cultural diversity promotes economic growth in low-density areas. The results of column (2) show that the coefficient of division is positive, that is, the ethnical culture diversity in low-density areas promotes diversification economy. This verifies the development model of product diversity in low-density areas from the supply side. Column (3) makes the diversification coefficient significantly positive at 5%, meaning that the degree of diversification in low-density areas can promote regional economic growth. Compared with the size and significance of the division coefficient in column (1), the coefficient in column (3) is reduced, especially the coefficient is no longer significant. This shows that diversification plays a fully intermediary role of cultural diversity in affecting the economic growth in low-density areas.
In summary, the hypothesis III is confirmed.
Conclusion and Policy Implications
Conclusion
This article discusses the regional heterogeneity of economic growth under the 3D framework, and then we explore the impact mechanism of division on economic growth from the perspective of regional ethnic cultural diversity. We believe that cultural factors should not be ignored for regional economic research, and play an important role in the process of economic development.
In order to explore the regional heterogeneity of the impact of 3D on economic growth, we divide the samples into high-density areas and low-density areas based on the Hu line. Firstly, we find that due to the difference in ethnic cultural characteristics between high-density areas and low-density areas, economic growth in low-density areas is more dependent on the increase in population density and division, while high-density areas are more dependent on the reduction of distance and division. Secondly, the cultural uniformity of high-density areas promotes specialized economy, and thus promotes regional economic growth. At the same time, the shortened distance to big market further promotes specialized economy, and effectively promotes regional division of specialization and cross-regional transactions. Thirdly, cultural diversity in low-density areas promotes regional diversification economy, and thus promotes economic growth. Moreover, the increase of population density will further boost the formation of ethnical culture diversification environment, accelerate cognitive diversity, and promote innovation and economic growth.
Policy Implications
The importance of soft power in regions to regional economic growth is becoming increasingly prominent. This point is different from the coordination of industrial structure and proportion, the promotion of industrial transformation and upgrading, and the improvement of investment environment and institution. How to achieve a breakthrough in the Hu line precisely reflects a process of coordinated regional development of China’s economy, and the diversity of ethnic cultures plays an important role for that. 3D research framework absorbs the research findings of new economic geography, which provides a solid theoretical support for exploring regional unbalanced development. However, some existing literature mostly analyzes the role of market division on economic growth from the perspective of product price theory. Based on the 3D research framework from the perspective of market division caused by Chinese multi-ethnic culture, our research effectively complements the previous related research from the perspective of market division caused by price theory. Meanwhile, our research also provides important policy implications for the coordinated regional development of China, and the economic growth of low-density areas in other developing countries.
On the one hand, high-density areas should pay attention to the establishment and maintenance of mainstream culture. In addition, through the perfect transportation network and market integration policy to shorten the distance of each region. Specialization agglomeration is the core mechanism of economic growth in high-density areas, strengthening regional specialization is an important policy goal. The regional specialization system not only includes the cooperation at the industrial chain level, but also combines the industrial specialization system with the spatial and regional specialization system. Economic development policies should further stimulate the vitality of enterprises in scientific and technological research. Policies about encouraging scientific and technological innovation can not only drive a higher level of specialized agglomeration, but also achieve the goal of high-quality development.
On the other hand, low-density areas should advocate diversified ethnic policies and labor resources agglomeration are important guarantees for economic growth. Firstly, diversified policies and measures are adopted to encourage the increase of the total population of various ethnic group, and further promote the diversification of ethnic composition structure in low-density areas. Secondly, effective policy incentives are adopted to attract the labor population to gather or migrate to the low-density areas, and improve the population density of the area. Low-density areas should focus on the principle of diversified agglomeration, in particular, economic policy goals should emphasize the diversification, integrity and systematization of product market, labor market, and factor market. Which is conducive to ensure the long-term stability of the production activities of the market entities in this region. Therefore, the governments of low-density areas should adopt a series of equal, open and inclusive ethnic policies, language policies, religious policies, and industrial policies. Enterprises in low-density areas give full play to the advantages of multi-ethnic culture and solve the problem of labor resource shortage in this region through flexible recruitment and employment policies. Once the policies of the government and enterprises can form a benign interaction, then the multi-ethnic culture can provide an effective boost to the economic growth of low-density areas. This exactly means the breakthrough of the Hu line, therefore, the market division effect caused by geographical characteristics will be significantly weakened.
Of course, our current research is mainly limited to the availability of data from Chinese industrial enterprises, which was only updated to 2013. Our future research will take the micro data of consumers at various types of micro levels as the entry point to analyze the individual decision-making behavior and motivation of consumers from different ethnic cultural backgrounds.
Supplemental Material
sj-docx-1-sgo-10.1177_21582440231194839 – Supplemental material for The Power of Culture: Does Diversity Affect the Breakthrough of the Hu Line in China?
Supplemental material, sj-docx-1-sgo-10.1177_21582440231194839 for The Power of Culture: Does Diversity Affect the Breakthrough of the Hu Line in China? by Na Yan, Shanlang Lin, Jieping Chen and Youshuai Sun in SAGE Open
Footnotes
Declaration of Conflicting Interests
The author(s) declared no potential conflicts of interest with respect to the research, authorship, and/or publication of this article.
Funding
The author(s) disclosed receipt of the following financial support for the research, authorship, and/or publication of this article: This work was supported by the National Natural Science Foundation of China under Grant Number 72003141.
Data Availability Statement
The data that support the findings of this study are available from the corresponding author upon reasonable request.
Supplemental Material
Supplemental material for this article is available online.
References
Supplementary Material
Please find the following supplemental material available below.
For Open Access articles published under a Creative Commons License, all supplemental material carries the same license as the article it is associated with.
For non-Open Access articles published, all supplemental material carries a non-exclusive license, and permission requests for re-use of supplemental material or any part of supplemental material shall be sent directly to the copyright owner as specified in the copyright notice associated with the article.