
Abstract
To explore the technological innovation efficiency of industrial enterprises above designated size and its influencing factors under the China’s economic census industry classification, using the stochastic frontier approach to estimates the innovation efficiency of the 34 industry from 2008 to 2018. Taking the sales revenue of new products as the dependent variable, R&D capital stock and R&D personnel equivalent are taken as the independent variable, control variables are reasonably selected. The characteristics and influencing factors of innovation efficiency between industries are analyzed. The results show that the innovation efficiency of all industries in China is steadily improving, and the difference between industries is gradually narrowing. Industries with high innovation efficiency are related to future competition and national economy and people’s livelihood, while industries with low innovation efficiency are concentrated in mining and supply industry. The low input and low output industries are in the majority. The influence of innovation capital input on output is greater than that of personnel input. The proportion of state-owned property rights and capital constraints have a negative effect on innovation output, while the sales income has a positive effect on innovation output. Therefore, China should further improve the innovation efficiency of industrial industries, adopt classified policies, and increase the number of industries with low input and high output. The conclusion of the paper is of reference value to the development of China’s 14th five-year industry and the medium and long term planning.
Keywords
Introduction
Since the 1980s, the trend of integration of science and technology and economy has become increasingly obvious. In order to become a real economic power for China, enhancing scientific and technological innovation capacity is the top priority. The report to the 19th CPC National Congress pointed out that innovation is the primary driving force for development and a strategic underpinning for building a modernized economy. Science and technology, as the lasting power of economic development, is the key to social progress. The 14th Five-Year Plan calls for innovation-driven development, enhancing enterprises’ technological innovation capacity, stimulating talents’ innovation vitality, and improving systems and mechanisms for scientific and technological innovation. The pattern of economic growth is shifting from an emphasis on input to an emphasis on efficiency.
According to data from previous economic censuses, China’s R&D investment in 2020 was 2,439.31 billion yuan, with an average annual growth rate of 14.88% from 2008 to 2018. In 2020, R&D personnel investment is 5.235 million per year, with an annual growth rate of 8.51%. The innovation capital investment growth rate is much faster than the human resources investment. In 2020, the intensity of R&D investment was 2.40%, still lagging behind the United States (3.39%) and Japan (4.34%). In 2020, the number of R&D researchers per 10,000 employed people in China was 27.2 per 10,000 people per year, far lower than 98.5 per 10,000 people per year in Japan, and 98.5 per 10,000 people in the United States. It can be seen that although China’s R&D investment and personnel investment are increasing year by year, there is still a significant gap between China and the developed countries. In 2020, China’s industrial enterprises above designated size will spend 1.862.38 trillion yuan on new product development, 5.07 times that of 2008. The sales revenue of new products in 2020 was 23,807.37 billion yuan, 4.18 times that of 2008. The multiple increase of new product sales revenue is less than the multiple increase of new product development expenses, and the increase of output and input does not match. The industrial enterprises above designated size have strong production capacity and are the backbone of China’s economic development. Based on the 34 industrial categories of China’s economic census, this paper aims to measure the technological innovation efficiency of industrial enterprises above designated size by industry, analyze its influencing factors, classify and discuss the innovation efficiency of different industries, and put forward policy suggestions for different situations.
From the perspective of input-output, the efficiency of scientific and technological innovation analyzes the degree of transformation of innovation factor input into innovation results. Scientific and technological innovation plays a strong role in promoting the economy, and the country has a high investment in this field. Scientific analysis of the efficiency of scientific and technological innovation at the industry level can provide the effective guidance for the country’s industrial policy. Therefore, it is of great significance to study the efficiency of scientific and technological innovation and analyze the factors affecting scientific and technological innovation to achieve new breakthroughs in China’s scientific and technological innovation.
The main issues of this paper are as follows: First, the scientific and technological innovation efficiency of the industrial enterprises above designated size from 2008 to 2018 is estimated based on 34 categories of industries under China economic Census. Second, selecting appropriate indicators and adding control variables, the stochastic frontier model and knowledge production function are used to analyze the impact of innovation input on innovation output. Third, 34 industries are classified according to innovation input and innovation output, the characteristics of different types of industries are analyzed, and targeted policy suggestions are put forward.
Literature Review
At present, there are two methods to measure the innovation efficiency of enterprises: one is the Data Envelopment Analysis (DEA) based on mathematical programming, the other one is Stochastic Frontier Analysis (SFA) developed from knowledge production function. The DEA method is suitable for analyzing multi-input and multi-output situations, and it can measure innovation efficiency without setting the form of production function. However, DEA method cannot distinguish random disturbance term from technical inefficiency term, and influence factors cannot be analyzed at the same time, and the measured efficiency value often equals 1. SFA method just makes up for the deficiency of DEA method. When there is only one technological output, SFA method can measure efficiency value more accurately, which also meets the research expectation of this paper.
The study of innovation efficiency in foreign countries was first proposed by Griliches (1979) to analyze the impact of scientific research and knowledge spillover on economic development in colleges and universities. Hashimoto and Haneda (2008) used DEA-Malmquist index method to estimate the innovation efficiency of the pharmaceutical industry in Japan from 1982 to 2001, and found that the innovation efficiency of the manufacturing industry in Japan gradually declined. Thomas et al. (2011) and Petruzzelli et al. (2018) respectively measured the innovation efficiency of 50 states and 298 biotechnology companies in the United States.
Previous studies to measure innovation efficiency mainly focus on regional development and firm innovation efficiency.
There are many studies on the regional innovation efficiency. Z. Han and Cheng (2020) used DEA, SFA, and Bootstrop-DEA to estimate the efficiency of scientific and technological innovation in China’s provinces, and compared the results of the three methods. Liu and Zhou (2020) calculate the innovation efficiency of 11 cities in the Guangdong-Hong Kong-Macao Greater Bay Area from 2006 to 2017, and analyzes influencing factors such as the industrial structure, financial scale, and government size. Hu et al. (2020), Luo and Lu (2021) and Liu (2021) calculate the innovation efficiency of the Yangtze River Economic Belt and provinces and cities. An and Zhang (2021) measured China’s regional innovation efficiency and analyzed the impact of digital economy development on it. X. Han (2021) analyzes the impact of Internet + on the regional innovation efficiency based on provincial panel data from 2006 to 2015 in China. Yin (2022) evaluated the innovative development of agriculture and rural areas at county level in Gansu Province against the background of rural revitalization. Xiao and Xiao (2022) takes 108 cities in the Yangtze River Urban Belt as an example to study the coupling relationship between green innovation and ecological governance performance. Duan et al. (2022) constructed an evaluation index system for the efficiency of regional urbanization and the level of scientific and technological innovation based on China’s provincial panel data. Cui and Li (2022) analyzed the regional differences of patent technology innovation efficiency and industrial technology innovation efficiency in the three urban agglomerations of Beijing-Tianjin-Hebei, Yangtze River Delta, and Pearl River Delta in China.
There are also many scholars studying the innovation efficiency of enterprises and companies. Jiang et al. (2020) used the data of listed companies in China to discuss the influence of shareholders’ equity pledge behavior on enterprise innovation efficiency. Su and Fu (2023) took the number of patents granted and R&D investment of Chinese intelligent listed companies as samples and used DEA model to measure the innovation efficiency of Chinese intelligent manufacturing enterprises. B. Han et al. (2023) took 187 listed enterprises of new energy vehicles in China as the research object, used the three-stage DEA model to measure the innovation efficiency of listed companies of new energy, and analyzed the influencing factors of enterprise innovation efficiency.
In contrast, there are relatively few articles that use the SFA method to measure the efficiency of industry innovation. Fu et al. (2020) analyzed the innovation efficiency and influencing factors of Marine biomedicine industry in 11 provinces, regions, and cities along the coast of China. Chao (2020) empirically analyzed the technological innovation efficiency of China’s equipment manufacturing industry and its seven industries by using stochastic frontier method, and further decomposed it into pure technological innovation efficiency and scale efficiency. H. Zhu et al. (2021) and Zhang and Ge (2023) respectively measure the innovation efficiency of strategic emerging industries and high-tech industries.
From the previous studies, it can be seen that there are few articles measuring the innovation efficiency of industries currently. The measured industries are generally concentrated in high-tech industries and the strategic emerging industries, and there are few articles taking industrial enterprises above designated size as the research object. As the intermediate force of scientific and technological innovation in China, the scientific and technological innovation efficiency of industrial enterprises above designated size represents the development situation of industrial enterprises with higher strength in China. Therefore, it is of typical representative significance to study the scientific and technological innovation efficiency of industrial enterprises above designated size.
Compared with previous studies, this paper focuses on the combination of industrial industries and industrial enterprises above designated size in the study of innovation efficiency, and the marginal contribution is reflected in three aspects: First, based on the industrial industry categories of the latest economic census (2018), the analysis covers all industrial industries. Second, calculating and analyzing the innovation efficiency and its changing trend from the second economic census to the fourth economic census (2008–2018). Third, the influence of innovation capital and the innovation personnel on innovation output of industrial enterprises above designated scale is analyzed. Fourth, according to the input and output of the scientific and technological innovation, 34 industrial enterprises are divided into four categories and their characteristics are analyzed by classification.
Empirical Models and Principles
Stochastic frontier analysis (SFA) is a parameter estimation method proposed by Aigner and Chu (1968), which can determine the production frontier through maximum likelihood estimation (MLE). Meeusen and Broeck (1977) and Battese and Coelli (1995) further improved and perfected the SFA by adding the inefficiency factor to the model. The SFA is widely applied to efficiency measurement, as it can simultaneously measure technological efficiency and investigate its determinants.
SFA Model
The SFA model is expressed as follows:

where
Knowledge Production Function
The SFA can accurately measure innovation efficiency only when the production function is correctly set. We drew on the knowledge production function proposed by Griliches (1979) as follows:
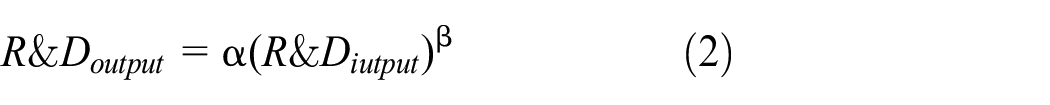
Combining the Cobb–Douglas function and stochastic production function, we set the model as follows:

where


In equation (4),
The corresponding efficiency function is as follows:

From equations (3)–(6), the positive and negative values of
Variable Selection
Input and Output Variables
According to the previous research, R&D expenditure and R&D personnel are often used in the index of scientific and technological innovation investment. Due to data limitations, the output index of scientific and technological innovation generally adopts the sales revenue of new products, number of patents, and number of scientific research papers (Comanor, 1965; Peng et al., 2019; Pessoa, 2005).
In this study, the variable for innovation output is expressed by the sales revenue of new products and the number of patent applications. The innovation input variable is expressed by the R&D capital stock and the full-time equivalent (FTE) of R&D personnel. The R&D capital stock needs to be calculated using the perpetual inventory method, expressed as:

Equation (7) includes four variables, meaning the estimation can be completed in four steps. First, the R&D capital expenditure of the current period, E, is determined. This value is equal to the R&D expenditure minus labor cost (Wu, 2006). Second, a price index for R&D capital expenditure is constructed (P. Zhu & Xu, 2003). Third, depreciation rate
Control Variables
Research on innovation efficiency involves not only input and output variables, but also control variables. As shown in equation (5), we selected the proportion of the state ownership (OWN), performance level (PRO), and capital constraint (DEB) of industrial enterprises above the designated size in an industry as control variables. Table 1 lists the variables used in this study.
Description of Selected Variables.

Measurement and Analysis
First, the classification of industrial industries in each year is adjusted and the data sources are explained. Then, the innovation efficiency of 34 industrial industries from 2008 to 2018 is measured and the change characteristics are analyzed. Finally, the influence of relevant factors on innovation output is analyzed.
Industry Adjustment and Data Description
Innovation efficiency was measured based on the industrial sector categorization in the economic census. The industry categories varied across the different years. There were 37 industries in 2008–2011, 41 industries in 2012–2015, and 38 industries in 2016–2018. The corresponding industry categories were adjusted for ease of comparison and analysis.
The major industry adjustments: (I) for 2012–2018, the categories “Exploitation and auxiliary activities” and “Mining of other ores” were deleted, and their corresponding data were added up and averaged to the five mining industries; (II) for 2008–2018, the categories “Manufacture of textile wearing and apparel” and “Manufacture of leather, fur, feather, related products, and footwear” were merged into the category “Manufacture of apparel, footwear, caps, leather, and fur products”; (III) for 2008–2011, the categories “Manufacture of rubber” and “Manufacture of rubber and plastics” were merged into the category “Manufacture of rubber and plastics”; (IV) for 2012–2018, the categories “Manufacture of automobile” and “Manufacture of railway, shipbuilding, aerospace, and other transportation equipment” were merged into “Manufacture of transportation equipment”; (V) for 2008–2018, the categories “Manufacture of measuring instrument” and “Other manufactures” were merged into “Manufacture, repair, and utilization of other equipment”; (VI) for 2012–2018, the categories “Utilization of waste resources” and “Metal products, machinery and equipment repair” were merged into “Manufacture, repair, and utilization of other equipment.”
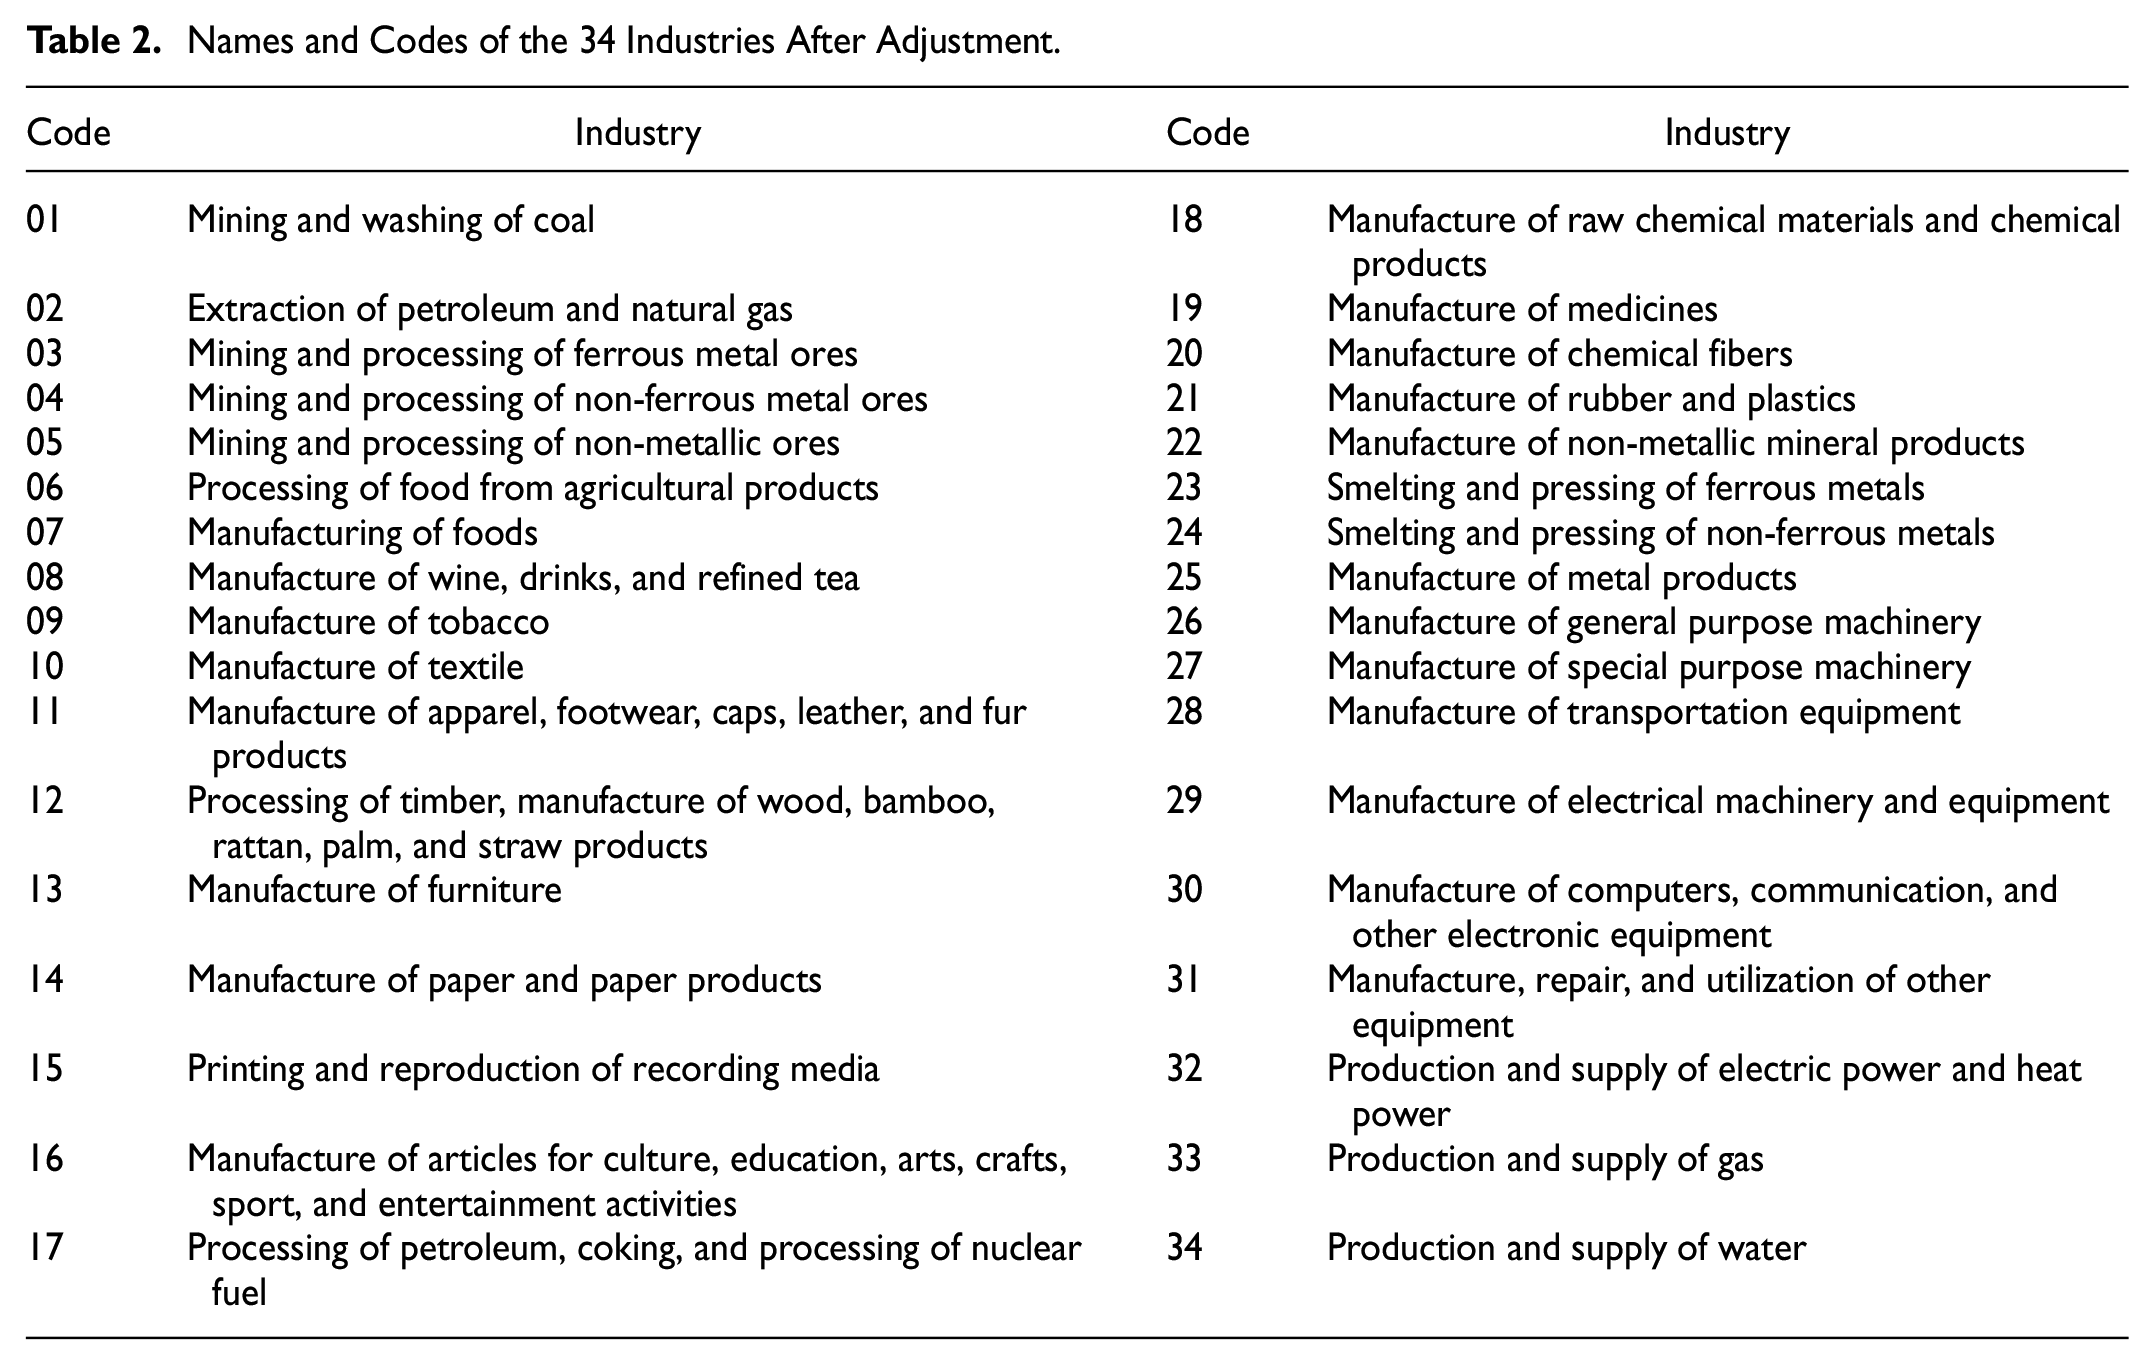
After adjustment, there were 34 industries in each year. The specific industry names and codes are listed in Table 2. There were five mining industries (codes 01–05), 26 manufacturing industries (codes 06–31), and three industries related to the production and supply of electricity, heat, gas, and water (codes 32–34).
Names and Codes of the 34 Industries After Adjustment.
The data used in this study were obtained from the China Statistical Yearbook, China Science and Technology Statistical Yearbook, and the economic census data from 2008 to 2018.
Innovation Efficiency Measurement and Inter-industry Comparison
The numbers of patent applications and sales revenue of new products were used as dependent variables. They were measured using equations (3) and (5). If the dependent variable is the sales revenue of new products, the γ value of the estimated equation is 0.9336, which is close to 1 and significant at the 1% level. If the dependent variable is the number of patent applications, the γ value of the estimated equation is 0.1796, which is significant at the 10% level, while the value is below 0.5. This does not prove that the error term in equation (5) was associated with the technical inefficiency term, showing that the number of patent applications was not suitable for the SFA model. Hence, we used sales revenue for new products as the dependent variable.
Combined with models (3)–(6), the innovation efficiency of the 34 industrial sectors can be estimated. The following results were obtained through comparative analysis.
As shown in Figure 1, the innovation efficiency of China’s 34 industries showed an overall upward trend from 2008 to 2018, and the average value of innovation efficiency of each industry rose from 0.5942 in 2008 to 0.7220 in 2018. Since the 18th CPC National Congress, China’s industrial policy has placed more emphasis on innovation-driven and the application of emerging technologies. As stipulated in the “Made in China 2025” plan, which was promulgated in 2015, China must build strong manufacturing power by leveraging its institutional advantages and creating an environment for innovation. National industrial policies are a strong backing for the steady improvement of the innovation efficiency of all industries in China.

Change in the average innovation efficiency of the 34 industries.
Figure 2 shows the standard deviation (SD) of innovation efficiency among 34 the industries during the study period. It thus reflects the degree of dispersion for innovation efficiency among industries. The SD of innovation efficiency among industries declined from 0.2347 in 2008 to 0.1920 in 2018. The difference in innovation efficiency among industries shrunk at an average annual rate of 2.03%.

Change in the standard deviations of innovation efficiencies of the 34 industries.
As shown in Figure 3, “Manufacture of furniture” and “Extraction of petroleum and natural gas” witnessed the highest and lowest average innovation efficiencies, at 0.8741 and 0.0447, respectively. From Figure 2, the dispersion of innovation efficiency among industries during 2008–2018 decreased, but the absolute difference was still substantial. As shown in Figure 4, substantial differences were also found in the average annual growth rate of innovation efficiency in all industries. The average annual growth rate of “Production and supply of electric power and heat power” was highest (27.11%) and that of “Extraction of petroleum and natural gas” lowest (−4.49%).

Average innovation efficiency of the 34 industries.

Average annual growth rate of the innovation efficiencies of the 34 industries (%).
As shown in Figures 3 and 4, industries with high technological innovation efficiency exhibited low average annual growth levels in terms of innovation efficiency. These industries are relatively developed, making it difficult to make a breakthrough in innovation efficiency. On the other hand, most industries with low innovation efficiencies have witnessed high average annual. This shows that industries with low innovation efficiencies accelerated the pace of technological innovation and achieved remarkable results. In particular, the average value and annual growth rate of innovation efficiency of “Extraction of petroleum and natural gas” ranked last. In other words, the innovation efficiency of this industry was low for 11 years, throughout the study period, and there was no breakthrough in innovation.
Industries with high innovation efficiency generally influence the national economy and people’s livelihoods or provide important support for economic development. Social demand has prompted industries to accelerate the pace of innovation. Industries with low innovation efficiency are generally the basic mining and supply industries. Society’s demand for such industries is rigid, which makes it difficult to innovate.
The 34 industries were then categorized by input and output indexes. The output index is the sales revenue of the new products. The input index is a linear combination of R&D capital input (K) and personnel input (L), that is,
Classification of the 34 Industries From 2008 to 2018 (Based on the Input and Output Indexes).

Note. Industry names are provided in Table 2, based on the industry codes listed in Table 3. The emdash (—) means there is no such industry.
It can be observed from Table 3 that, from 2008 to 2018, LIHO industries only include the industry “Manufacture of textile.”“Manufacture of textile” was an LIHO industry from 2010 to 2016 and became an LILO industry in 2017. This indicates that the input-output ratio of technological innovation in this industry changed, and it failed to continue its high-efficiency innovation model. “Manufacture of textile” is a labor-intensive industry. In the new economic era, this industry needs to closely integrate electronic and computer technology to find new paths for innovation. A LIHO industry shows an ideal production model. There are few such industries in China, which shows that the country has a long way to go for the efficient development of scientific and technological innovation.
There are five HILO industries, mainly mining and metal product manufacturing ones. Among them, “Mining and washing of coal” became a LILO industry in 2012, showing that this industry’s innovation output did not improve and its innovation input was also reduced. In 2014, “Manufacture of medicines” became an HIHO industry, indicating that its innovative production entered the track of scientific and technological R&D and achieved good results. In 2018, “Manufacture of non-metallic mineral products” and “Manufacture of metal products” shifted from LILO to HILO. This indicates that these two industries increased their innovation inputs, but their innovation performances had not yet improved.
The number of HIHO industries stabilized at nine since 2014, including generally equipment manufacturing industries with higher output values. This type of industry is closely related to other industries and features high innovation inputs and outputs. It is currently a relatively ideal type of industry in China.
The number of LILO industries stabilized at around 24 per year, being mostly energy supply industries and relatively small-scale manufacturing industries. These industries have two main characteristics. First, residents’ demand for energy supply industries is relatively stable, and the enthusiasm for innovation is not high. Second, the scale of manufacturing industries closely related to residents’ lives is relatively small, and their innovation input and output are lower than those of large-scale equipment manufacturing industries.
Analysis of Innovation Efficiency Determinants
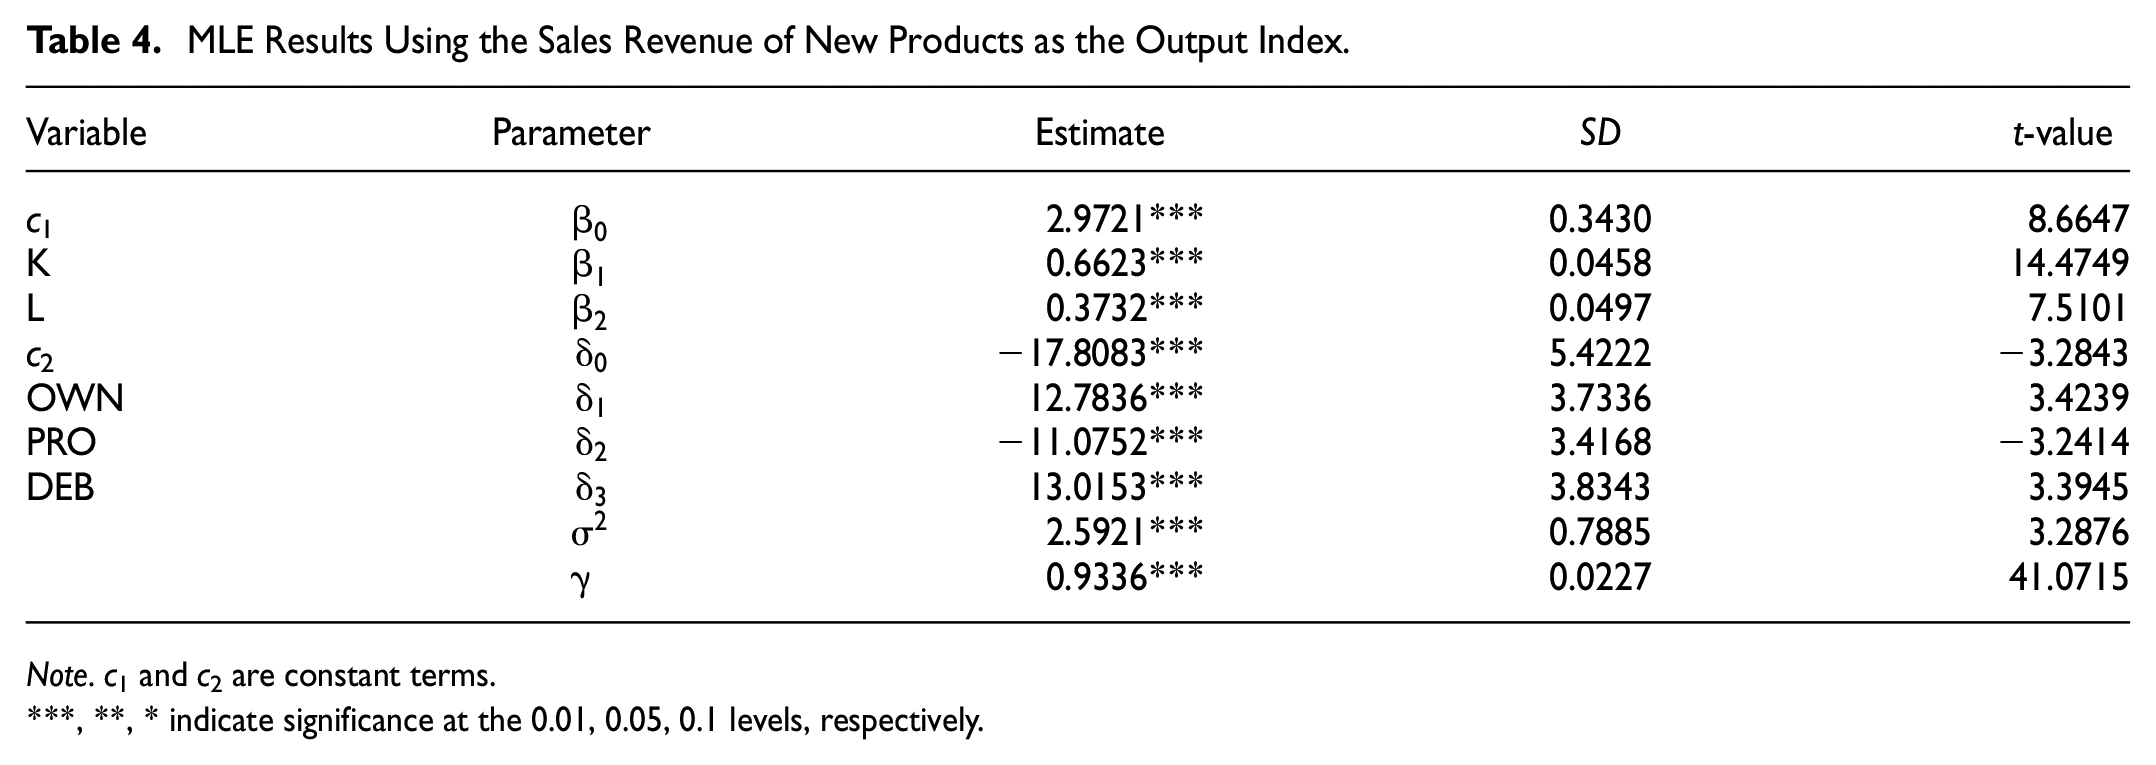
As per Table 1, the sales revenue of new products serves as the dependent variable, the innovation input variable is the explanatory variable, and the proportion of state ownership, performance level, and capital constraint are control variables. Based on models (3)–(5) and the panel data of industrial enterprises above designated size in 34 industries in China from 2008 to 2018, we obtained the impact of the variables on innovation output, as shown in Table 4.
MLE Results Using the Sales Revenue of New Products as the Output Index.
Note. c1 and c2 are constant terms.
, **, * indicate significance at the 0.01, 0.05, 0.1 levels, respectively.
From Table 4, the output elasticity of R&D capital input is greater than that of R&D personnel input. The coefficients on the elasticity of capital input and labor input are
Control variables OWN, PRO, and DEB all had a significant impact on innovation output. The regression coefficients
Conclusions and Implications
Conclusions
This paper constructs the knowledge production function and uses the stochastic frontier production method to measure the scientific and technological innovation efficiency of the 34 industrial enterprises above designated size in China from 2008 to 2018. The change of industrial innovation efficiency during the period is investigated and the influence of various factors on the innovation efficiency is analyzed. The research conclusion is more detailed than before, classifying different industries and discussing their representative industries respectively. The result shows that:
(1) In terms of industrial innovation efficiency, the innovation efficiency of the 34 industrial enterprises above designated size in China showed an upward trend from 2008 to 2018, and the dispersion degree of innovation efficiency among industries decreased. Industries with high innovation efficiency have low growth rate, while those with low innovation efficiency have high growth rate. Industries with high innovation efficiency are closely related to high-tech industries and the residents’ life, while industries with low innovation efficiency are generally rigid basic industries. Based on the industry classification of input-output variables, the industries with high input and high output and low input and low output account for a large proportion. The industries with high input and high output are generally the equipment manufacturing industry with high output value, while the industries with low input and low output value are concentrated in the energy supply industry and the manufacturing industry with relatively small output value. This part is an innovative conclusion obtained from a new research perspective.
(2) In terms of influencing factors of innovation output, the output elasticity of R&D capital stock is greater than that of R&D personnel input, showing an increasing phenomenon of scale effect. The proportion of state-owned property rights and capital constraints of industrial enterprises above designated size in the industry have a significant restraining effect on the innovation output, while economic performance has a significant promoting effect, which is consistent with previous research conclusions.
Policy Implications
Based on the analysis results above, we propose the following policy implications:
(1) Efforts should be made to continuously increase the innovation input and output of industrial enterprises above the designated size in each industry while focusing on improving innovation efficiency. According to the current economic situation, economic production has changed from factor-driven to innovation-driven. The main requirement of the innovation-driven pattern is to clarify the relationship between input and output. All industries must take the path of innovation with low input and high efficiency. Industries that have always ranked low in innovation efficiency need to be closely connected to high-tech industries. In particular, such industries should integrate advanced technologies into industrial development to achieve green energy and clean development. Industries with high innovation efficiency must firmly grasp their own advantages and seek breakthroughs to bring innovation to new heights.
(2) Enterprises in different industries should implement policies based on their characteristics. Among LIHO industries, labor-intensive industries should focus on merging with emerging industries to realize mechatronics production. HILO industries, which are mostly mining and metal product manufacturing industries, require new equipment and processes to achieve high efficiency, a high recovery rate, and mechanized development. HIHO industries are mostly high-tech and equipment manufacturing industries. These industries thus need to update technology and equipment to improve production technology and innovation capabilities. LILO industries are generally water, electricity, and gas supply and manufacturing industries with relatively small output values. This type of industry needs to be closely connected to new energy and technologies to achieve efficient development.
(3) The innovation labor input cannot be ignored while increasing the innovation expenditure input. Currently, innovation capital has a greater impact on innovation output. Innovative enterprises can make full use of the Science and Technology Innovation Board and Chinese Growth Enterprise Market to continuously increase innovation capital input to promote more efficient improvement of innovation output. Although the role of personnel input in boosting innovation output is smaller than that of capital, personnel input still plays a significant role in promoting innovation output. Therefore, innovative companies, especially high-tech industries, still need to focus on the introduction of high-tech talents to give play to the guiding roles of both innovative capital and innovative talent.
(4) Industrial enterprises above a designated size should improve their operating performances and appropriately leverage environmental factors to contribute to the improvement of scientific and technological innovation efficiency. Efforts should be made to give full play to the advantages of state-owned enterprises and increase the incentives for their innovative production; thus, state ownership will no longer be a constraint for innovation output. Substantial operating performance and output profits guarantee scientific and technological personnel and capital input. Industry enterprises above the designated size should strive to broaden their operating markets to obtain more profits and reduce operations on liabilities.
(5) To build a reasonable and effective legal and institutional environment, strengthen government management, and ensure the steady improvement of enterprise innovation efficiency. All regions need to guarantee the legitimate rights and interests of enterprises in scientific and technological innovation through institutional management, such as the ownership of patents for new products and inventions, so as to create a social atmosphere of mass entrepreneurship and innovation. Various preferential policies can be implemented, such as tax incentives for innovative enterprises, to help more innovative enterprises solve the problem of financing difficulties.
Limitation and Future Recommendation
Study limitations: Since the latest economic census (the fourth) is in 2018, the data only go back to 2018. First economic census year is 2004, but a lack of industrial enterprises above designated size in 2005 and 2006 related data only in the large and medium-sized enterprises (data) of science and technology, the research object of this paper is the innovation of science and technology situation of industrial enterprises above designated size, so the time starting point of this study is 2008 (the beginning of the second economic census year).
Future outlook: With the arrival of the fifth economic census, the time range of the study can be extended to 2008 to 2023. So as to update and further understand the development and change of innovation efficiency of industrial enterprises above designated size in different industries in China.
Supplemental Material
sj-docx-1-sgo-10.1177_21582440231194578 – Supplemental material for Measurement and Analysis of the Scientific and Technological Innovation Efficiency of Industrial Enterprises above a Designated Scale in China
Supplemental material, sj-docx-1-sgo-10.1177_21582440231194578 for Measurement and Analysis of the Scientific and Technological Innovation Efficiency of Industrial Enterprises above a Designated Scale in China by Ma Lan, Wang Qi and Wang Dalei in SAGE Open
Supplemental Material
sj-docx-2-sgo-10.1177_21582440231194578 – Supplemental material for Measurement and Analysis of the Scientific and Technological Innovation Efficiency of Industrial Enterprises above a Designated Scale in China
Supplemental material, sj-docx-2-sgo-10.1177_21582440231194578 for Measurement and Analysis of the Scientific and Technological Innovation Efficiency of Industrial Enterprises above a Designated Scale in China by Ma Lan, Wang Qi and Wang Dalei in SAGE Open
Supplemental Material
sj-docx-3-sgo-10.1177_21582440231194578 – Supplemental material for Measurement and Analysis of the Scientific and Technological Innovation Efficiency of Industrial Enterprises above a Designated Scale in China
Supplemental material, sj-docx-3-sgo-10.1177_21582440231194578 for Measurement and Analysis of the Scientific and Technological Innovation Efficiency of Industrial Enterprises above a Designated Scale in China by Ma Lan, Wang Qi and Wang Dalei in SAGE Open
Supplemental Material
sj-xlsx-4-sgo-10.1177_21582440231194578 – Supplemental material for Measurement and Analysis of the Scientific and Technological Innovation Efficiency of Industrial Enterprises above a Designated Scale in China
Supplemental material, sj-xlsx-4-sgo-10.1177_21582440231194578 for Measurement and Analysis of the Scientific and Technological Innovation Efficiency of Industrial Enterprises above a Designated Scale in China by Ma Lan, Wang Qi and Wang Dalei in SAGE Open
Supplemental Material
sj-xlsx-5-sgo-10.1177_21582440231194578 – Supplemental material for Measurement and Analysis of the Scientific and Technological Innovation Efficiency of Industrial Enterprises above a Designated Scale in China
Supplemental material, sj-xlsx-5-sgo-10.1177_21582440231194578 for Measurement and Analysis of the Scientific and Technological Innovation Efficiency of Industrial Enterprises above a Designated Scale in China by Ma Lan, Wang Qi and Wang Dalei in SAGE Open
Supplemental Material
sj-xlsx-6-sgo-10.1177_21582440231194578 – Supplemental material for Measurement and Analysis of the Scientific and Technological Innovation Efficiency of Industrial Enterprises above a Designated Scale in China
Supplemental material, sj-xlsx-6-sgo-10.1177_21582440231194578 for Measurement and Analysis of the Scientific and Technological Innovation Efficiency of Industrial Enterprises above a Designated Scale in China by Ma Lan, Wang Qi and Wang Dalei in SAGE Open
Supplemental Material
sj-xlsx-7-sgo-10.1177_21582440231194578 – Supplemental material for Measurement and Analysis of the Scientific and Technological Innovation Efficiency of Industrial Enterprises above a Designated Scale in China
Supplemental material, sj-xlsx-7-sgo-10.1177_21582440231194578 for Measurement and Analysis of the Scientific and Technological Innovation Efficiency of Industrial Enterprises above a Designated Scale in China by Ma Lan, Wang Qi and Wang Dalei in SAGE Open
Supplemental Material
sj-xlsx-8-sgo-10.1177_21582440231194578 – Supplemental material for Measurement and Analysis of the Scientific and Technological Innovation Efficiency of Industrial Enterprises above a Designated Scale in China
Supplemental material, sj-xlsx-8-sgo-10.1177_21582440231194578 for Measurement and Analysis of the Scientific and Technological Innovation Efficiency of Industrial Enterprises above a Designated Scale in China by Ma Lan, Wang Qi and Wang Dalei in SAGE Open
Supplemental Material
sj-xlsx-9-sgo-10.1177_21582440231194578 – Supplemental material for Measurement and Analysis of the Scientific and Technological Innovation Efficiency of Industrial Enterprises above a Designated Scale in China
Supplemental material, sj-xlsx-9-sgo-10.1177_21582440231194578 for Measurement and Analysis of the Scientific and Technological Innovation Efficiency of Industrial Enterprises above a Designated Scale in China by Ma Lan, Wang Qi and Wang Dalei in SAGE Open
Footnotes
Acknowledgements
None.
Declaration of Conflicting Interests
The author(s) declared no potential conflicts of interest with respect to the research, authorship, and/or publication of this article.
Funding
The author(s) disclosed receipt of the following financial support for the research, authorship, and/or publication of this article: (1) Humanities and Social Science Research Project of Anhui Universities 2021 (Grant numbers: SK2021A0696; SK2021A0694); (2) Doctoral Research Start-up Fund Project of Suzhou University, 2021 (Grant number: 2021BSK015); and (3) Non-financial funded research projects of Suzhou University (Grant number: 2021xhx102).
Ethics Statement
Not applicable.
Supplemental Material
Supplemental material for this article is available online.
References
Supplementary Material
Please find the following supplemental material available below.
For Open Access articles published under a Creative Commons License, all supplemental material carries the same license as the article it is associated with.
For non-Open Access articles published, all supplemental material carries a non-exclusive license, and permission requests for re-use of supplemental material or any part of supplemental material shall be sent directly to the copyright owner as specified in the copyright notice associated with the article.