
Abstract
Under the dual goals of achieving carbon peak and carbon neutralization, it is of great practical significance to explore the impact of product information labeling on technological innovation. As an essential element in improving energy performance in consumer products, energy-efficiency labels (EEL) have played a vital role in the government’s portfolio of energy-efficiency improvement, technological progress, and carbon emission mitigation. We estimate the extent of the inductive effects of varying patent types on the relationship between the EEL system and technological innovation in a panel differences-in-differences framework based on the panel data of energy-saving patents and electricity-saving patents from 1998 to 2013 in China. Results indicate that the EEL system helps firms improve the ratio of energy-saving and electricity-saving patents to water-saving patents, and the rate of energy-saving and electricity-saving patents to all patents in the region. In another word, the EEL has a significant directed technological inducing effect. As for the role of the heterogeneity of patent types, the positive effects of the EEL system on invention patents are significantly suppressed in patent-for-utility models. Thus, it is suggested to improve the existing EEL system, gradually expand the product coverage of the EEL system, and increase the protection scope of utility model patents for achieving technological progress and sustainable development of society.
Introduction
With economic and social development as well as the improvement in the average living standard, China has witnessed a gradually increasing demand for resources and the environment. However, this extensive development has led to increasingly severe pressure on resources and the situation over the past decades. On the one hand, the acceleration of industrialization has put enormous pressure on the resources and ecological environment. On the other hand, low and disordered standards for products have caused serious secondary pollution to the ecological environment. For example, an emission trading market pilot helps reduce carbon dioxide emissions (F. Yang & Wang, 2022). In September 2020, President Xi Jinping announced at the 75th session of the United Nations General Assembly that China will strive to realize peaking carbon emissions by 2030 and achieve carbon neutrality by 2060. Under the background of the “dual carbon goals,” many enterprises in China need to further accelerate their energy structure adjustment, achieving the transition to the green economy, which will help China achieve the overall vision of carbon peak and carbon neutrality, among which energy saving and emission reduction are extremely urgent and important.
To achieve the energy-saving and emission reduction goal, the Chinese government has formulated a series of policy measures, such as the typical product information label and the development of product standards. When products, especially energy-saving products, and traditional products, of different criteria enter the market at the same time, energy-saving products probably will not be selected by consumers due to the disadvantage in prices and other reasons. If this information asymmetry cannot be reversed, this will lead to “adverse selection” in green development. To some extent, it is an economic phenomenon of “bad money drives out good money.” The purpose of the government’s necessary intervention in energy efficiency and climate change mitigation in consumer products, both voluntary and regulatory, by establishing product information labels and setting product standards is to improve energy performance and remove cost-ineffective, energy-wasting products from the marketplace, reduce the degree of information asymmetry as much as possible, and stimulate the development of cost-effective, energy-efficient technology (Wiel & McMahon, 2001). Since energy labeling systems have a significant impact, more and more sectors are developing their energy labeling systems to have their products included (Liu et al., 2021).
China has always attached great importance to energy conservation and emission reduction, and among the existing policies, the energy efficiency labeling system plays an important role in energy conservation and emission reduction. Compared to developed countries, China started late in terms of product information labels, so there are only a few successful cases. However, among a series of policies for product information labels in China, the energy-efficiency labels (EEL) system is one of the few strategies that has achieved remarkable results in a short implementation time. According to the data from the State Standardization Administration Committee, between 2005 and 2020, China’s energy-efficiency labeling standards have brought about cumulative electricity savings of more than 2.5 trillion kilowatt-hours, or an average of 170 billion kilowatt-hours per year, which is more than the annual power generation capacity of the Three Gorges Hydropower Station in China.
The prototype of China’s EEL system began to take shape as early as November 1997 when the Law of the People’s Republic of China on Energy Conservation was adopted, and the EEL management system was formally implemented in August 2004. The EEL system is a mandatory regulation, and many countries and international organizations have developed EEL for different products, which are used to define efficiency levels and specify minimum efficiency levels for products that are acceptable for sale or use. Energy-labeling systems apply to most household products, the efficiency classes and the standard play different roles in the encouragement of energy-efficient technology and the restriction of low-efficient products, once the product falls out of a certain energy efficiency range, this inefficient product is not allowed to be sold (Liu et al., 2021). Theoretically, this incentive system for energy efficiency improvement has a significant effect on innovation through the Porter effects, but little empirical research has been conducted related to this subject.
Therefore, this paper attempts to take the EEL system as a starting point, measure technological innovation by the number of energy and electricity-saving patents, explore the inducing mechanism of the EEL system on technological innovation, and conduct further in-depth research from the perspective of the directed inducing effects of the EEL system on technological innovation and the heterogeneity of the inducing effect on different patent types. The remainder of the paper is organized as follows. In the next section, we compare the relevant domestic and foreign literature, analyze the induced effects of the EEL system on technological innovation, the directed inductive effects of EEL on technological innovation, and the heterogeneity of the induced effects of innovation, and put forward the research hypotheses. In the subsequent section, we compare the development and evolution of China’s EEL system and analyze the annual growth of energy-saving and electricity-saving patents, social patents, and water-saving patents before and after the promulgation of the EEL system. The fourth part constructs an empirical model with dummy variables and introduces the variables and data. The fifth part analyzes and discusses the empirical results. In the concluding section, research conclusions are drawn, and policy recommendations are proposed.
The theoretical contribution of this study is that it enriches the research on the energy-efficiency labeling system on technological innovation in China and explores for the first time the heterogeneity of this inductive effects on different patent types, providing new theoretical guidance for the research related to the EEL system and technological innovation. In terms of practical significance, this study is conducive to the further improvement of the national EEL system, so that the state can better guide enterprises in energy conservation and emission reduction; at the same time, it is beneficial to the rationalization and systematization of China’s patent application structure, which is more conducive to the innovation development of small and medium-sized enterprises.
Literature and Hypotheses
The endogenous growth theory believes that technological innovation has the spillover effect of knowledge on economic growth. Sun and Zhu (2023) point out that, controlling resources and ignoring endogeneity problems both played robust and methodical roles in explaining the differences in individual study results. However, J. Huang and Guo (2022) propose to improve the level of innovation and reduce carbon emissions in other fields through technological innovation, increase green investment and renewable energy investment and combine with financial development to invest more funds in low-carbon environmental production industries and build an environmentally friendly system. However, Acemoglu et al. (2012) find that pollution and damages to the environment were not considered in the initial development stage of technology, and the path-dependence as well as the knowledge spillover effect of technology may lead to the path of technological progress being locked in those technologies with pollution emissions. If there are no exogenous impacts of policies, it is difficult to achieve the dual sustainable development goals of environmental protection and economic growth through technological advances. Therefore, it is necessary to rely on active government intervention to break the path-dependence of traditional high-emission technologies and promote the transition from technological innovation to the path of clean technology progress.
Due to the detrimental externality of resource and environmental problems, many countries and international organizations have adopted a series of systems and policies promoting the development of environmental governance, environmental restoration, energy conservation, emission reduction, and cleaner production with the help of the “visible hand” to correct market failures. Galeotti et al. (2020) shows that environmental and energy policies, such as innovation, productivity, competitiveness and energy, and carbon efficiency, have positive impacts on economic outcomes. A similar observation is made by Fan et al. (2021), showing that the combination of environmental tax policies and pollution control subsidy policies can effectively solve externality problems, realizing a virtuous circle of pollution reduction and corporate governance, and achieving a virtuous circle of emission reduction and economic benefits.
The energy efficiency label, reflecting the energy efficiency grade of energy-using products, is an information label for strengthening energy conservation management, promoting the progress of energy conservation technology, improving the energy efficiency of energy-using products, and promoting high-efficiency energy-saving products. To protect the ecological environment, this performance indicator has played an important role in innovation. Girod et al. (2017), based on econometric estimations with a comprehensive data set including 550 policy measures over 30 years (1980–2009) and covering 21 European countries, reports a significantly positive relationship between policies targeting efficient energy use in the household sector and the number of patented energy-efficiency inventions. A comparison of the different policy types reveals a particularly strong influence of financial subsidies and energy labels. In addition, J. Huang et al. (2021) indicate that energy patents are not a powerful instrument for controlling carbon emissions. However, energy patents originating from enterprises and scientific institutions exert a positive effect in reducing carbon emissions, and energy patents originating from higher education institutions enhance these effects. The utility type of energy patents significantly reduces carbon emissions, but the creation type offsets this positive effect.
As one of the important ways to improve energy efficiency, the promoting effects of energy efficiency label systems in improving environmental performance, promoting energy-saving management, and technological progress have been widely recognized. However, the energy label system in China was introduced relatively late and related studies are qualitative research, leading to little literature empirically exploring the impacts of energy efficiency label systems on technological innovation. At present, national studies on EEL are mostly conducted from the perspectives of institutional design and execution. Stadelmann and Schubert (2018) show how different designs of energy labels affect the purchase of household appliances. Energy efficiency labels have become an important tool in promoting environmentally friendly products. Kuhn et al. (2022) provide insights into how to enhance the impact of energy efficiency labels in middle-income countries. In Zhang et al. (2021)’s research, suggestions are made to further promote the development of the household appliance market and energy-efficiency labeling. Huang et al. (2016) put forward suggestions for the establishment and implementation of this system in China by studying foreign EEL systems. The researchers propose five policies to alleviate the problem, that is, (a) develop renewable energy resources, (b) increase energy prices, (c) improve energy efficiency, (d) build a rational energy prices system, and (e) improve consumer behavior. There are also a few documents that investigate the influence of this institutional implementation on producers and customers. For example, Ma (2009) studied the impact of the EEL system on the household electrical appliance industry. Additionally, Stasiuk and Maison (2022) show that substantial substitution exists between clean energy and the fossil fuels of coal and natural gas in the U.S. electricity sector. They also underscore the importance of energy resources in the process of economic growth and development of the United States. Tao and Yu (2011) evaluated the impacts of the standards on the environment, manufacturers, and consumers over a long-term period of 2003 to 2023. Although the EEL system aims to strengthen the management of energy conservation and promote the progress of energy-saving technologies, only a few studies have empirically verified the influence of this policy on technological innovation. Therefore, it is necessary to use China’s data to study how to stimulate innovation through an energy labeling system, to improve and solve the resources and environment externality problems, and to provide ideas for China and other developing countries to improve technological progress by EEL system.
In this section, we set forth the relevant literature that guides our theoretical basis to formulate hypotheses that will be empirically tested. The literature review of this paper mainly focuses on how energy labeling system promotes technological innovation to achieve the sustainable development of the environment and economy. Related literature is reviewed from the aspects of how the EEL system stimulates technological innovation and the how EEL system leads to directed innovation and the inducement effects among different patent types.
Innovation Impacts of EEL System
The impact of energy efficiency labeling systems on technological innovation has aroused wide attention. Newell et al. (1999) find that higher energy prices, in combination with energy-efficiency labels, induced innovations that increased the energy efficiency of consumer durables from 1958 to 1993. Gillingham et al. (2009) also show that energy efficiency labels promote the development of innovations by supporting the early adoption of novel technologies (e.g., by pointing to their superior efficiency level with an “A” rating). Equivalent results are found by Noailly (2010) who reported similarities between trends in innovation and energy policy based on the patent counts related to energy efficiency in buildings in the Netherlands. Besides, Shao and Wang (2022) also show that energy efficiency in China could be significantly improved by domestic innovation and regional technology diffusion. In a nutshell, different paths of technological progress have differential effects on energy efficiency improvements. To sum up, the inducement effect of energy efficiency policy on technological innovation has been verified. Accordingly, the following hypothesis is proposed:
Hypothesis 1: Energy efficiency labeling system has inducement effects on technological innovation.
Directed Innovation Impact of EEL System
From the above we know, the implementation of the EEL system, to a certain extent, increases the number of energy-saving patent inventions. However, the increase in patent counts may also be an equal proportion increase caused by social technological progress. Currently, there is a lack of empirical studies on the induction effects the of EEL system to evaluate biased technological progress. Most of the existing scholars have studied the directed inducement effects of environmental policies on technological innovation. For instance, Johnstone et al. (2010), on a relationship between environmental policies and technological innovation in the specific case of renewable energy, find that public policy has a strong significant positive impact on determining patent applications. Different types of policy instruments are effective for different renewable energy sources. A similar case study about the impact of environmental regulation on Chinese firms conducted by Zhao et al. (2015) shows environmental regulation plays a significant role in technological innovation. Lindman and Söderholm (2016) examined the impacts of the two policies, public R&D support, and feed-in tariff schemes, on innovation with the patent application data in the wind energy sector for four western European countries, which show that public R&D support policies have a greater impact on wind power innovation when both policies are used. The above research, to some extent, shows that policies have a directed inducement effect on technological innovation. EEL system is an important policy to improve energy efficiency, and its inductive effect on technological innovation may be directed. Based on this, the following hypothesis is proposed.
Hypothesis 2: Energy efficiency labeling system has inductive effects on directed technological progress.
Innovation Impacts of EEL System by Patent Type Heterogeneity
In previous studies, patent data has been widely used to measure the technological progress of the whole nation or industry. For example, Park (2017) proposed that patent data can capture three dimensions of technological capability, namely the simple number of patents, the number of sectors of patent registration, and the number of citations. In terms of the types of patents in China, they are often divided into invention patents, utility model patents, and design patents. As a supplement to invention patents, utility model patents and design patents have similarities and differences with it. Therefore, it is necessary to analyze the inductive effects of the EEL system on technological progress by different patent types.
In the existing literature, Boztosun (2010) explored the positive effects of utility models on promoting innovation advances. Kim et al. (2012) used a panel dataset of over 70 countries and find that patentable innovations contribute to economic growth in developed countries, while utility models in innovation are conducive to innovation and growth in developing economies. Taking China’s pilot emission trading policy as a quasi-natural experiment, Du et al. (2021) examined the green innovation effect and the heterogeneity was further discussed according to the patent types, the results show that there is a patent type heterogeneity between the green invention innovation effect and the green utility model innovation effect.
Although the heterogeneity of patent types has attracted the attention of scholars, few pieces of literature have explored the heterogeneity analysis of the induction effect of the EEL system on technological innovation from the perspective of patent type differences. Research on the inductive effect of the EEL system on technological innovation according to different types of patents is helpful to identify the differentiation between the inductive effect of the EEL system on technological innovation, which provides a new idea for further improving China’s EEL system. Based on this, the following hypothesis is proposed.
Hypothesis 3: The inductive effects of energy efficiency labeling systems on different types of technological innovation are different.
Description of EEL and Innovation in China
With the advantages of less input, quick results, more significant impacts, and prominent effects on energy conservation and environmental protection, the energy efficiency criteria and the EEL system have been widely recognized in the international community. As a result, they have become crucial essential policy tools for each country to strengthen energy-saving management, improve energy efficiency, standardize the energy-consuming product market, and promote the progress of energy-saving technology.
China formulated Regulations on Energy Label in 2004 and first applied this system to household refrigerators and air conditioners on 1st March 2005. The implementation and development of this system have achieved remarkable results. By the end of March 2015, more than 30 types of products had been covered. Furthermore, the new Regulations on Energy Labels (the 35th order in 2016) were released and implemented in 2016.
As a significant compulsory policy, the EEL system has attained sound economic and social benefits since its implementation. Firstly, the system has standardized the energy-consuming product market as it continually improves (Martínez-Molina et al., 2016). Furthermore, it has cultivated a large group of key enterprises with its prominent energy-saving effect. Finally, as its market recognition improves (S. Yang, 2015), it affects the behavior of consumers in an all-around way (Kusaka et al., 2012). The EEL system has become China’s important energy-saving policies where is just like in countries worldwide. The following part will thoroughly analyze the relationship between the EEL system and technological progress. Table 1 describes the growth of China’s energy-saving and electricity-saving patents, water-saving patents, and all patents before and after 2004.
The Average Annual Growth Rate of Patents Before and After 2004.

The following results can be obtained from Table 1. Firstly, in terms of energy-saving and electricity-saving patents, the average annual growth rate of original copyrights, utility model patents, and the total number of patients were 27.68%, 13.85%, and 17.19% respectively from 1998 to 2004. Besides, Besides, the average growth rate of those three was 38.16%, 31.21%, and 17.19% from 2005 to 2013, which increased by 38.16%, 31.21%, and 33.51%, respectively, when compared to the growth rate during the previous period ranging from 1998 to 2004.
Secondly, regarding water-saving patents, the average growth rate of patents for invention, utility model patents, and the total number of patients, was 30.40%, 21.92%, and 23.61% in the former stage. In comparison, those were 26.84%, 15.27%, and 18.65% respectively in the latter stage, with the growth rate of the last stage being lower than that of the former stage.
Thirdly, in terms of all patents, the average growth rate of patents for invention, utility model patents, and the total number of patients were 32.03%, 15.41%, and 20.42% before 2005, before the average growth rate for these three patents was raised to 30.16%, 26.41% and 27.95% in the period from 2005 to 2013. Although the growth rate of, original patents was slightly lower than that of the previous period, the growth rate of utility model patents increased by 71.38%, which led to a 36.88% increase in the growth rate of the total number of patients with the effects of the rapid growth of utility model patents.
Fourthly, the average growth rate of energy-saving and electricity-saving patents, as well as water-saving patents, demonstrate a “scissors difference.” The average growth rate of the energy-saving and electricity-saving patents was lower than that of the water-saving patents in the first stage while it was higher than that of the latter stage. Also, the average growth rate of the energy-saving and electricity-saving patents in the first stage was higher than that in the second stage, which was contrary to the average growth rate trend of the water-saving patents.
Fifthly, the average growth rate of energy-saving and electricity-saving patents and all patents of the two stages also formed a “scissors difference.” Despite the total number of patents and utility model patents still increasing in the latter stage, the average growth rate of the energy-saving and electricity-saving patents was lower than that of all copyrights from 1998 to 2004, with the patterns switching in the period from 2005 to 2013.
To sum up, independent of horizontal or vertical comparisons, the average growth rates of energy-saving and electricity-saving patents experienced tremendous changes after the implementation of the EEL system, which can preliminarily show that the EEL system accelerates the growth of energy-saving and electricity-saving patents, the further empirical tests will be conducted based on this study.
Empirical Modeling
Methodology
The practical test of this paper includes the following three aspects: (a) the trial of the inductive effect of the EEL system on the technology process; (b) the examination of the inductive effect of the EEL system on directed technology, and (c) the analysis of the differentiation of the inductive effect.
Test of Inductive Effects on Technological Progress
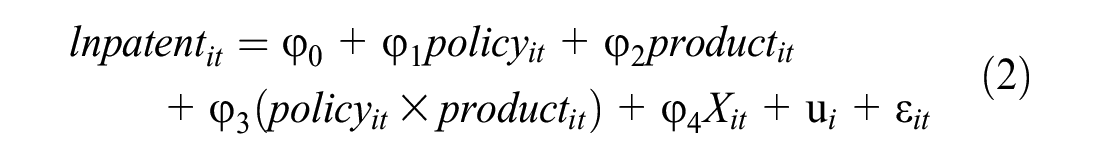
We used patent data as a proxy variable for technological innovation. On the one hand, patents represent technological progress. On the other hand, with the number of licenses as the dependent variable, we can intuitively estimate the elasticity coefficient of the effect of policies on patent quantities. This paper constructs an empirical model with a single dummy variable at first:

where
We studied the product catalogs of China’s energy efficiency labeling system (Table A1) and found that the first batch of product catalogs that implemented EEL included only two items, household refrigerators, and room air conditioners. The second batch of catalogs containing other products was released 2 years after the policy was introduced, so the sample regions that did not produce the two categories of refrigerators as well as air conditioners during this period may have an impact on the regression results. Based on the above analysis, this paper attempts to start a robustness test by changing the sample period as well as changing the sample capacity. Based on the production distribution of the first batch of EEL product catalogs in China and concerning the study of Chen and Wu (2015), the EEL system can be regarded as an approximate natural experiment, and the regions producing household refrigerators and room air conditioners (with corresponding production systems) are identified as the experimental group, while the provinces (cities and autonomous regions) not producing these two types of products are the control group, and the following panel data model is constructed using a difference-in-difference estimation for the robustness test.
where
Test of Inductive Effects on Directed Technological Progress
Given that the quantity growth of energy-saving and electricity-saving patents possibly are a general reflection of the whole social and technological progress, which is irrelevant to policies, this paper constructs an empirical model with a single dummy variable at first:

where
Test of Heterogeneous Inductive Effects on Different Patent Types
Based on the former models, this paper analyses the inductive effect of the EEL system on different patients according to the degree of innovation, and it constructs the following model:

where
Data Source and Processing
Data of Energy-Saving and Electricity-Saving Patents
Existing empirical studies have not reached an agreement on the proxy variable for technological progress. At present, total factor productivity (TFP) (He et al., 2012) and patents (Feng & Chen, 2016) are usually selected as proxy variables of technological progress. Compared to TFP, patent data is more intuitive and targeted. Aghion et al. (2016) uses patents as the proxy variable when they analyzed the influence exerted by tax-inclusive fuel prices on technological innovation in the automobile industry. Furthermore, Calel and Dechezlepretre (2016) adopted patents when they studied the effect of the European Union Emission Trading Scheme (EU ETS) on technology change. Accordingly, this paper measures technological progress with patent data as well.
This paper collects patent data by typing the keywords in China’s Patent Full-text Database (China National Knowledge Infrastructure Version) for the following two reasons. On the one hand, data in this database comes from the Intellectual Property Publishing House of State Intellectual Property Office covering the patents from 1985 until now, which is highly authoritative. On the other hand, we can retrieve in the database using retrieval items such as application date, publication date, patent name, abstract and province name (code), etc., making it convenient to operate and collect data. There are three kinds of patents in China: design patents, utility model patents, and patents for invention with embedded degrees of innovation increasing in sequence. This paper collects the data of original copyrights and utility model patents, before dividing them into two periods by years according to their application time. As the National Development and Reform Commission and the General Administration of Quality Supervision, Inspection, and Quarantine of the People’s Republic of China jointly issued the revised Measures for the Administration of Energy Efficiency Labels on February 29 and took into effect from June 1, 2016, the original management measures were repealed at the same time, which may lead to changes in the statistical caliber of data around 2016. Also, considering that it usually takes 1 to 3 years for a license to get approved and publicized, this paper selects the research period ranging from 1998 to 2013. The data was collected in October and November 2016 to ensure that most of the patents applied in 2013 had been publicized. At last, this paper constructs a panel database of energy-saving and electricity-saving patents of 30 provinces (cities and municipalities except for Tibet, Hong Kong, Macao, and Taiwan) due to a lack of data, from 1998 to 2013.
Control Variables
The control variables of this paper include two types: (a) social economy; and (b) scientific and technological research and development. The social economy mainly includes variables like investment level, economic level, industrial structure, degree of openness, financial development degree, and economic environment. These can be represented respectively by investment rate (the ratio of total fixed assets investment across the country to GDP), per capita GDP (the constant price of 10,000 yuan, with 1997 as the base year), industrial structure (the proportion of industrial-added value in GDP), foreign investment (the percentage of foreign direct investment in GDP), financial development degree (the ratio of deposits and loans of the national banking system at the year-end to GDP), and the ratio of unprofitable enterprises (the ratio of the number of unprofitable enterprises above designated size in the name of enterprises above selected format). Scientific and technological research and development mainly include human capital and investment in research and development, which are respectively represented by the average schooling year of the population aged 6 and above, intramural expenditure on research and development with the constant price (100 million yuan, with 1997 as the base year). Due to the data availability of some control variables, the empirical test uses the data from 1999 to 2013.
Empirical Results and Analysis
Analysis of Inductive Effects on Technological Progress
As the quantity of patents is not a constant variable, it is more reasonable to adopt a count data model. According to the initial analysis, the variance of the explained variable, namely energy-saving and electricity-saving patent quantity, was 3,206 times the average from 1999 to 2013, creating excessive decentralization. Therefore, it is more effective to use negative binomial regression. Table 2 is the estimated results of the panel count data model.
Regression Results of Inductive Effects on Technological Progress.

Note. ***, **, and * respectively represent the evaluation value being significant at evaluation values being significant at the level of 1%, 5%, and 10%. The value in round brackets are t statistical amounts under the robust standard errors and the values in the square brackets are p-values.
Estimates and Discussion
According to the test statistics, the 95% confidence interval of excessive dispersion parameters α is [0.30, 0.64], rejecting “H: α = 0,” so it is suggested that extreme decentralization is present, with the binominal regression being used to improve efficiency. The likelihood ratio test result strongly rejected the null hypothesis of the mixed negative binomial regression, so the panel negative binomial regression of random effect was used. At the same time, the Hausman test result does not reject the panel negative binomial regression of random facts.
Table 2 shows that the estimated coefficients of the EEL system are positive independently of the type of regression (mixed negative binomial regression, panel negative binomial regression of random effect, or panel negative binomial regression of fixed effect) and are all significant at the 1% level. It means that the EEL system has a positive impact on energy-saving and electricity-saving patents with robust results. In other words, the EEL system can effectively induce technological innovation. This result verifies research hypothesis 1 and is consistent with the findings of Gillingham et al. (2009). From the perspective of demand-pull, the implementation of China’s EEL system effectively improves the asymmetric information between consumers and enterprises’ energy-using products, enhances consumers’ higher willingness to pay for energy-saving innovations, pulls the demand for energy-saving and electricity-saving products, and ultimately induces technological innovation; at the same time, since China’s EEL system is mandatory and the authenticity of energy efficiency information is regulated by the government, relevant enterprises will be pressured to save energy and electricity, which in turn will lead to technological innovation for enhancing the competitiveness of the enterprises in the industry.
Look at the regression results for the control variables:
Firstly, the estimated coefficient of the investment rate is positive at a significance level of 1%. This shows that the improvement of investment rates can effectively promote an increase in the quantity of energy-saving and electricity-saving patents, meaning that investment has a positive effect on technological progress, and the decrease in investment rate may reduce innovative impetus. From another perspective, it poses new challenges to the productive society at present. On the one hand, the relationship between investment and consumption should be coordinated with the development of the economy. On the other hand, as the economic structure is upgrading, the impetus of technological innovation input needs to be tapped under the context of high consumption rates and low investment rates.
Secondly, the estimated coefficient of per capita GDP and its square are respectively – 0.239 and 0.0307 at a significance level of 1%, demonstrating a U-shaped law of the per capita GDP with the quantity of energy-saving and electricity-saving patents. This result enriches the environmental Kuznets curve from another perspective. Mostly, people may overlook, environmental quality to pursue economic growth when economic income is low. Still, economic growth will stimulate people’s demand for environmental quality along with economic development (Albrizio et al., 2017), which leads to the U-shaped relationship between per capita GDP and technological progress.
Thirdly, the estimated coefficient of the financial development degree is negative at a significance level of 10%. Promoting granted energy-saving patents by investment is one of the most effective ways, and the rise of the proportion of the balance of saving deposits and loans in financial institutions at year-end to GDP did not promote the increment of patents granted. Although increasing attention to financial development improves the financial environment, it is not enough for energy-saving patent funding, even existing some certain distortions. Therefore, the financial industry must be reinforced to help to serve the real economy and technological innovation.
Fourthly, the estimated coefficient of the economic environment is −5.494 at the significance level of 1%, which means that a deterioration of the economic climate will hamper technological progress. This may be due to that technological innovation concentrates on large and medium-sized enterprises, increasing the ratio of unprofitable enterprises above the designated size. This results in less investment in the change of society and, thus, restrains technological progress.
Fifthly, the estimated coefficient of investment in research and development and human capital is positive and significant at 1% and 5%, respectively, indicating that improving investment in research and development and strengthening basic education is beneficial to technological progress. This is because the increase in R&D investment injects funds into innovation activities, contributing to the output of innovation results. In addition, an educated labor force has higher marginal output, and the increase in average years of education improves the quality of human capital to a certain extent. As important participants in technological innovation, human capital can serve as a crucial factor of production to enhance the total factor productivity and accelerate the granting of energy-saving patents by promoting technological innovation.
Lastly, the estimated coefficient of industrial structure and foreign investment are 0.0924 and −0.471, respectively, but are not significant statistically. It may be caused by the following reasons: on the one hand, although China’s industrial structure upgrading has achieved some progress, the current industrial structure of China is dominated by the secondary industry, and the number of applications and actual patents granted for energy conservation in the secondary industry is relatively low in China, and the effect of the industrial structure upgrading is not that significant, causing the statistics to be insignificant, which illustrates that upgrading industrial structure needs to be further accelerated to promote technological progress. On the other hand, due to the current economic development stage and the international industrial specialization situation, the “pollution haven” phenomenon exists in China, where some foreign enterprises transfer their dirty industries to regions with poor environmental standards in China. Fortunately, China’s government has paid attention to environmental management and achieved some progress after improving the quality of foreign investment attraction.
Robustness Test
To test the robustness of the above results, the provinces (cities and regions including Inner Mongolia Autonomous Region, Fujian, Hainan, Yunnan, Qinghai, Ningxia, and Xinjiang) that did not produce the two types of products, household refrigerators, and room air conditioners, from 2004 to 2007 were set as the control group of production systems based on the statistical data. The provinces (cities and regions) that had a sudden change in production systems (from yes to no) are the five regions of Hebei, Shanxi, Jilin, Heilongjiang, and Guangxi, which were used as control groups. The results of the difference-in-difference robustness test are shown in Table 3.
Robustness Test.

Note.***, ** and * respectively represent the evaluation values being significant at the level of 1%, 5% and 10%. The value in round brackets are t statistical amounts under the robust standard errors and the values in the square brackets are p-values.
Models (1) to (3) in Table 3 set the estimated period from 1999 to 2006. Model (1) does not include any control variables, model (2) adds a series of control variables, and model (3) discards the sample in the region where the production system has undergone abrupt changes for estimation. From the estimation results, the above three models indicate that the energy efficiency labeling system has a significant contribution to patent growth. Models (4) to (6) set the sample data ranging from 1999 to 2007, similar to models (1) to (3), without controlling any variables, and are estimated after adding a series of control variables and discarding the production system change area, respectively. The estimated coefficients of “EEL system × production system” are 0.354, 0.296, and 0.380, respectively, which are all significant at the 5% significance level. From the estimations of the six models in Table 3, the positive effect of the EEL system on patent growth is relatively significant. Combining the estimation results in Tables 2 and 3, it is found that the conclusions are consistent, regardless of changing the sample period, adding control variables, or changing the estimation method, that is, the inductive effect of the EEL system on technological innovation is relatively robust.
Analysis of Inductive Effects on Directed Technological Progress
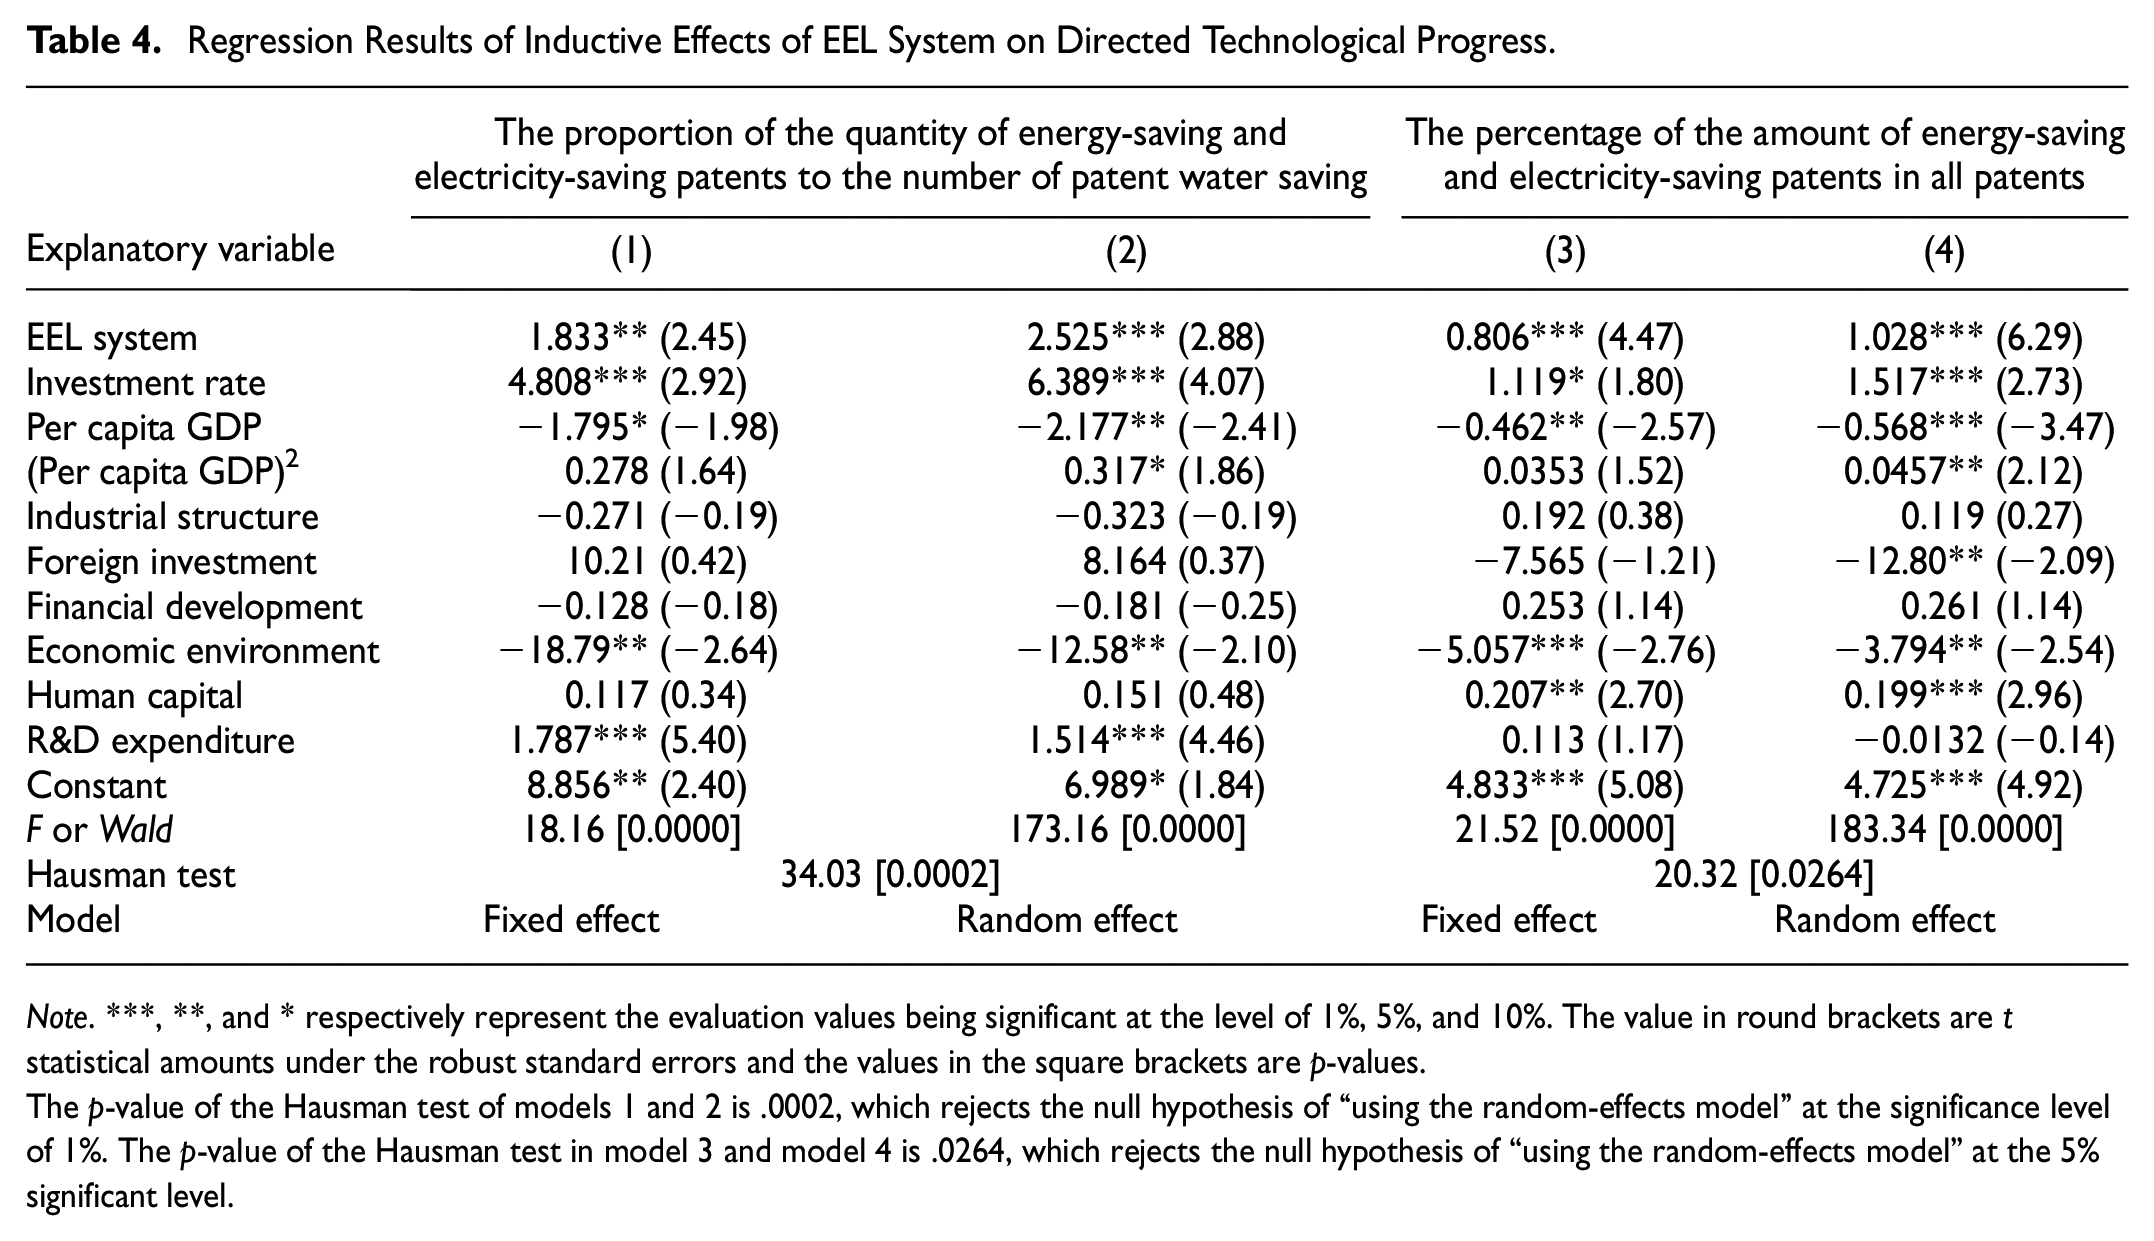
Although the above-mentioned empirical results show that the energy efficiency label has positive influences on the quantity of energy-saving and electricity-saving patents, this change might be caused by other policies. It also may be due to the whole technology progress, with the number of energy-saving and electricity-saving patents possibly just increasing in equal proportion. To further assess the effect of the EEL system on energy-saving and electricity-saving patents, the following part will study from the perspective of the ratio of patents. Table 4 reports the estimated results of patent ratios, among which the explained variables of models 1 and 2 are the ratio of the quantity of energy-saving and electricity-saving patents to the number of water-saving licenses. Furthermore, the explained variables of models 3 and 4 are the quantity of energy-saving and electricity-saving patents per 100 patents in this area.
Regression Results of Inductive Effects of EEL System on Directed Technological Progress.
Note. ***, **, and * respectively represent the evaluation values being significant at the level of 1%, 5%, and 10%. The value in round brackets are t statistical amounts under the robust standard errors and the values in the square brackets are p-values.
The p-value of the Hausman test of models 1 and 2 is .0002, which rejects the null hypothesis of “using the random-effects model” at the significance level of 1%. The p-value of the Hausman test in model 3 and model 4 is .0264, which rejects the null hypothesis of “using the random-effects model” at the 5% significant level.
According to the estimated results of model 1, the estimated coefficient of the EEL system is positive at the significance level of 5%. Water-saving patents, as well as energy-saving and electricity-saving patents, are of the same patent type. Apart from the EEL system, policy environment restraints affected mostly can be regarded as the same in the same region. Therefore, the results primarily demonstrate that the EEL system has an inductive effect on directed technology. This may be caused by the fact that the EEL system has a corresponding public product catalog, so companies will conduct R&D and technological upgrades for their products based on the catalog, while companies will not increase their R&D efforts for product types excluded in the catalog. This result verifies research hypothesis 2. From the estimated results of model 1, the expected effects of other control variables are the same in terms of influencing directions with Table 2, excepting the significant difference.
According to the estimated results of model 3, the estimated coefficient of the EEL system is 0.806 at the significance level of 1%, which means that this system can increase the proportion of energy-saving and electricity-saving patents in all patents. Primarily, this system has directed an inductive effect on technology. From the estimated result of model 3, we found the following: firstly, improving investment in social investment as well as investment in research and development are conducive to directed technological progress in energy-saving and electricity-saving technology; secondly, deterioration of economic environment will restrain directed technological advancement in energy-saving and electricity-saving technology. This may be because the research and development of green technology concentrate on broad and middle-sized enterprises and as the ratio of enterprises running at a loss above a designated size increases, there is a corresponding decrease in the investment in innovation; thirdly, although the influencing directions of other control variables are the same as that of Table 2, there are some differences in significance, which shows that the effect of these factors on directed technological progress needs to be further tested and analyzed.
In general, the estimated result of Table 4 shows that the EEL system has a positive impact on directed technological progress in energy-saving and electricity-saving patents when compared to copyrights of the same type or all patents. Thus, we hold that the EEL system has an inductive effect on directed technological progress.
Heterogeneity Analysis of Inductive Effects
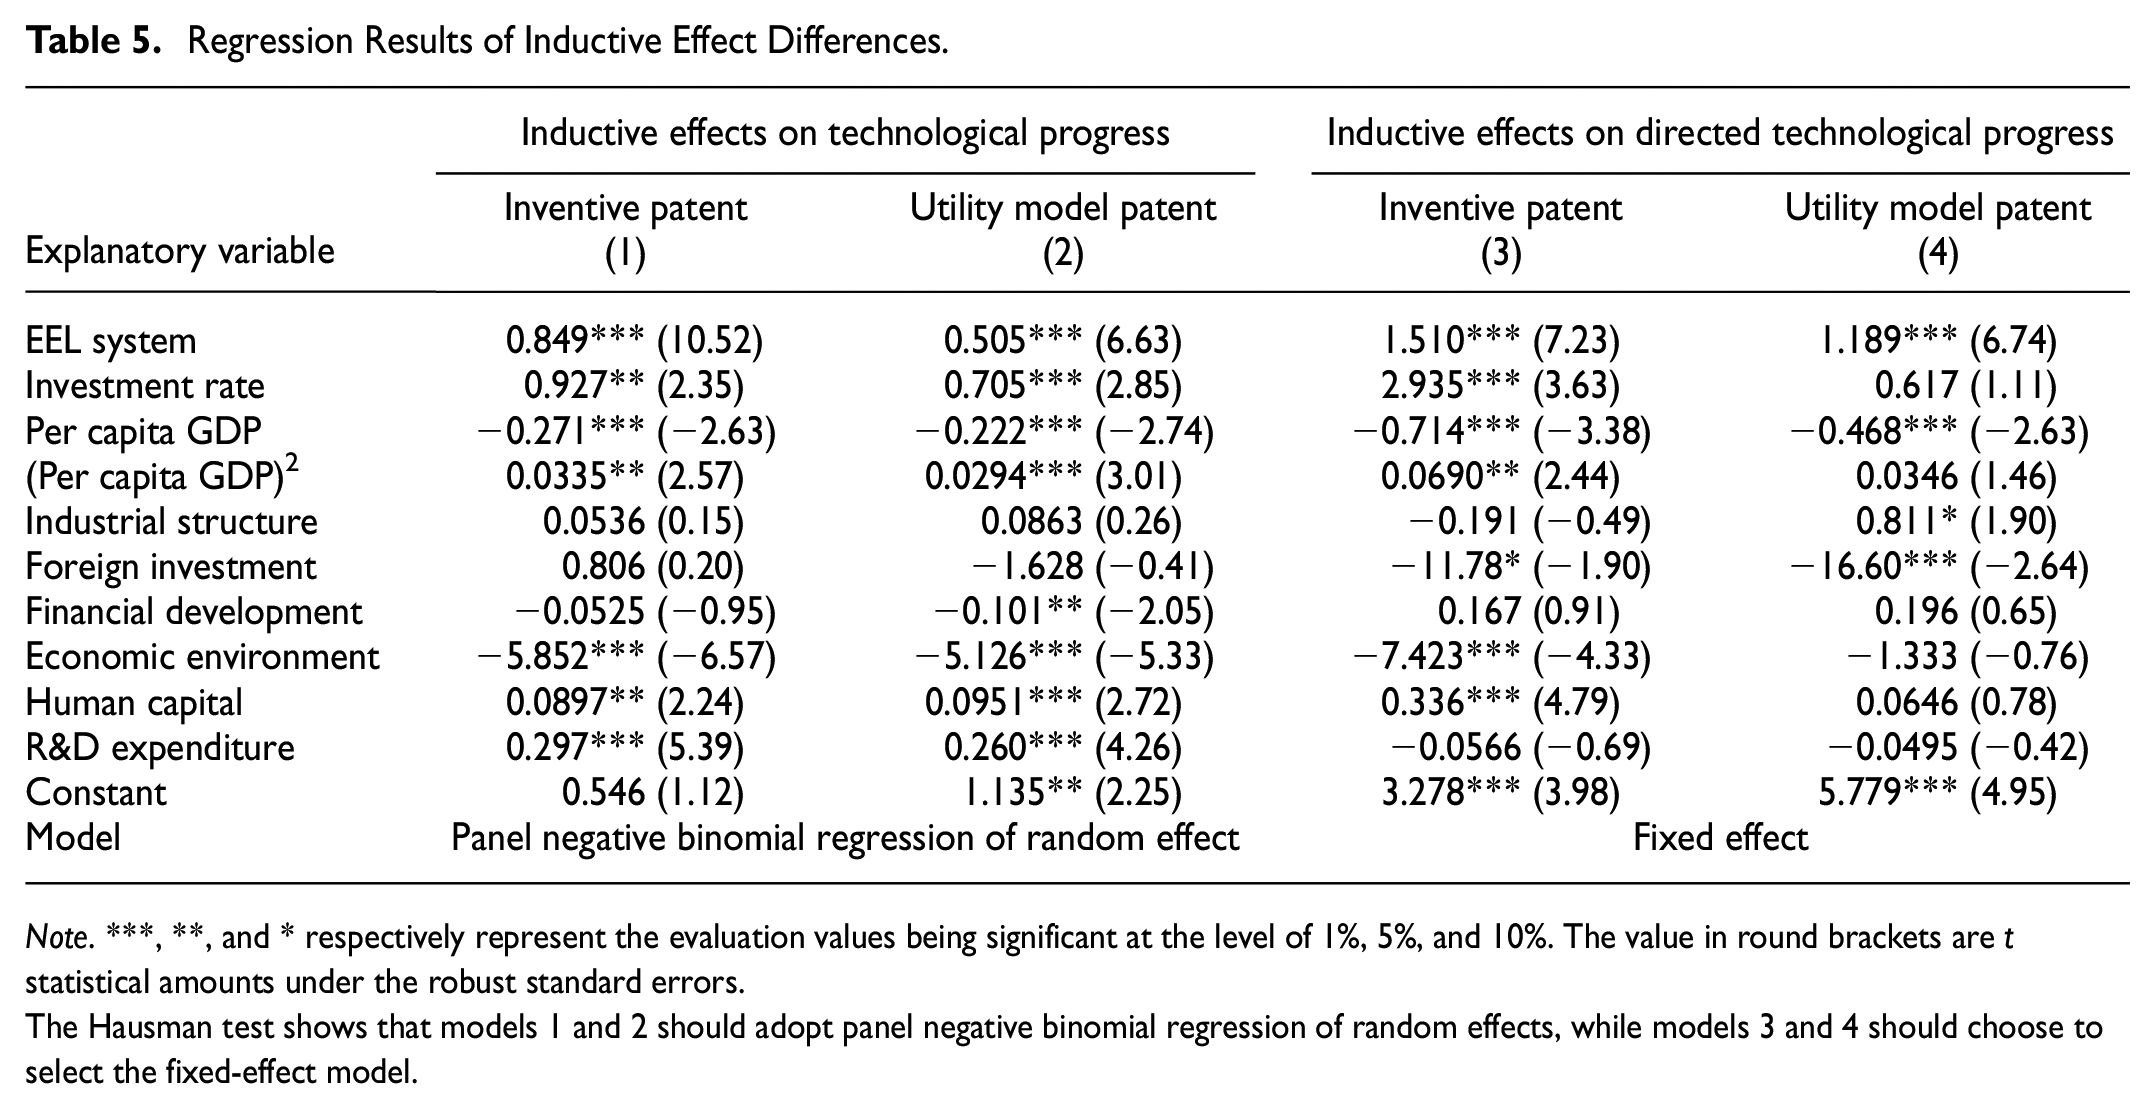
To further analyze the inductive impact of the EEL system on energy-saving and electricity-saving technology, the following part will study the influence exerted by this system on different patients according to the innovation degree. Based on the analysis above, this paper analyzes in terms of the quantity and ratio of patents. The explained variable in models 1 and 2 of Table 5 is the number of invention patents and utility model patents, while the explained variable in models 3 and 4 is the number of invention patents and utility model patents in the category of energy-saving and electricity-saving per 100 patents.
Regression Results of Inductive Effect Differences.
Note. ***, **, and * respectively represent the evaluation values being significant at the level of 1%, 5%, and 10%. The value in round brackets are t statistical amounts under the robust standard errors.
The Hausman test shows that models 1 and 2 should adopt panel negative binomial regression of random effects, while models 3 and 4 should choose to select the fixed-effect model.
From Table 5, we found the following: at first, the estimated coefficients of the EEL system in models 1 and 3 are positive at a significance level of 1%, which means that the EEL system has a positive influence on the increase of the absolute quantity and relative quantity of inventive patents. In other words, this system has a noticeable apparent inductive effect on original patents; secondly, the estimation coefficient of the EEL system in both models 2 and 4 are positive at the significance level of 1%. The results show that the EEL system has an all-around influence on utility model patents independent of whether we investigate an absolute quantity or in relative abundance. Essentially, this system has a significant inductive effect on a utility model patent.
At last, from the perspective of differentiation of induced effects of invention and utility model patents, when comparing model 1 with model 2 as well as model 3 with model 4 respectively in terms of absolute quantity and relative quantity, we found that the coefficient of the EEL system in model 1 is more significant than that in model 2. In comparison, the ratio of the EEL system in model 3 is more abundant, more extensive, more substantial, and more significant than that in model 4. It means that the EEL system has a strong, more considerable influence on original patents than that on utility model patents. It may be because the inventiveness of invention patents is higher than that of utility model patents, and the scope of invention patents is also broader than that of utility model patents. At the same time, invention patents have a longer protection period than utility model patents. Therefore, under the influence of the EEL system, enterprises are more inclined to research invention patents than utility model patents. This finding verifies research hypothesis 3.
Conclusions and Enlightenment
This paper, based on the panel data of energy-saving patents and electricity-saving patents from 1998 to 2013, used the EEL system as an entry point and explored the induced effect of the EEL system on technological innovation. We found that: (a) the EEL system has a significant positive impact on energy and electricity-saving patents. That is, the EEL system has a significant inducing effect on technological innovation; (b) the EEL system can improve the ratio of energy and electricity-saving patents to water-saving patents as well as the energy and electricity-saving patents to all patents, indicating the policy has a significant directed technological inducing effect; and (c) relatively, the EEL system has a significant inducement effect on the inventions patents with higher innovation level.
Due to different kinds of historical reasons, the information on the quality and standards of the Chinese commodity market is often in vague condition, causing information asymmetry that customers fail to identify. This not only causes various product quality problems to happen in China but also hampers the construction of “China Quality” and technological progress in China. Starting from the energy efficiency labeling system, this paper studies the inducing effect of product information labeling on energy-saving patents and invention patents with a high degree of innovation. This paper shows that despite only having been implemented for a short time within a limited range, the EEL system has exerted a significant inductive effect on technology. This conclusion provides the impetus for us to further improve the EEL system and promote technological innovation.
To this end, we try to put forward the following policy suggestions: (a) improving the existing EEL system and promoting product information labeling in the commodity market are strongly suggested to reduce information asymmetry in the market and build a healthy market transaction order, significantly inducing technological progress and promoting sustainable development; (b) it is suggested to expand the coverage of the EEL system products gradually. At present, it is only limited to some household appliances, lighting appliances, a few office supplies, and some industrial equipment, and a small number of energy-using products with wide coverage and great energy-saving potential are still not included in the scope of energy-efficiency labeling management. Given the bias of the EEL system in inducing technological innovation, expanding the coverage of products under the EEL system can bring the inducing effect of the EEL system on technological innovation into play in different industries and help improve the overall efficiency of innovation; and (c) increasing the scope of objects protected by utility model patents is recommended. From the perspective of the heterogeneity of the induced effect of the EEL system on technological innovation, utility model patents have more room in promoting technological innovation. Increasing the scope of the object range of utility model patent protection can avoid excessive differences between the number of invention patent applications and the number of utility model patent applications, which is conducive to making the structure of China’s patent applications more rational and systematic, and more helpful to the innovative development of the SMEs in China.
We hope to make up for the shortcomings of existing studies on the induction effects of the EEL system on technological innovation, explore the differences of this influencing effect on different patent types, enrich the positive research conducted with Chinese EEL data and patents data, and providing new ideas for the research related to EEL system and technological innovation. While there are some limitations in this paper. Due to the change in the statistical caliber of research data, the sample year of this paper is limited, and subsequent studies can consider expanding the period from other perspectives; secondly, this paper selects the provincial patent data that does not explore the induced effects of EEL system on the patent data of enterprises at the micro-level, and subsequent studies can be further conducted on this basis.
Footnotes
Appendix
Evolution of China’s Energy Efficiency Labeling System.

| Product batch and document number | Product name | Energy efficiency standard | Implementation time |
|---|---|---|---|
| The first batch (Announcement No. 71 of 2004) | Household refrigerator | GB 12021.2-2003 | March 1, 2005 |
| Room air conditioner | GB 12021.3-2004 | ||
| The second batch (Announcement No. 65 of 2006) | Electric washing machine | GB 12021.4-2004 | March 1, 2007 |
| Unit air conditioner | GB 19576-2004 | ||
| Third batch (Announcement No. 8 of 2008) | Self-ballasted fluorescent lamp | GB 19044-2003 | June 1, 2008 |
| High-pressure sodium lamp | GB 19573-2004 | ||
| Small and medium-sized three-phase asynchronous motor | GB 18613-2006 | ||
| water chilling unit | GB 19577-2004 | ||
| Domestic gas fast water heater and gas heating water heater | GB 20665-2006 | ||
| Fourth batch (Announcement No. 64 of 2008) | Speed controllable room air conditioner | GB 21455-2008 | March 1, 2009 |
| Multi-connected air conditioning (heat pump) unit | GB 21454-2008 | ||
| Water storage electric water heater | GB 21519-2008 | ||
| Household electromagnetic stove | GB 21456-2008 | ||
| Computer display | GB 21520-2008 | ||
| Copier | GB 21521-2008 | ||
| Fifth batch (Announcement No. 17 of 2009) | Automatic rice cooker | GB 12021.6-2008 | March 1, 2010 |
| AC fan | GB 12021.9-2008 | ||
| AC contactor | GB 21518-2008 | ||
| Positive displacement air compressor | GB 19153-2009 | ||
| Sixth batch (Announcement No. 3 of 2010) | Power transformer | GB 24790-2009 | November 1, 2010 |
| ventilator | GB 19761-2009 | ||
| Seventh batch (Announcement No. 28 of 2010) | Flat panel TV | GB 24850-2010 | March 1, 2011 |
| Microwave ovens for household and similar purposes | GB 24849-2010 | ||
| Eighth batch (Announcement No. 22 of 2011) | Printer, fax machine | GB 25956-2010 | January 1, 2012 |
| Digital television receiver | GB 25957-2010 | ||
| Ninth batch (Announcement No. 19 of 2011) | Refrigerated display cabinet of remote condensing unit | GB 26920.1-2011 | September 1, 2012 |
| Household solar water heating system | GB 26969-2011 | ||
| Tenth batch (Announcement No. 39 of 2012) | Microcomputer | GB 28380-2012 | February 1, 2013 |
| Eleventh batch (Announcement No. 18 of 2014) | Range hood | GB 29539-2013 | January 1, 2015 |
| Heat pump water heater | GB 29541-2013 | ||
| Household electromagnetic stove | GB 21456-2014 | ||
| Copiers, printers, and fax machines | GB 21521-2014 | ||
| Twelfth batch (Announcement No. 7 of 2015) | Domestic gas appliances | GB 30720-2014 | December 1, 2015 |
| Commercial gas stove | GB 30531-2014 | ||
| Water (ground) source heat pump unit | GB 30721-2014 | ||
| Lithium bromide absorption chiller | GB 29540-2013 | ||
| Decree no. 35 of 2016 | The revised measures for the administration of energy efficiency labeling were issued | June 1, 2016 | |
| 13th batch (Announcement No. 14 of 2016) | Revision of 33 products implemented | Implement all amendments to regulations | October 1, 2016 |
| Nondirectional self-ballasting LED lamp for general lighting | GB 30255-2013 | ||
| Projector | GB 32028-2015 |
Declaration of Conflicting Interests
The author(s) declared no potential conflicts of interest with respect to the research, authorship, and/or publication of this article.
Funding
The author(s) disclosed receipt of the following financial support for the research, authorship, and/or publication of this article: This research was funded by National Social Science Fund of China (grant number 19CJY001), National Natural Science Found of China (grant numbers 71863020 and 72264014), and 2021 Research project of Huamao Financial Research Institute, Henan University of Economics and Law (grant number 2021029).