
Abstract
We study the conditional gender wage gap among faculty at public research universities in the U.S. We begin by using a cross-sectional dataset from 2016 to replicate the long-standing finding in research that, conditional on rich controls, female faculty earn less than their male colleagues. Next, we construct a data panel to track the evolution of the wage gap through 2021. We show that the gender wage gap is narrowing. It declined by more than 50% over the course of our data panel to the point where by 2021, it is no longer detectable at conventional levels of statistical significance.
Introduction
In 2016, President Obama encouraged businesses across the U.S. to contribute to efforts to narrow the gender wage gap through the White House Equal Pay Pledge. By the end of 2016, over 100 businesses, organizations, and entities had taken The Pledge, including major corporations such as Adobe, AT&T, and Mastercard, among others (Doukas, 2016). This is just one example of a recent wave of policy efforts, and popular sentiment, focused on gender equity in the labor market. Academic institutions are no exception in these efforts: the recent emphasis on gender pay equity is exemplified by newly-formed committees and commissions on college campuses across the U.S., such as the Louisiana State University Council on Gender Equity and the Commission on Women and Gender Equity in Academia at the University of Rochester.
Historically, research shows a persistent gender pay gap among university faculty in the U.S. Most estimates from the late 1980s through mid-2010s estimate an unconditional pay gap of about 20% of salaries. The portion that is not explained by observable factors—that is, the conditional gap (where the primary conditioning variables are experience, fields of study, and research productivity)—is about 4% to 6% of salaries (Blackaby et al., 2005; Ginther & Hayes, 2003; Li & Koedel, 2017; Porter et al., 2008; Toutkoushian & Conley 2005; Umbach, 2006). Previous studies find the gender wage gap is similar in magnitude in samples that mix public- and private-sector faculty, and studies that focus exclusively on the public sector where most faculty work.
In the context of the renewed focus on gender equity at institutions throughout the U.S., including universities, it is of interest to understand the recent evolution of the gender wage gap. We study the evolution of the gap among tenured and tenure-track faculty at public universities from 2016 to 2021. The baseline sample in 2016 includes just over 3,800 faculty at 40 public research universities. Using this baseline sample, we first reproduce the common finding from previous research that, conditional on rich controls, there is a non-negligible gender wage gap favoring men. We then use our data panel to show the gap narrowed by more than 50% from 2016 to 2021. The gap in 2021 is substantively small—at just over 1% of the average faculty member’s salary—and not statistically detectable.
A unique feature of our study is that we construct a true data panel tracking the same faculty over time and across institutions, which allows us to document how faculty who change universities influence the gender wage gap. Focusing on mobility within the U.S. public sector—where we can observe post-move wages—we show the magnitude of the gender wage gap is not influenced by faculty movers. This is because (a) the gender gap in wage growth among mobile faculty is modest (although it does favor men) and (b) most faculty do not move. We also consider faculty mobility outside the U.S. public sector. This portion of our analysis is more assumptive because we do not observe post-move wages for those who move to private and foreign universities. However, under reasonable assumptions, we find the gender wage gap in our sample, inclusive of these movers, has likely narrowed as well.
We test directly for two potential mechanisms that could drive the declining gender wage gap. First, we test whether differences in promotion rates favoring women contribute to the narrowing gap and find no evidence to support this hypothesis. Second, we test for a gender gap in the likelihood of receiving an atypically large raise during the period covered by our data panel. We find that women are much more likely to receive atypically large raises, driven by a gender difference among faculty who remain at their original institutions from 2016 to 2021.
We discuss several factors that likely contribute to our findings. First, women’s salaries may be increasing due to recent, direct efforts by universities to ameliorate the gender pay gap among faculty—for example, women may be increasingly targeted for equity pay adjustments by university administrators. Second, in addition to impacting the gender gap directly, universities’ equity efforts may also affect the labor market in gender-specific ways, such as by increasing the demand for female faculty and female willingness-to-move, which can lead to raises for women via retention efforts. Through these direct and indirect channels, the increased equity focus in academia would be expected to increase the prevalence of large raises among women (Blackaby et al., 2005; Groysberg et al., 2022; Leslie et al., 2017), which is consistent with our findings. Third, complementary policies that facilitate equity enhancements also likely contribute to the narrowing gender wage gap in our sample. Continued increases in the salience of pay transparency (Bae et al., 2022; Baker et al., 2021; Obloj & Zenger, 2022) and gendered changes to tenure-clock policies are examples (Antecol et al., 2018; Manchester et al., 2013). Ultimately, while we are unable to pinpoint the precise cause(s), our findings suggest the factors that have contributed to the gender wage gap in academia historically are not operating in the same ways contemporarily.
The remainder of our paper proceeds as follows. First, we review the literature on the gender pay gap with a focus on evidence from U.S. faculty. Next, we describe our data, models, and findings. We follow this with tests to explore the potential for bias to drive our finding that the gender wage gap has narrowed; we find no evidence of bias. We then discuss potential explanations for our findings and conclude with a high-level summary of our results and suggestions for future research.
Previous Research
There is a large prior literature on the gender wage gap among faculty in the U.S. based on a variety of data sources and covering a variety of time periods. We review the most relevant studies in this section to identify empirical regularities and trends over time.
Studies of the gender wage gap using data from the late 1980s through the early 2000s consistently identify an unconditional gender wage gap at research universities of about 20%. The unexplained portion of the gap is in the range of 4% to 6% of salaries, or 20% to 30% of the unconditional gap. Most papers covering this period use data from the National Survey of Postsecondary Faculty (NSOPF), which was administered as a repeated cross-section four times beginning in the late 1980s through 2004 (Barbezat & Hughes, 2005; Porter et al., 2008; Toutkoushian, 1998; Toutkoushian & Conley, 2005), although papers that use other data sources reach similar conclusions (e.g., Carlin et al., 2013).
Several papers that use more recent data replicate earlier estimates of the unconditional and conditional wage gaps, suggesting the gaps have remained stagnant for decades. Li and Koedel (2017), using the same cross-sectional dataset from 2016 that we use as the baseline dataset in this paper, estimate unconditional and conditional gender wage gaps of 20% and 4% of salaries, respectively. These estimates match older estimates closely. Similarly, articles by Chen and Crown (2019) and Taylor et al. (2020)—who use recent administrative data panels from individual institutions spanning roughly 10 years and ending in 2016 and 2017, respectively (in each case, the institution is a public research university)—also support the stagnation hypothesis. Both papers report an unconditional gender wage gap of just over 20% and find that of the total gap, about a quarter remains unexplained after accounting for observables. Both sets of authors also estimate models that leverage their data panels to allow for changes to the conditional and unconditional gaps over time. Taylor et al. (2020) find no evidence of a trend in the gender wage gap, and Chen and Crown (2019) find that it widened, but acknowledge the result may be idiosyncratic to the institution they study.
While the bulk of the literature indicates large and stagnant gender pay gaps among faculty in the U.S., a recent study by Obloj and Zenger (2022) calls the stagnation narrative into question. These authors construct a data panel of public-university faculty in eight states from 1997 to 2017 and estimate significant declining trends in the conditional and unconditional gender wage gaps over this period. However, while the declining trends conflict with prior studies, Obloj and Zenger (2022) estimate wage gaps in the early years of their data panel that are higher than in other studies of U.S. faculty during the same time period, particularly for the conditional gap. Because their initial estimates of the gaps are so large, it allows them to estimate declining trends but still arrive at gap levels similar to other U.S. studies by the mid-2010s. For example, in 2016, the same year used by Li and Koedel (2017), Obloj and Zenger (2022) estimate a somewhat smaller unconditional wage gap—around 16% of salaries—and a similar conditional gap—around 4% of salaries. (Recent research in other countries, such as Baker et al. (2021) in Canada and Bachan and Bryson (2022) in England, also find the unconditional and conditional gender gaps have been narrowing. However, their estimates of the gender wage gap are well below comparable estimates from U.S. faculty during the same time periods, raising questions about how well their findings translate to the U.S. context.)
Given the ambiguity in the literature, our study makes three contributions. First, we conduct a panel study similar in spirit to Obloj and Zenger (2022) but anchored to the previous literature via the original Li and Koedel (2017) estimates. Second, we construct a true data panel tracking faculty over time, which allows us to document the influence of university movers on the gap, which is not possible in Obloj and Zenger (2022). Third, we extend the literature by providing the most recent evidence on the gender wage gap at U.S. academic institutions to date, through 2021.
Data
Our data panel is a direct expansion of the cross-sectional dataset originally used by Li and Koedel (2017). We first summarize their dataset and then describe the panel expansion. The original sample consists of tenured and tenure-track faculty at 40 selective, highly ranked public universities in the 2016 U.S. News and World Report rankings. The university list roughly corresponds to the 40 highest-ranked public universities in that year, although several small adjustments to the university sample were made for reasons discussed by Li and Koedel (2017). The focus on public universities was a practical consideration as wages are publicly available.
Faculty were sampled from six academic departments—biology, chemistry, economics, education leadership and policy, English, and sociology—three of which were randomly chosen at each university. Once a department was selected for sampling, all faculty listed on the department website were included in the dataset. In total, the dataset includes just over 3,800 tenured or tenure-track faculty from 120 academic departments at the 40 universities. The data were collected in Spring 2016, and Appendix Table A1 lists the universities and departments included.
It may raise concerns about generalizability that only six academic departments are represented in the Li and Koedel (2017) data. The decision to restrict the number of departments was made to improve their ability to model field-specific returns to research productivity, noting that their data collection process was labor intensive and constrained the total sample size (i.e., they traded off a greater breadth of fields for larger field-specific samples). Ultimately, the best evidence in favor of generalizability is that Li and Koedel’s (2017) estimates of the conditional and unconditional gender (and racial/ethnic) wage gaps are generally aligned with the larger literature, inclusive of studies that use data from many more fields.
For each university-by-department cell, data were collected for all tenure-track and tenured faculty on demographics, qualifications, research productivity, and salaries. Demographic and qualification data were collected from faculty members’ online profiles. The qualification data include each faculty member’s rank, years of experience, and their PhD-granting institution. For most faculty, experience is measured from the year the PhD was obtained as reported on faculty websites or CVs. In cases where a faculty member’s profile does not indicate the PhD year, experience is measured by the time since the first registered publication, either on the faculty member’s website (first choice) or on Scopus© (second choice). Between these sources, experience measures are available for 98% of the original cross-sectional sample. The PhD-granting institution was taken from each faculty member’s profile and is available for 94% of faculty. We divide PhD-granting institutions into four selectivity groups based on their rankings in U.S. News and World Report, inclusive of private universities.
The demographic variables—race/ethnicity and gender—were collected using visual inspections of faculty profiles available online. Faculty in the original dataset were grouped into one of five possible racial/ethnic categories—Asian, Black, Hispanic, White, and other/unknown—and one of three gender categories: male, female, and unknown. Li and Koedel (2017) report a high degree of interrater reliability for these variables: 95.5% for the race/ethnicity categories and 99.75% for the gender categories.
The research productivity measures were taken from externally generated faculty profiles on Scopus©. The dataset includes information on the number of publications, number of citations, and the h-index. For each metric, we standardize productivity within fields as follows:

Where
Individual-level wage data for faculty at most public universities in the U.S. are published online with a lag of about 1 year, in accordance with transparency laws in the U.S. on public worker pay. Of all tenure-track faculty included on the rosters in the original data collection, wage data were available for 94%. The primary reason for missing wage data—and in fact, the only reason we can identify given the comprehensive nature of wage reporting for public employees—is that the faculty member is new to the university or was on leave and did not draw a salary. Consistent with this explanation, Li and Koedel (2017) show that being a young professor is by far the strongest predictor of missing wage data in the 2016 sample.
There is also variability across states in how faculty wages are reported. Some states report base salaries, while others report salaries inclusive of supplemental pay (e.g., summer salary from grants). Like Obloj and Zenger (2022), we cannot disentangle the sources of faculty pay and use the data as reported publicly by states. Econometrically, our models include university fixed effects, which subsume state fixed effects and therefore hold reporting conditions within states fixed, although the reporting differences create some ambiguity in interpretation if the gender wage gap differs between base and supplemental pay. Again, we note the broad similarity of the original Li and Koedel (2017) estimates to estimates in previous studies (which use a variety of data sources) as evidence that this reporting issue is unlikely to affect our findings substantively.
To facilitate our current panel study of the gender wage gap, we collected follow-up data in 2021 for each faculty member in the original 2016 dataset from Li and Koedel (2017). For those who did not leave academia, this was straightforward. Those who left academia either moved to a non-academic position, retired, or passed away. Using information available online, we were able to find all faculty in the original dataset who left academia mid-career for non-academic positions. Retirements were confirmed whenever possible by official announcements. In some instances, when a highly senior, tenured faculty member was not found elsewhere online, we assumed they retired.
Among faculty who remained in academia, we collected updated information about their academic rank and wages. We were able to collect updated wage information for most, but not all, faculty. We summarize wage missingness in the 2021 data as follows. First, about 10.5% of the faculty with wage data in 2016 are missing wage data in 2021 for a reason unrelated to job mobility. These are mostly retirees (72%, or 7.6% of the original sample). Another 6.0% of the original sample changed jobs between 2016 and 2021. We recover wages for just over a third of these (about 2.1% of the original sample) who moved to another public university, leaving 3.9% of the sample with missing 2021 wages due to job mobility. The small remainder of faculty with missing wages did not move but we could find no wage data in 2021. In addition to these faculty with missing data, the wage data suggest a significant measurement problem for another 4.2% of faculty. These are faculty with wage decreases of more than 30% or wage increases above 100% (based on nominal salary growth), which we deem as outside of the bounds of what is realistic. These large changes likely reflect reporting fluctuations due to circumstances such as faculty leaves, partial sabbaticals, and temporary external salary support. We also treat these individuals as missing 2021 wage data. In total, we were able to recover usable 2021 wages for 81.4% of the original sample used by Li and Koedel (2017), as detailed in Table 1.
Documentation of Sample Attrition From Original Li and Koedel (2017) Dataset.

Note. One faculty member with non-identified gender was removed from the original Li and Koedel (2017) sample (their original N was 3,805).
Compared to other faculty panel studies, our sample retention rate is high (Ginther & Hayes, 2003; Weisshaar, 2017). The most important question about panel attrition is whether it is correlated with gender and wages in a way that could confound our analysis of the evolution of the gender wage gap. We devote considerable attention to this possibility below and find no evidence to suggest our findings are confounded by differential sample attrition by gender and wages.
Table 2 provides descriptive statistics for the baseline cross-sectional dataset from 2016, the panel sample with 2021 wages (divided by mobility status), and two data subsamples we use in supplementary models examining gender promotion gaps.
Descriptive Statistics.
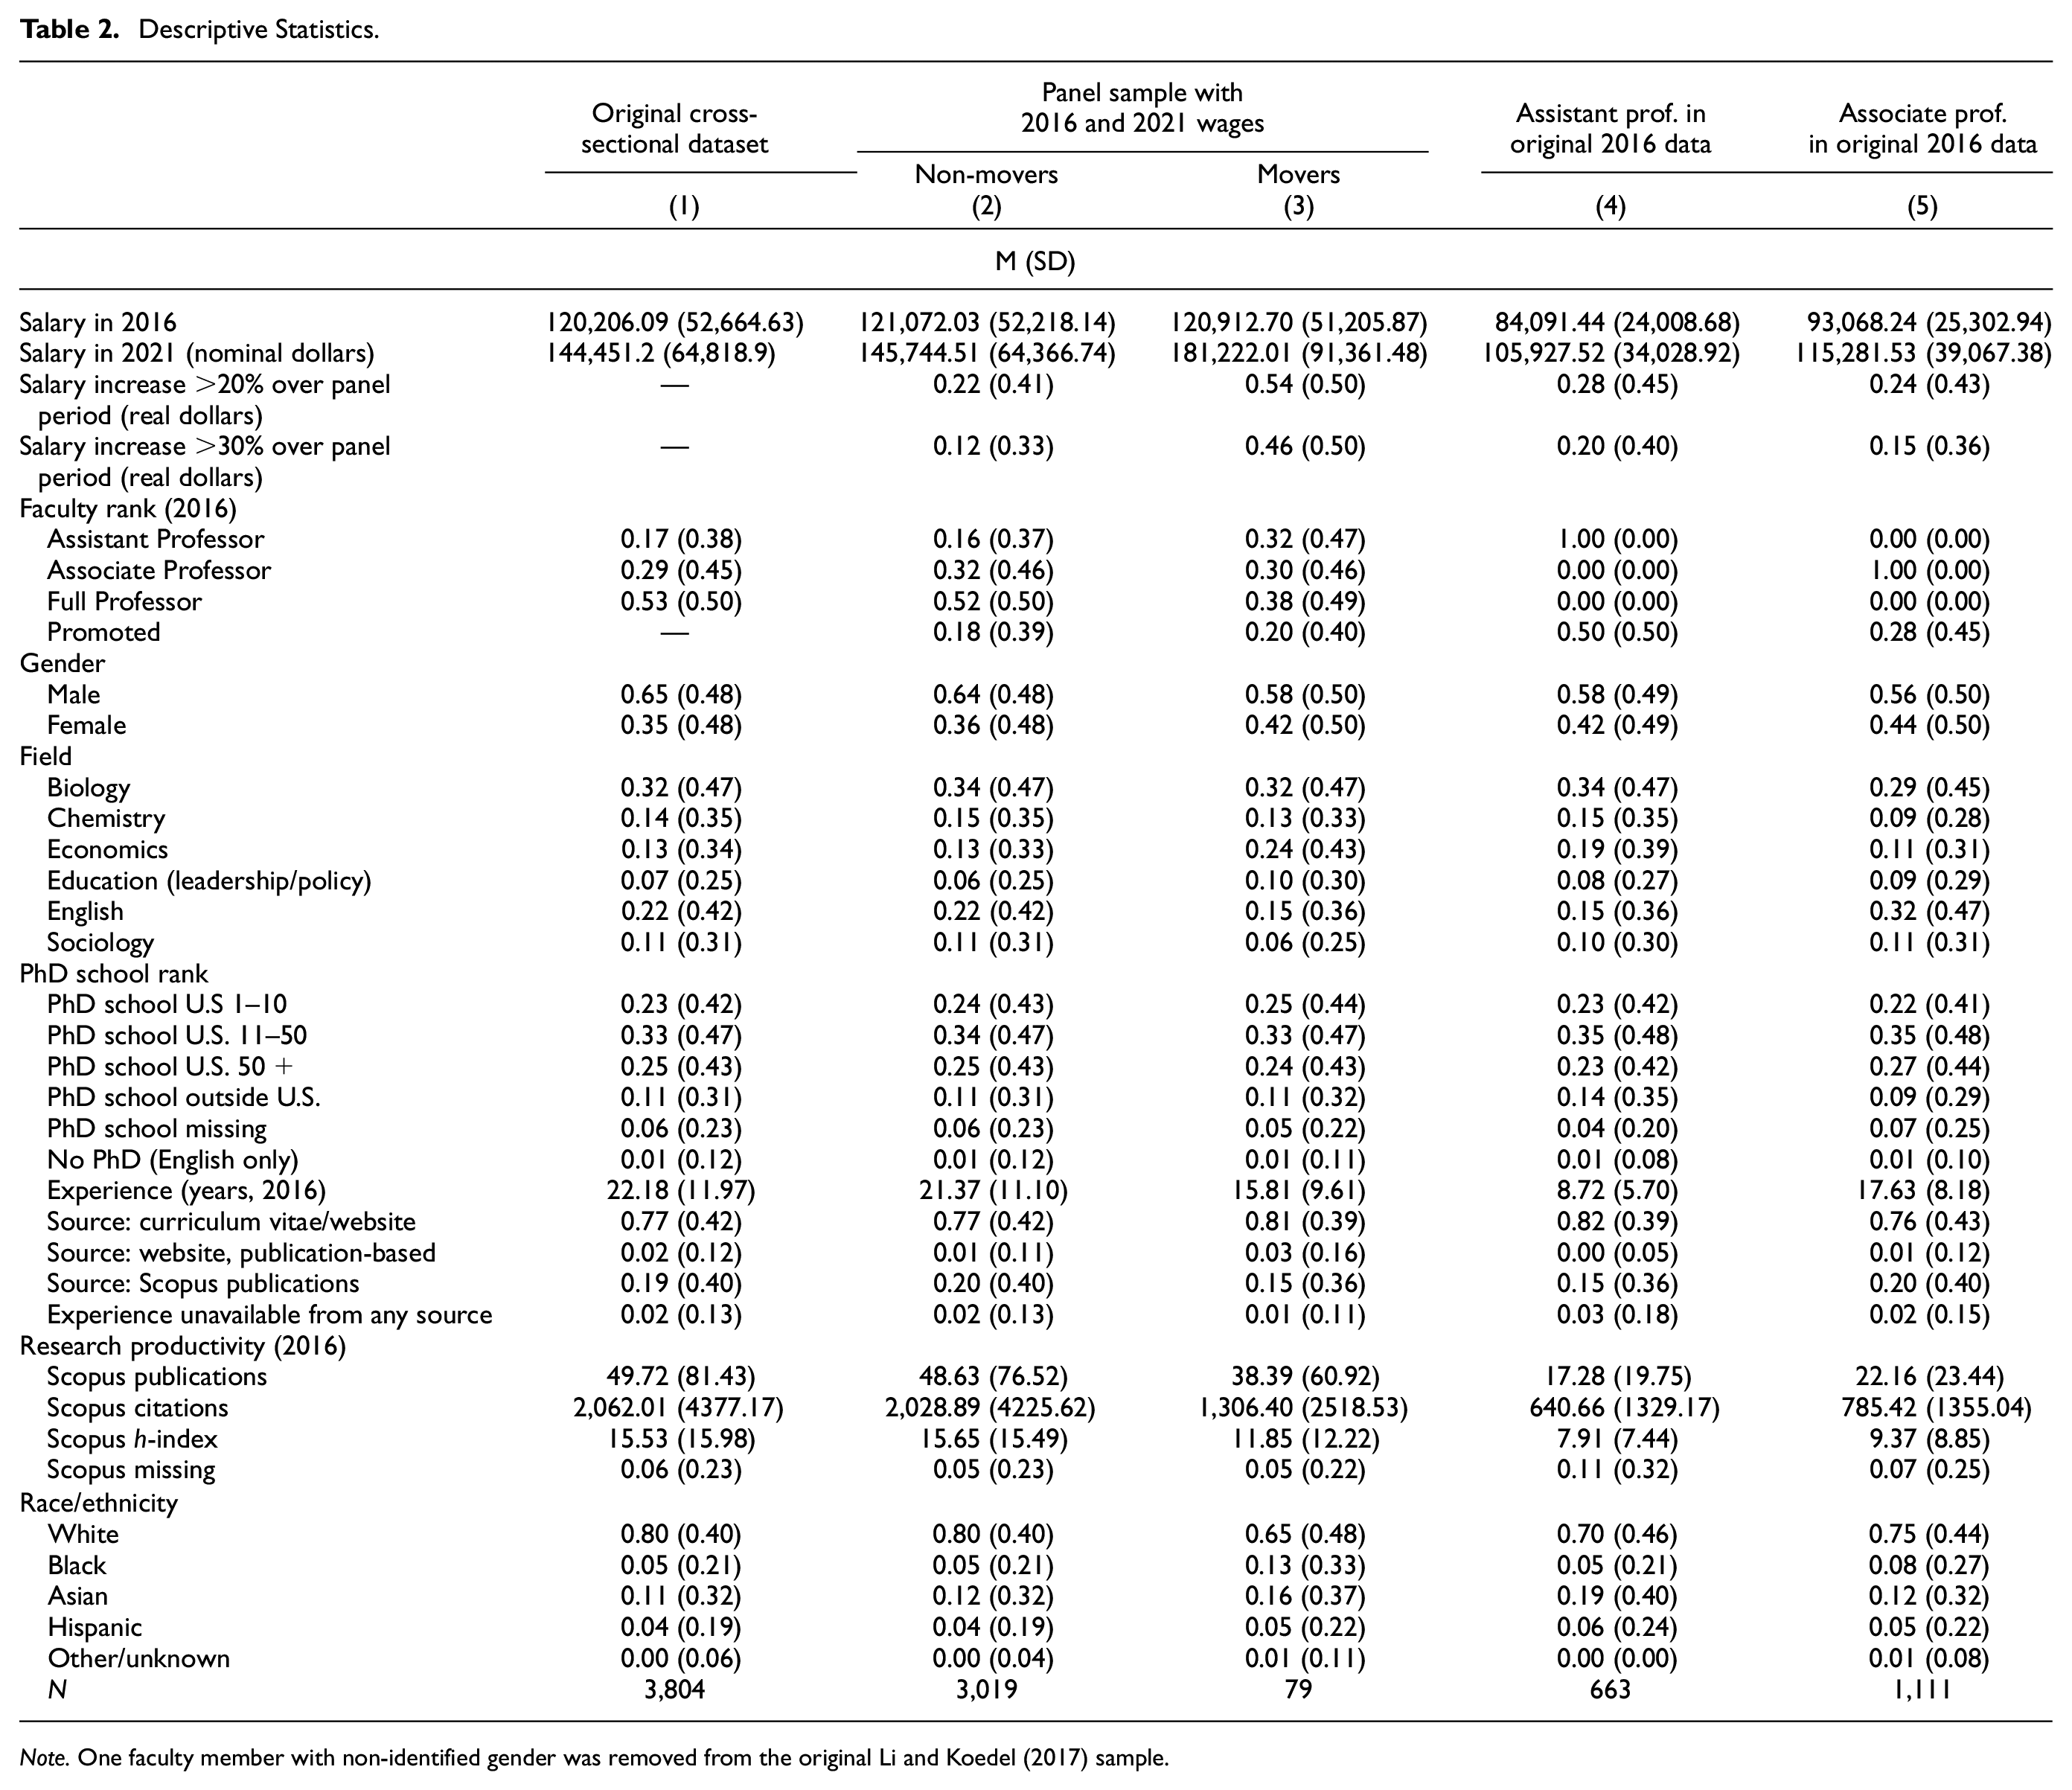
Note. One faculty member with non-identified gender was removed from the original Li and Koedel (2017) sample.
Methods and Primary Findings
We begin by using the following model to replicate Li and Koedel’s (2017) estimate of the conditional gender wage gap using the 2016 cross-sectional dataset:

where
Following Li and Koedel (2017), the X vector includes years of experience, the field-normalized h-index from Scopus©, and indicators for the PhD-granting institution’s quality. It also includes interactions of the field-normalized h-index and the field indicator variables to allow for differential earnings returns to research productivity across disciplines. For experience, Li and Koedel (2017) use a linear experience control, and we take this approach as well. We use the categories shown in Table 2 to control for the quality of the PhD-granting institution via binned indicator variables. We do not control for rank directly in equation (1) because of gender’s potential impact on promotions and the timing of promotions, which can impact wages (see: Brower & James, 2020; Ginther & Hayes, 2003; Ginther & Kahn, 2006). The university and field fixed effects ensure the gender wage gap is identified using within-university and within-field variation; or said differently, that static cross-university and cross-field differences (e.g., differences in gender representation across fields) do not influence our estimate of the gap.
The conditional gender wage gap is captured in equation (2) by the parameter
Conditional Gender Wage Gap in 2016 and 2021, and Differential Salary Growth by Gender From 2016 to 2021, Non-Mover Sample.
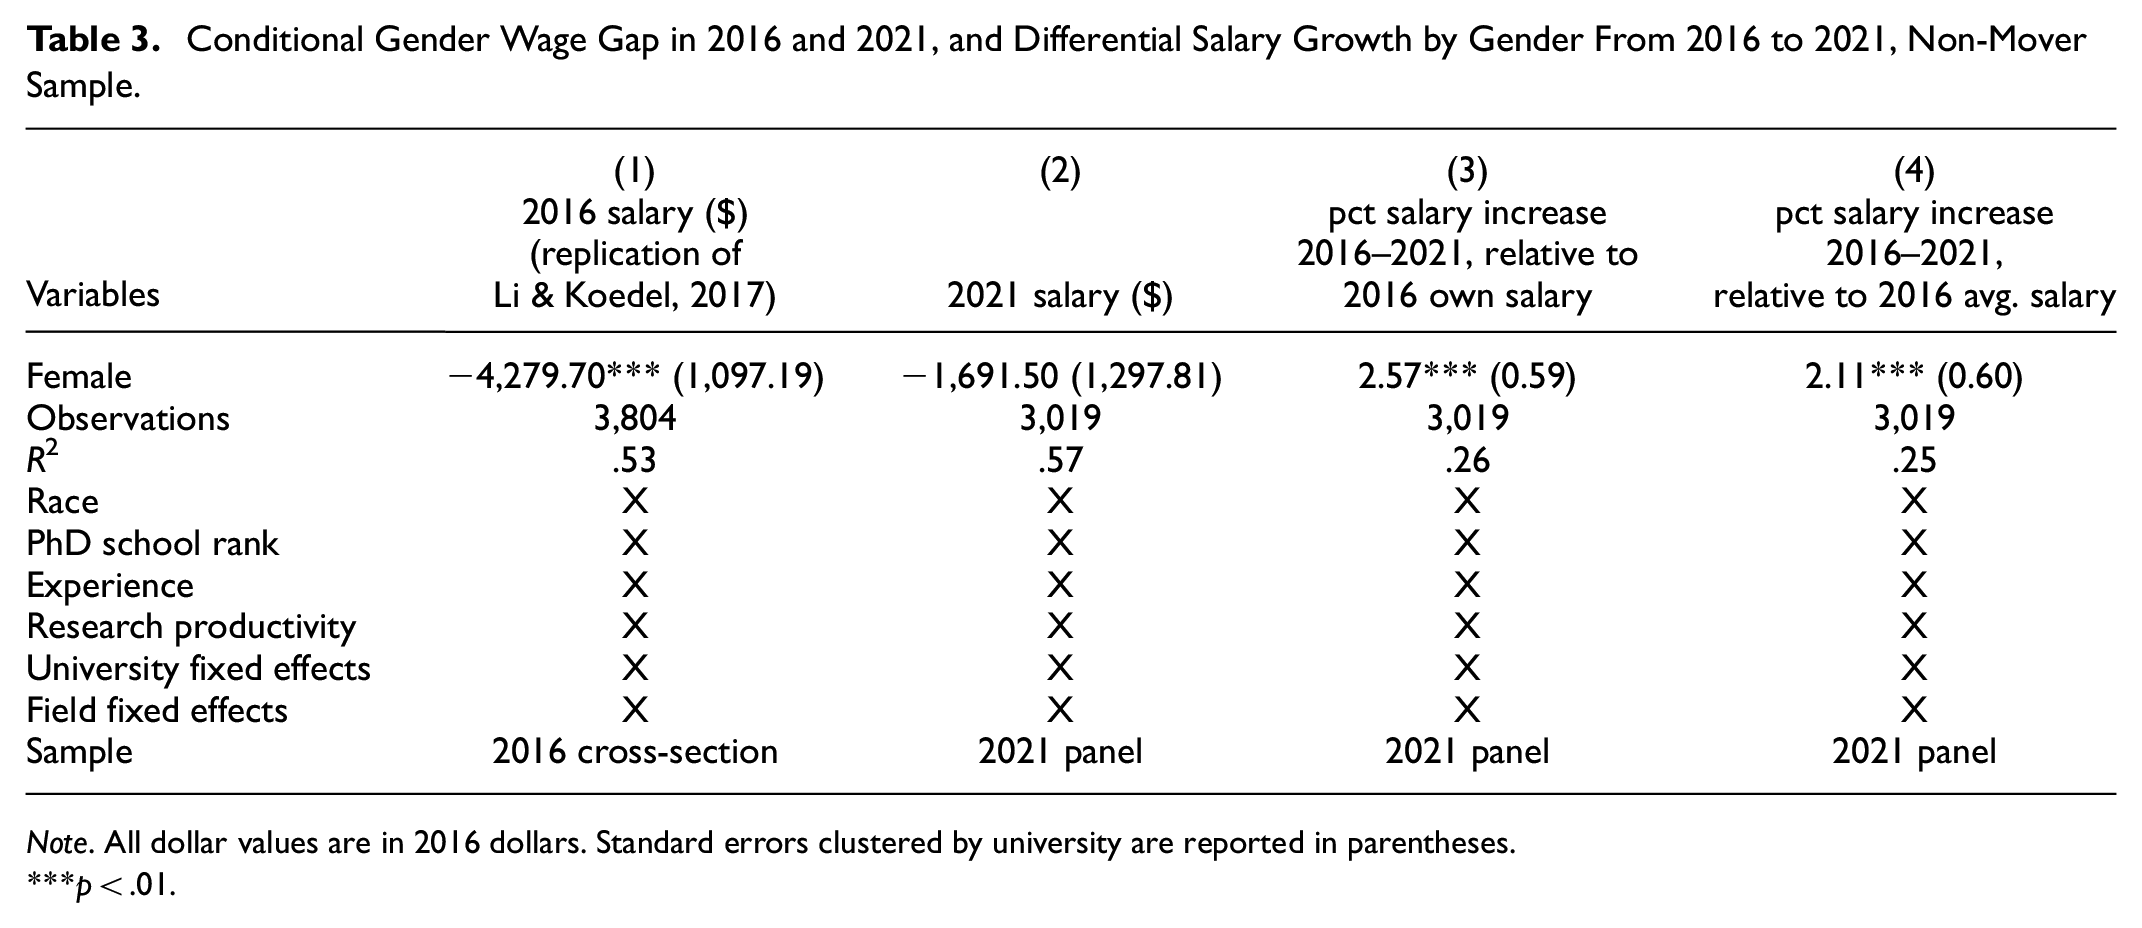
Note. All dollar values are in 2016 dollars. Standard errors clustered by university are reported in parentheses.
p < .01.
Next, we estimate the gender wage gap for the faculty we track through 2021. We convert all 2021 dollar values to 2016 dollar values so the units are real. We begin with the sample of faculty who did not change academic institutions between 2016 and 2021, who comprise most of our sample. We incorporate mobile faculty into the analysis below.
First, we re-estimate equation (2) using the same right-hand-side variables from the 2016 data collection, but replace the 2016 wage with the 2021 wage on the left-hand side. The values for most of the independent variables do not change between 2016 and 2021 (e.g., field, demographics, and PhD granting institutions) or the change in inconsequential (e.g., experience, since all faculty increment together). The one variable that does change is the h-index. We prefer to use the baseline 2016 value, which facilitates the cleanest interpretation of our estimates as showing the evolution of gender wage gap from 2016 to 2021. This is because any concurrent gendered change in research productivity could be endogenous. For example, if the U.S. academic environment has become generally more supportive of female faculty during the panel period, we might expect wages and research productivity to be affected, in which case controlling for the change in research productivity on the right-hand-side of the equation would give a misleading estimate of the gendered change in the wage gap. That said, in the appendix (Table A5), we show this issue is not important substantively.
We also re-estimate equation (2) after changing the dependent variable to measure wage growth in percentage terms. In column (3), we measure wage growth from 2016 to 2021 for each faculty member as a percentage of the faculty member’s own 2016 salary; that is, the dependent variable is

Next, in column (4), we change the dependent variable to measure wage growth as a percentage of the sample average 2016 salary as follows:

where
Results from the 2021 wage regression are reported in column (2) of Table 3, which shows the unexplained gender wage gap fell by 60% over the period covered by the data panel among faculty who remained at their 2016 institutions, from over $4,200 in 2016 to less than $1,700 in 2021. We use a bootstrap to test the statistical significance of this decline and find that the reduction is significant (p < .01). The insignificant 2021 estimate of $1,692 corresponds to 1.2% of the sample-average 2021 wage. In columns (3) and (4), we also report statistically significant and economically meaningful differences in real wage growth between men and women during the panel period. Column (3) shows women’s salaries grew 2.57% faster than men’s salaries, on average. The wage-growth gap is smaller when measured against the sample average wage, as expected, in column (4). However, at 2.11%, it is still economically meaningful and statistically significant.
In Table 4, we test for heterogeneity between fields that differ by female representation. Gender differences in representation across fields are well-documented in the U.S. (e.g., Chen & Crown, 2019; Umbach, 2006) and internationally (e.g., Brower & James, 2020). This analysis is motivated by the hypothesis that field-level gender representation could influence labor market dynamics in gender-specific ways. For instance, women may receive pay premiums in fields in which they are underrepresented. Or they may experience less inequity as their representation rises within a field (although bias may remain—see Casad et al., 2022).
Salary Growth Heterogeneity Between Fields With High and Low Female Representation, Non-Mover Sample.

Note. Low representation fields are biology, chemistry, and economics. Standard errors clustered by university are reported in parentheses.
p < .05.
We combine biology, chemistry, and economics as fields with relatively low female representation and educational leadership and policy, English, and sociology as fields with relatively high female representation. For these fields specifically, Li and Koedel (2017) show that women account for 18% to 31% of faculty in the low-representation fields and 47% to 53% of faculty in the high-representation fields. We test for heterogeneity by adding an interaction between the female indicator variable and an indicator for low-female-representation fields (note the level effects of low-representation fields are subsumed by the field fixed effects). As dependent variables, we use the wage-growth measures shown in equations (3) and (4).
The results indicate that women in low-representation fields receive larger raises, but not uniformly. In the model where wage growth is calculated from the individual-level base (as in equation 3), the coefficient on the interaction term is positive but small and insignificant. However, in the model where we use the sample average wage as the base for calculating wage growth (as in equation 4), the interaction coefficient is large and significant. This pattern of results indicates the largest wage increases accrue to women who satisfy the following two conditions: (1) they work in low-representation fields, and (2) they had relatively high wages in 2016. The latter condition must be true because the estimated wage increase is higher relative to the sample average baseline wage (column 2) than their own 2016 wages (column 1). This finding is consistent with evidence from Leslie et al. (2017), who show that diversity objectives in organizations can generate an earnings premium for “high potential” women.
Is the Gender Wage Gap Really Narrowing? Data Issues and Faculty Mobility
In this section, we conduct tests to (a) assess whether our findings could be biased by changes to the composition of faculty in the data panel over time and (b) examine the influence of faculty mobility on the gap. These are related but distinct issues. With the former, the concern is there could be differential attrition from the data panel by gender correlated with wages. Faculty mobility is one source of attrition—especially mobility outside of the public sector—but there are other sources of attrition as well. Differential attrition by gender correlated with wages could be a source of bias that would lead us to estimate a narrowing gender wage gap even when the gap has not truly narrowed (i.e., due to a change in the composition of our sample rather than a real change in gender wage dynamics). With regard to faculty mobility specifically, in addition to affecting attrition, mobility can affect the wage gap through gender differences in the earnings returns to mobility (Blackaby, Booth, & Frank, 2005; Groysberg, Healy, & Lin, 2022).
To explore the general concern of bias-inducing sample attrition, we begin with a summary test for selection into our panel sample of non-movers with 2021 wage data. To do this, we estimate equation (2) for the 3,019 non-mobile faculty who comprise the panel sample, but model their 2016 wages rather than their 2021 wages. If there is differential attrition from the 2021 sample by gender, and it is correlated with wages, we should expect the 2016 gender wage gap to differ when estimated using the full 2016 cross-section (N = 3,804) versus the panel sample of non-movers (N = 3,019).
Table 5 shows the results. The 2016 wage gap estimated for the panel sample of non-movers is nearly identical to the 2016 wage gap estimated for the full sample—the estimates are about $60 apart and statistically indistinguishable. These results give no indication of problematic attrition from the sample that could lead to bias in our 2021 wage-gap estimate.
Conditional Gender Wage Gap in 2016 Using the Original Cross-Sectional Dataset (N = 3,804) and the Panel Sample of Non-Movers (N = 3,019).

Note. All dollar values are in 2016 dollars. Standard errors clustered by university are reported in parentheses.
p < .01.
To explore the attrition issue further, and as a lead-in to a deeper investigation of faculty mobility, Table 6 provides detailed documentation of the sources of attrition from the data panel by gender. The first row shows that men are 4.4 percentage points more likely to exit the data panel between 2016 and 2021, with the difference concentrated primarily in retirements (which account for 4.0 of the 4.4 percentage-point difference). This is not surprising because male faculty are older and more experienced than female faculty, on average, reflecting their historical overrepresentation in academia (Ceci et al., 2014; Ginther and Hayes, 2003).
Sample Attrition From Non-Mover Sample by Gender, Overall, and by Cause.

p < .01.
A simple way to assess whether the narrowing gender wage gap is due to differential retirement behavior between men and women is to focus on faculty outside of the typical retirement window. In our data, the median 2016 experience level among faculty who retire by 2021 is 38, and experience at the 25th percentile of retirees is 32. In Appendix Table A6 we replicate the results in columns (2) to (4) of Table 3 but restrict the sample to faculty with experience at or below 30 in 2016 to reduce the influence of retirees. The findings are similar to our main results, indicating that the narrowing wage gap is not driven by gender differences in retirements.
Outside of retirements, there are no meaningful (or statistically significant) gender differences in the reasons for attrition from the data panel, which is broadly consistent with our overarching test for selective attrition in Table 5. However, faculty mobility can also affect the wage gap through gender differences in post-move wages. That is, although men and women change jobs at roughly equal rates, they could experience different pay changes with their new employers. Given our focus on wage gaps within academia, academic movers are of primary interest.
To gain further insight into the mobility question, in Appendix Table A7 we provide detailed summary statistics broken out by gender for academic movers in the sample. The table shows that of all female academic movers, 58%, 33%, and 9% moved to public, private, and foreign universities, respectively; the comparable numbers for men are 49%, 33%, and 18%. Male movers have much higher pre-move earnings unconditionally, though this is driven by the many descriptive differences between movers by gender (most notably field differences, and to a lesser degree, differences in experience and rank). Movers of both genders to other public U.S. universities—for whom we can track post-move wages—experience substantial wage gains during the panel period. Male movers have earnings that are 53% higher post-move, compared to 43% for women, on average.
To assess whether public-university movers influence our conclusions about the evolution of the conditional wage gap, we add them back into the data panel and re-estimate the wage model in equation (2). Column (1) of Table 7 shows that adding these faculty back into our dataset has no substantive impact on our findings—our estimate of the 2021 wage gap is similar to what we show in Table 3 and remains statistically insignificant. This is the product of two factors: (1) although male movers experience higher wage growth than female movers, the gap is modest and (2) most faculty do not move, limiting the influence of movers on the sample-wide gap. We conclude that the gender wage gap has narrowed at public U.S. research universities between 2016 and 2021, and that this is true, inclusive of faculty who move within the public sector.
Conditional Gender Wage Gap in 2021, Inclusive of Academic Movers.

Note. All dollar values are in 2016 dollars. Standard errors clustered by university are reported in parentheses. Imputed wages in column (2) are based on observed, gender-specific wage growth (in percent terms) for movers for whom post-move wages are observed. See text for details.
p < .01.
Our study is most informative about the public sector wage gap because our baseline sample is comprised of public-sector faculty (the public sector gap is also the target parameter in many recent faculty studies—e.g., see Chen & Crown, 2019; Li & Koedel, 2017; Obloj & Zenger, 2022; Taylor et al., 2020). That said, the fact that we also track faculty who exit the public sector allows us to provide at least some insight into how these outside movers are likely to influence the gap. For movers to private and foreign universities, we do not know their post-move wages, but we know who they are, which gives us their weight in the sample, and we know their baseline wages. To estimate their likely impact on the evolution of the gender wage gap in our sample, we use observed moves within the public sector to parameterize their expected returns to mobility. Specifically, we assume a 43% earnings increase for all female movers and a 53% increase for all male movers with unobserved post-move wages.
Using this parameterization, we add all academic movers back into the panel sample and re-estimate equation (2). The results are in Column (2) of Table 7. We estimate the 2021 gender wage gap is about $2,800, or about 2% of the average faculty member’s salary. This estimate is still below our estimate from 2016 but implies a lesser reduction of the gender wage gap. This is our best estimate of the gap inclusive of all academic movers in our original sample. If gender differences in the returns to mobility at private and foreign universities are different than in the public sector, the total gap inclusive of all movers could be larger or smaller.
Possible Explanations for Our Findings
Gendered Changes in Promotion Rates Do Not Explain the Narrowing Wage Gap
There is a related literature on the gender gap in promotions among U.S. faculty, which is relevant because promotion gaps will likely be reflected in wages. Historically, promotion gaps have favored men, although, in more recent studies, the evidence on promotion gaps is mixed (Ginther & Hayes, 2003; Ginther & Kahn, 2006, 2021; Weisshaar, 2017). In studies that do find promotion gaps, gaps are more common at the associate-to-full than assistant-to-associate level (Durodoye et al., 2020). An expectation based on the literature is that in our data—that is, recent data pooled across the six fields originally sampled by Li and Koedel (2017)—promotion gaps should be small-to-null, and if anything, favor men. In the remainder of this section, we test for evidence that promotion gaps have shifted toward favoring women since 2016, which could contribute to the narrowing gender wage gap. We find no evidence that the promotion gap has shifted to favor women in our data.
We estimate promotion gaps separately at the assistant-to-associate and associate-to-full levels. The first model is estimated using only assistant professors from 2016, and the second uses only associate professors from 2016. Each model’s structure is the same as equation (2). We use as the dependent variable a binary indicator equal to one if a promotion occurred between 2016 and 2021, and zero otherwise. Faculty who are observed at the rank of assistant professor in 2016 and associate or full professor in 2021, or at the rank of associate professor in 2016 and full professor in 2021, are coded as having been promoted during the panel period. Promotions can occur at the original 2016 university or a new institution. If the individual left academia between 2016 and 2021, or if they are observed at the same rank as in 2016 (even if they changed institutions), we code the promotion variable as zero—that is, a promotion did not occur.
Because the coding of promotions does not require wage data, we estimate the promotion regressions using all assistant and associate professors in the 2016 cross-sectional dataset regardless of the availability of 2021 wage data. In a vacuum, this decision makes the most sense. However, it raises the possibility that sample composition changes could confound the connection between our promotion and wage models. We address this issue by also estimating a model of associate-to-full promotions using only associate professors in 2016 with observed wages in 2021. We cannot estimate similarly restricted models for assistant professors because their presence in the 2021 wage data is more likely to be affected by the promotion outcome. In other words, tenure denial is one way that a faculty member would exit our data panel.
As a caveat to this analysis, we acknowledge that a non-promotion outcome does not necessarily mean the faculty member failed to be promoted. It may simply be that he or she did not reach their promotion window during the panel period. This should not cause bias in the estimated gender gaps unless men and women are differentially bunched toward or away from their promotion windows, which seems unlikely. Still, to be thorough, we estimate versions of the promotion models that replace the linear experience control with experience fixed effects. These exact-experience-conditional models are conceptually appealing because they force comparisons to occur only between faculty with the same experience values. However, as a practical matter, our findings are not affected by how we control for experience (see Appendix Table A8).
Columns (1) and (2) of Table 8 report the results from our assistant-to-associate and associate-to-full promotion regressions. Column (3) shows the version of the associate-to-full regression restricted to faculty with 2021 wages. The analytic samples include 663 assistant professors and 1,111 associate professors (1,004 of whom have 2021 wages) from the original 2016 cross-section, for which summary statistics are reported in Table 2.
Gender Gaps in Promotions.
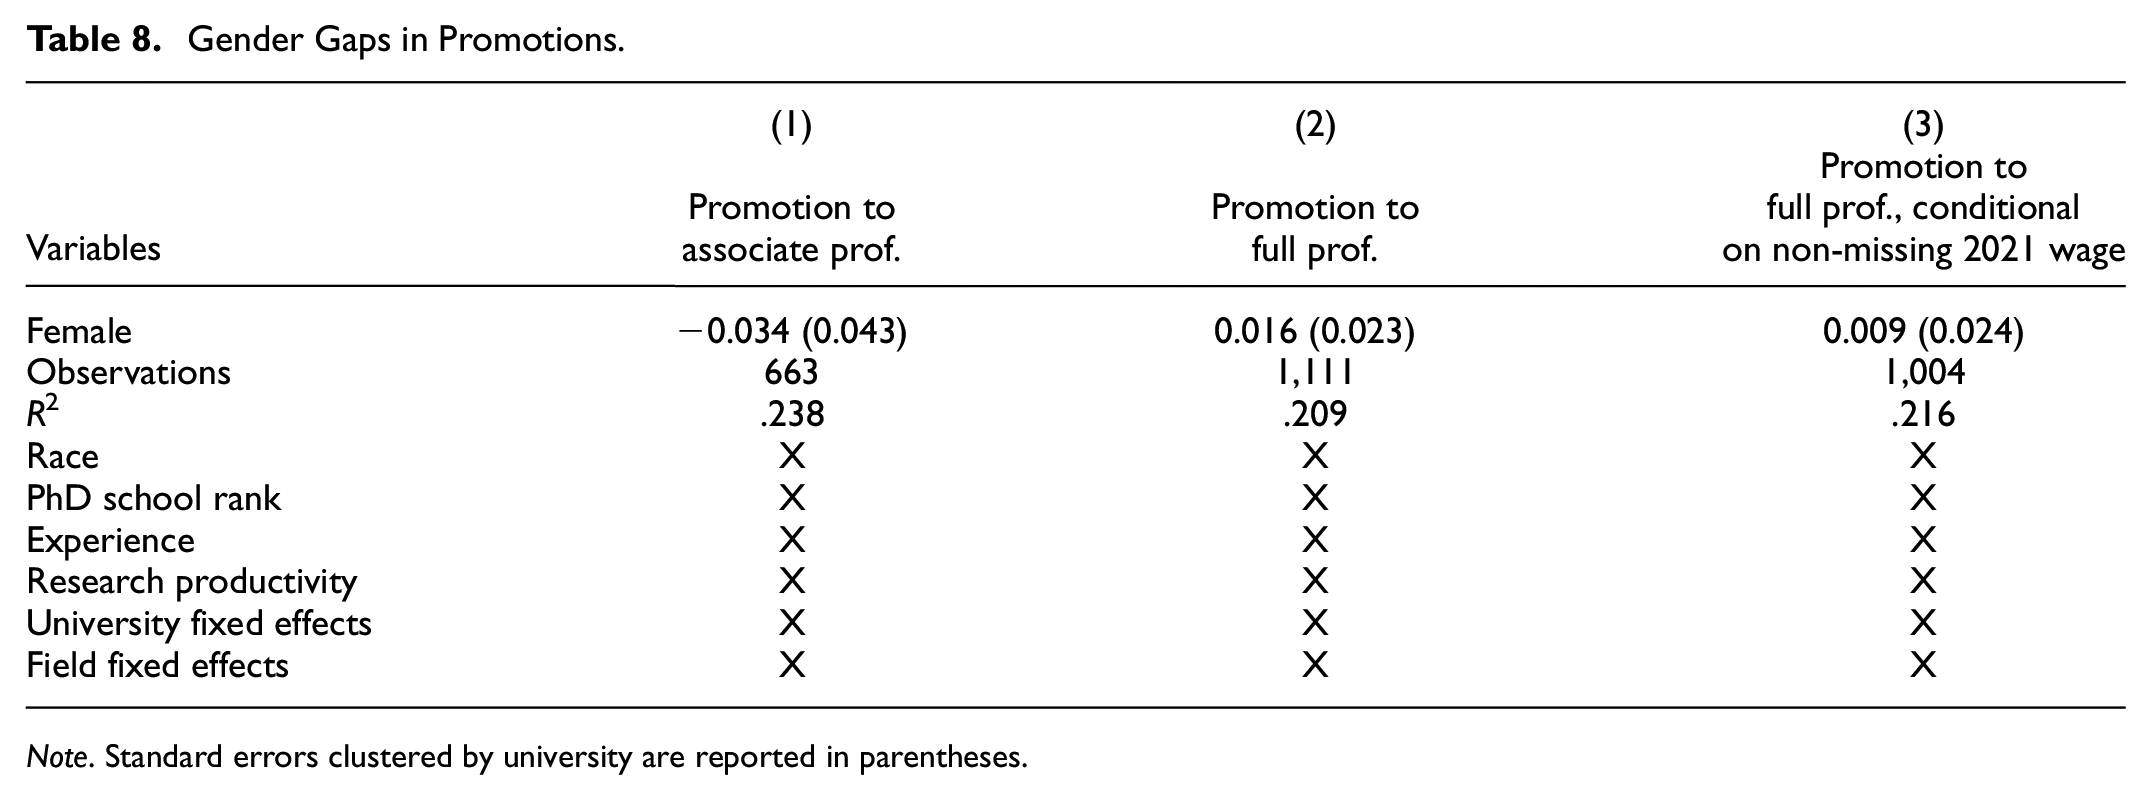
Note. Standard errors clustered by university are reported in parentheses.
None of the estimates in Table 8 indicate statistically significant differences in the conditional likelihood of promotion by gender. The point estimates are also inconsistent in sign between promotion levels. In Appendix Table A9, we further test for heterogeneity in promotion gaps between high- and low-female representation fields and find no evidence of heterogeneity, albeit with the caveat that our promotion models are not well-powered to detect field heterogeneity. Overall, these findings give no indication of differential promotion rates by gender, which we interpret as broadly consistent with other studies using recent data. We conclude that a shift in promotion rates favoring women is not a mechanism by which the gender wage gap is narrowing.
Women Are More Likely to Receive Large Raises
Next, we test whether male and female faculty differ in their likelihoods of receiving large raises. We hypothesize that women may have been more likely to receive large raises during the panel period for two reasons. First, the emphasis on equity in academia may have empowered female faculty and increased their willingness-to-move. Relatedly, on the demand side, it may have created more outside options for female faculty, especially in fields where women are traditionally underrepresented (e.g., business, economics, and most traditionally-defined STEM fields).
Unconditionally, Table 6 shows that men and women moved at similar rates from 2016 to 2021, on average (in results omitted for brevity, we confirm this result holds conditionally as well). Still, even this “null finding” could represent a shift in behavior if men have been more likely to move historically, which seems plausible because men are more likely to be the primary earners in their families (Bernard, 1981; Haas 1986; Ward, 2001). Moreover, move rates in isolation paint an incomplete picture of willingness-to-move because home universities can respond to external offers to retain faculty. Using data on economists from the United Kingdom, Blackaby, Booth, and Frank (2005) show that women have historically received fewer outside offers, but whether this is true in more recent data is uncertain. In summary, push and pull factors may have changed women’s willingness and opportunities to move and, correspondingly, their likelihoods of receiving large raises.
The second reason women may be disproportionately likely to receive large raises is a direct consequence of administrator efforts to promote pay equity on university campuses, independent of any gender-based changes in willingness-to-move or outside opportunities. These efforts are exemplified by the formation of committees and commissions on gender equity at many institutions, such as at Louisiana State University and Rochester University as mentioned in the introduction. A report from the Commission on Women and Gender Equity in Academia (2018) at Rochester University provides a general sense of contemporary sentiment in this regard.
Although we lack data to disentangle these underlying mechanisms, we conduct summary tests to determine whether women were more likely to receive large raises during the period we study from 2016 to 2021. We use the specification shown in equation (2) where the dependent variable is a binary indicator for a “large” raise occurring over the panel period. Our preferred definition of a large raise is 30% or more (in real dollars); Table 2 shows that among all non-mobile faculty, 12% received a raise at least this large. We also estimate models where we define a large raise more conservatively, as 20% or more. We estimate models of large-raise events using the non-mover sample and the sample inclusive of public-university movers for whom post-move wages are observed.
Table 9 shows that female faculty disproportionately received large raises during the panel period, driven by raises among non-mobile faculty. In addition to being statistically significant, the gender differences in Table 9 are economically meaningful. Using our preferred definition of a large raise of at least 30%, non-mobile women were 3.3 percentage points more likely to receive a large raise than non-mobile men, which is 27.5% of the sample average rate. Inclusive of mobile faculty, the gender gap in large-raise events attenuates very slightly—to 3.2 percentage points—because more males than females received a large raise as part of a move. However, similarly to above, including movers has a negligible impact on the full-sample estimate. These findings indicate the narrowing of the gender wage gap is driven partly by a higher prevalence of large raises among female faculty, and in particular, non-mobile female faculty.
Gender Differences in Large-Raise Events.

Note. Wage increases are calculated in real dollars. Standard errors clustered by university are reported in parentheses. About 23% and 14% of the panel sample (non-movers) received raises ≥20% and ≥30%, respectively (see Table 2).
p < .05. ***p < .01.
Potential Factors Underlying Our Results
The explanations for our findings addressed in the preceding two sections are best described as mechanical. However, there are deeper factors suggested by previous research that could underlie our findings. These factors are connected to the greater emphasis on equity in academia during the period covered by our data panel and are either (a) complements to equity-focused policies or (b) ways in which equity-focused policies may be operationalized.
First, a prominent complementary factor is the increased salience of pay transparency at U.S. public universities (Bae et al., 2022; Baker et al., 2021; Obloj & Zenger, 2022). During the period we study, there were no changes in the legal landscape regarding pay transparency in our sample of universities. However, it is possible that with the increased focus on pay equity on university campuses, the salience of publicly-available salary data increased.
Another possible factor is that women may be receiving more credit for their work. Hussey et al. (2022), Ross et al. (2022), Sarsons (2017), and Sarsons et al. (2020) show that women receive less credit for coauthored work, especially when their coauthors are men. Related evidence from neuroscience shows that article reference lists include more papers with men as first and last authors—where prominent authors are typically listed—than would be expected if citations were gender neutral (Dworkin et al., 2020). It is speculative to say the gender dynamics of work attribution are changing; but it is possible and would be consistent with the increased focus on equity at academic institutions.
Finally, changing policies, norms, and perceptions surrounding tenure clock stoppages may be contributing to the narrowing gender wage gap. Using data from the late 1990s and early 2000s, Manchester et al. (2013) find that faculty who stop the tenure clock for family reasons incur salary penalties relative to those who do not. They further show this cannot be explained by differences in productivity. Women do not benefit from increasingly popular gender-neutral clock-stopping policies in terms of tenure rates (Antecol et al., 2018), but this does not preclude these policies—or changes in how they are perceived—from leading to more equitable pay. For example, the salary penalties associated with family leaves may be declining as family leaves are normalized broadly in the profession.
Conclusion
We use a recent panel dataset from 2016 to 2021 to study the evolution of the conditional gender wage gap among faculty at public universities in the U.S. The wage gap declined markedly from 2016 to 2021, falling from 3.6% to 1.2% of the average faculty member’s salary among those who remained at their original 2016 institutions. During this period, female faculty were disproportionately awarded atypically large raises. Accounting for faculty who moved within the public sector does not substantively change our findings—for example, inclusive of these mobile faculty, we estimate the 2021 wage gap was only marginally higher, at 1.3% of the average faculty member’s salary.
Although we cannot resolve the discrepancy in the extant literature about whether our findings reflect a continuation of a declining trend in the gap (as implied by Obloj & Zenger, 2022) or a sharp departure from decades of stagnation (as implied by compiling evidence from numerous cross-sectional studies such as Barbezat & Hughes, 2005; Carlin et al., 2013; Chen & Crown, 2019; Li & Koedel, 2017; Porter et al., 2008; Taylor et al., 2020; Toutkoushian, 1998; Toutkoushian & Conley, 2005), we provide some clarity by anchoring our panel analysis to the bulk of the previous literature via our replication of the original Li and Koedel (2017) estimates. Although the trend in the gap—or lack thereof—prior to 2016 remains uncertain, we show that between 2016 and 2021, the gap meaningfully declined, at least among faculty at public universities.
We are limited in our ability to test for the deeper mechanisms underlying our findings, but we hypothesize they may be the result of the rapidly shifting culture in academia emphasizing pay equity during the time period we study. This shift could be directly impacting women through explicit equity-targeted initiatives and/or by influencing the dynamics of the faculty labor market in ways that favor female faculty (also see Leslie et al., 2017). The focus on pay equity may also be complemented by other equity improving policies identified in previous research, such as pay transparency in the public sector, among others.
We conclude by noting a caveat to our findings, which stems from the fact that our sample is restricted to faculty working at selective public research universities in the U.S. in 2016. While tracking the same faculty over time is beneficial because it allows us to clearly assess the evolution of the gender wage gap in a fixed sample, our analysis is necessarily restricted to incumbent faculty in 2016. As a result, we do not observe any potential gender differences in wage offers at entry. Previous evidence on the gender wage gap at entry is mixed, with findings ranging from a modest gap favoring men to an insignificant gap (Porter et al., 2008; Toumanoff, 2005; Rabovsky & Lee, 2017). It would be interesting to see if the narrowing gap among incumbent employees we document here is accompanied by changes in the gap among new entrants.
Footnotes
Appendix
Gender Gaps in Promotions With Field Heterogeneity.

| Variables | (1) | (2) | (3) |
|---|---|---|---|
| Promotion to associate prof. | Promotion to full prof. | Promotion to full prof., conditional on non-missing 2021 wage | |
| Female | −0.013 (0.065) | −0.009 (0.027) | −0.021 (0.025) |
| Female × (low representation field) | −0.034 (0.086) | 0.057 (0.042) | 0.067 (0.043) |
| Observations | 663 | 1,111 | 1,004 |
| R 2 | .24 | .21 | .22 |
| Race | X | X | X |
| PhD school rank | X | X | X |
| Experience | X | X | X |
| Research productivity | X | X | X |
| University fixed effects | X | X | X |
| Field fixed effects | X | X | X |
Note. Low representation fields are biology, chemistry, and economics. Standard errors clustered by university are reported in parentheses.
Acknowledgements
We thank Gabriel Gassmann and Ryan Grantham for their research assistance; Diyi Li and Eric Parsons for their inputs in previous versions of this work. All errors are our own.
Declaration of Conflicting Interests
The author(s) declared no potential conflicts of interest with respect to the research, authorship, and/or publication of this article.
Funding
The author(s) received no financial support for the research, authorship, and/or publication of this article.